
I have a lot for you to digest today. I appreciate your patience as yesterday with all of the graduation festivities I didn't get to work until about 9:30p PT. As I always tell you, I will not do this report if I can't have the proper amount of time. It requires solid analysis to be done right.
I've got three stocks for you to make up for yesterday and three ETFs for ETF Day today. The market is in trouble right now so finding longs was nearly impossible, but Energy (XLE) had a lot to offer today. I also have a software company and a high risk, high reward Cannabis ETF. Everything else revolves around Energy which I believe is going to be the star during this upcoming decline. It could succumb as well so watch those PMOs. If it begins to turn down along with Stochastics, it is likely time to have your finger on the SELL button.
While I don't give you sell signals on "Diamonds in the Rough", you can figure them out just by looking at price action, the PMO, RSI and Stochastics. When weakness develops on those indicators, it is usually time to act. I wanted to reiterate this as I do believe we have a major decline in the works.
Good Luck & Good Trading,
Erin
Today's "Diamonds in the Rough": ACCD, COP, FANG, MSOS, VDE and XOP.
** JULY VACATION **
I will be in Europe 7/14 - 7/27 so there will not be any Diamonds reports or trading rooms during that time. All subscribers with active subscriptions on 7/27 will be compensated with two weeks added to their renewal date.

RECORDING LINK (5/19/2023):
Topic: DecisionPoint Diamond Mine (5/19/2023) LIVE Trading Room
Passcode: May#19th
REGISTRATION for 5/26/2023:
When: May 26, 2023 09:00 AM Pacific Time (US and Canada)
Topic: DecisionPoint Diamond Mine (5/26/2023) LIVE Trading Room
Register in advance for this webinar HERE
After registering, you will receive a confirmation email containing information about joining the webinar.

Here is the last recording (5/22):
Welcome to DecisionPoint Diamonds, wherein I highlight ten "Diamonds in the Rough" per week. These are selected from the results of my DecisionPoint Scans which search for stocks that could benefit from the trend and condition of the market. Remember, these are not recommendations to buy or sell, but are the most interesting of the stocks that surfaced in my scans. My objective is to save you the work of the initial, tedious culling process, but you need to apply your own analysis to see if these stocks pique your interest as well. There are no guaranteed winners here!
"Predefined Scans Triggered" are taken from StockCharts.com using the "Symbol Summary" option instead of a "SharpChart" on the workbench.
Stop levels are all rounded down.
Accolade Inc. (ACCD)
EARNINGS: 06/29/2023 (AMC)
Accolade, Inc. engages in the provision of technology-enabled health and benefits solutions. The company was founded by Thomas K. Spann, J. Michael Cline, and Sudhir Steven Singh in January 2007 and is headquartered in Seattle, WA.
Predefined Scans Triggered: Elder Bar Turned Green, Bullish MACD Crossovers and P&F Bear Trap.
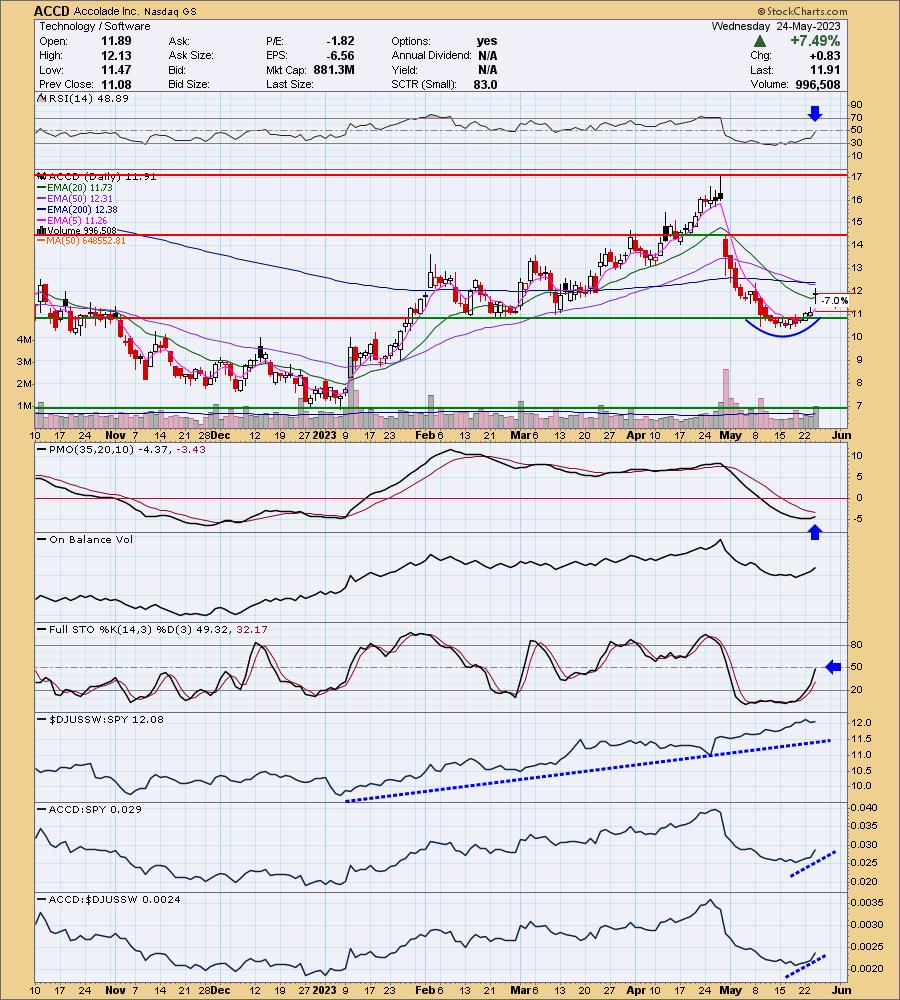
ACCD is up +0.67% in after hours trading. I really didn't want to present a tech stock, but this chart was too good to pass up. The price pattern is key. We have a near perfect rounded bottom going into a breakaway gap. The RSI is still negative, but it won't be for much longer if the rally can continue. The PMO is rounding up as well. Stochastics are rising strongly. The group has been a steady outperformer. ACCD is getting a late start on relative strength, but it is certainly coming in. The stop is set at 7% or $11.01.
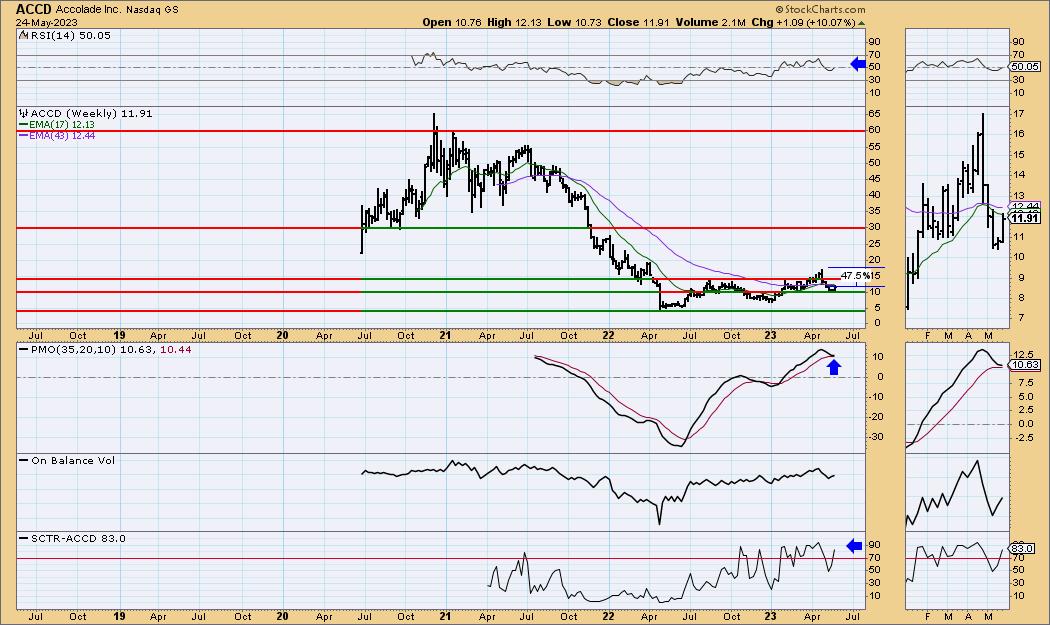
I've added the thumbnail to the weekly chart so that you can see that the weekly PMO is turning up above the signal line. It hasn't actually turned up yet, but if it does that would constitute a PMO Surge. The weekly RSI just entered positive territory and it already has a SCTR in the "hot zone" above 70*. Upside potential could be quite lucrative, but remember that in current market conditions, all of your investments should be considered short-term.
*If a stock is in the "hot zone" above 70, it implies that it is stronger than 70% of its universe (large-, mid-, small-caps and ETFs) primarily in the intermediate to long terms.
ConocoPhillips (COP)
EARNINGS: 08/03/2023 (BMO)
ConocoPhillips engages in the exploration, production, transportation and marketing of crude oil, bitumen, natural gas, natural gas liquids, and liquefied natural gas on a worldwide basis. It operates through the following geographical segments: Alaska, Lower 48, Canada, Europe, Middle East and North Africa, Asia Pacific, and Other International. The Alaska segment primarily explores for, produces, transports, and markets crude oil, natural gas, and natural gas liquids. The Lower 48 segment consists of operations in the U.S. and the Gulf of Mexico. The Canada segment consists of oil sands development in the Athabasca Region of northeastern Alberta and a liquids-rich unconventional play in western Canada. The Europe, Middle East and North Africa segment consists of operations and exploration activities in Norway, the United Kingdom and Libya. The Asia Pacific segment has explorations and product operations in China, Indonesia, Malaysia, and Australia. The Other International segment handles exploration activities in Columbia and Argentina. The company was founded in 1875 and is headquartered in Houston, TX.
Predefined Scans Triggered: Ichimoku Cloud Turned Green, Moved Above Ichimoku Cloud, P&F Double Top Breakout and P&F Bullish Triangle.
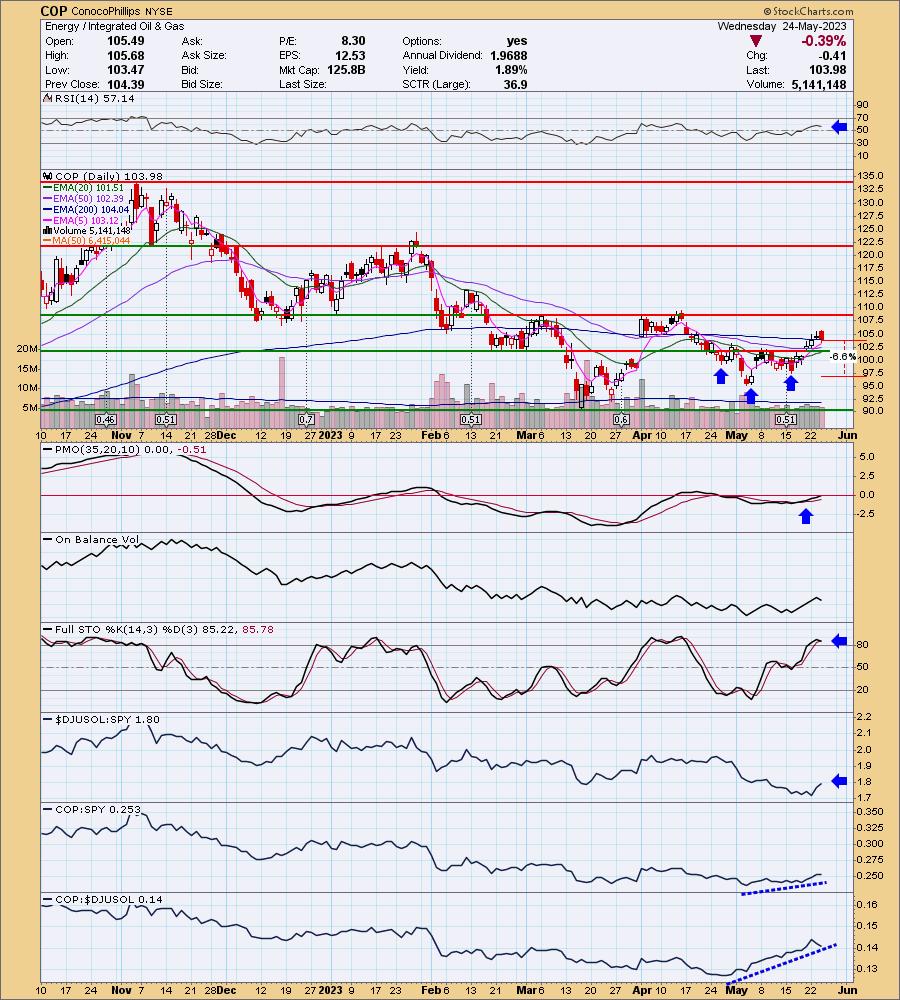
COP is unchanged in after hours trading. The price pattern looks like a reverse head and shoulders which is bullish. The upside target of the pattern is at overhead resistance at the April high. Remember targets are 'minimum' upside targets for the patterns. The RSI is positive and the PMO is sitting on the zero line after rising out of oversold conditions. Stochastics are oscillating above 80. The group is only now beginning to outperform and given the strong performance of COP, I am looking for a solid rally. The stop is set below the right shoulder at 6.6% or $97.11.
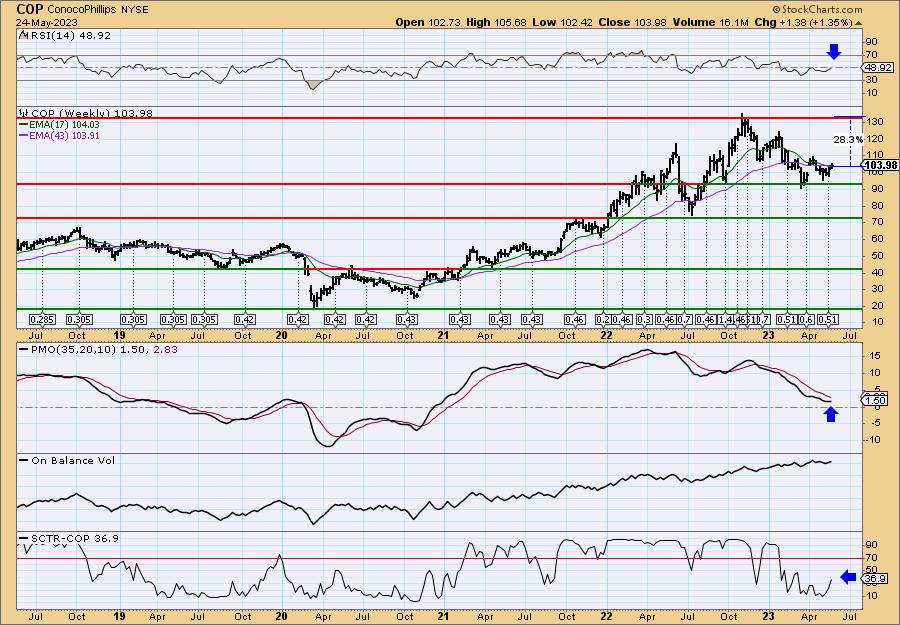
The weekly chart needs some work and it is doing that work. The RSI is nearly positive, the PMO is flattening and the SCTR is pushing higher quickly. Upside potential is over 28%, but again, all investments are short-term right now.
Diamondback Energy, Inc. (FANG)
EARNINGS: 07/31/2023 (AMC)
Diamondback Energy, Inc. is an independent oil and natural gas company, which engages in the acquisition, development, exploration, and exploitation of unconventional, onshore oil, and natural gas reserves. It operates through the Upstream and Midstream Services segments. The Upstream segment focuses on the Permian Basin operations in West Texas. The Midstream Services segment is involved in the Midland and Delaware Basins. The company was founded in December 2007 and is headquartered in Midland, TX.
Predefined Scans Triggered: None.
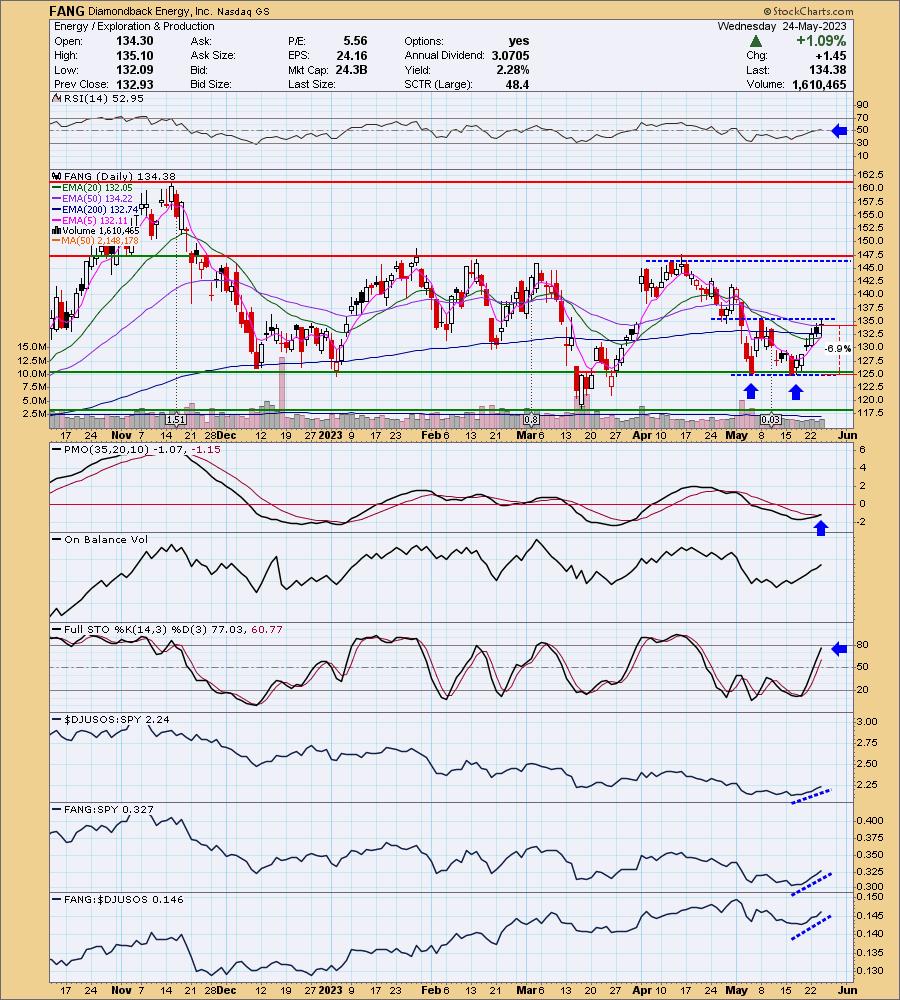
FANG is down -0.97% in after hours trading. I spotted a double-bottom on FANG. It hasn't been confirmed yet given we don't have a breakout above the confirmation line. Should the pattern execute, the minimum upside target is at overhead resistance at the April high. The RSI just moved into positive territory and there is a new PMO Crossover BUY Signal. Stochastics are rising strongly and should get above 80 soon. Relative strength is picking up for the group and FANG. The stop is set below the double-bottom pattern at 6.9% or $125.10.
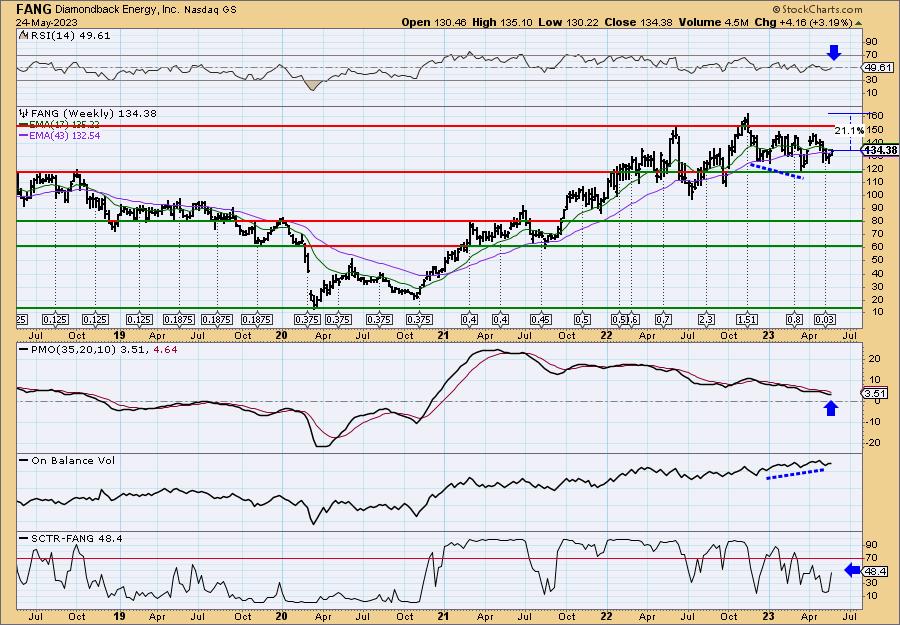
FANG has been range bound all year so the upside target is somewhat optimistic. However, the indicators are firming up. The weekly RSI is nearly in positive territory above net neutral (50). The weekly PMO is turning back up and the SCTR is coming back to life. I also spotted a bullish positive OBV divergence.
AdvisorShares Pure US Cannabis ETF (MSOS)
EARNINGS: N/A
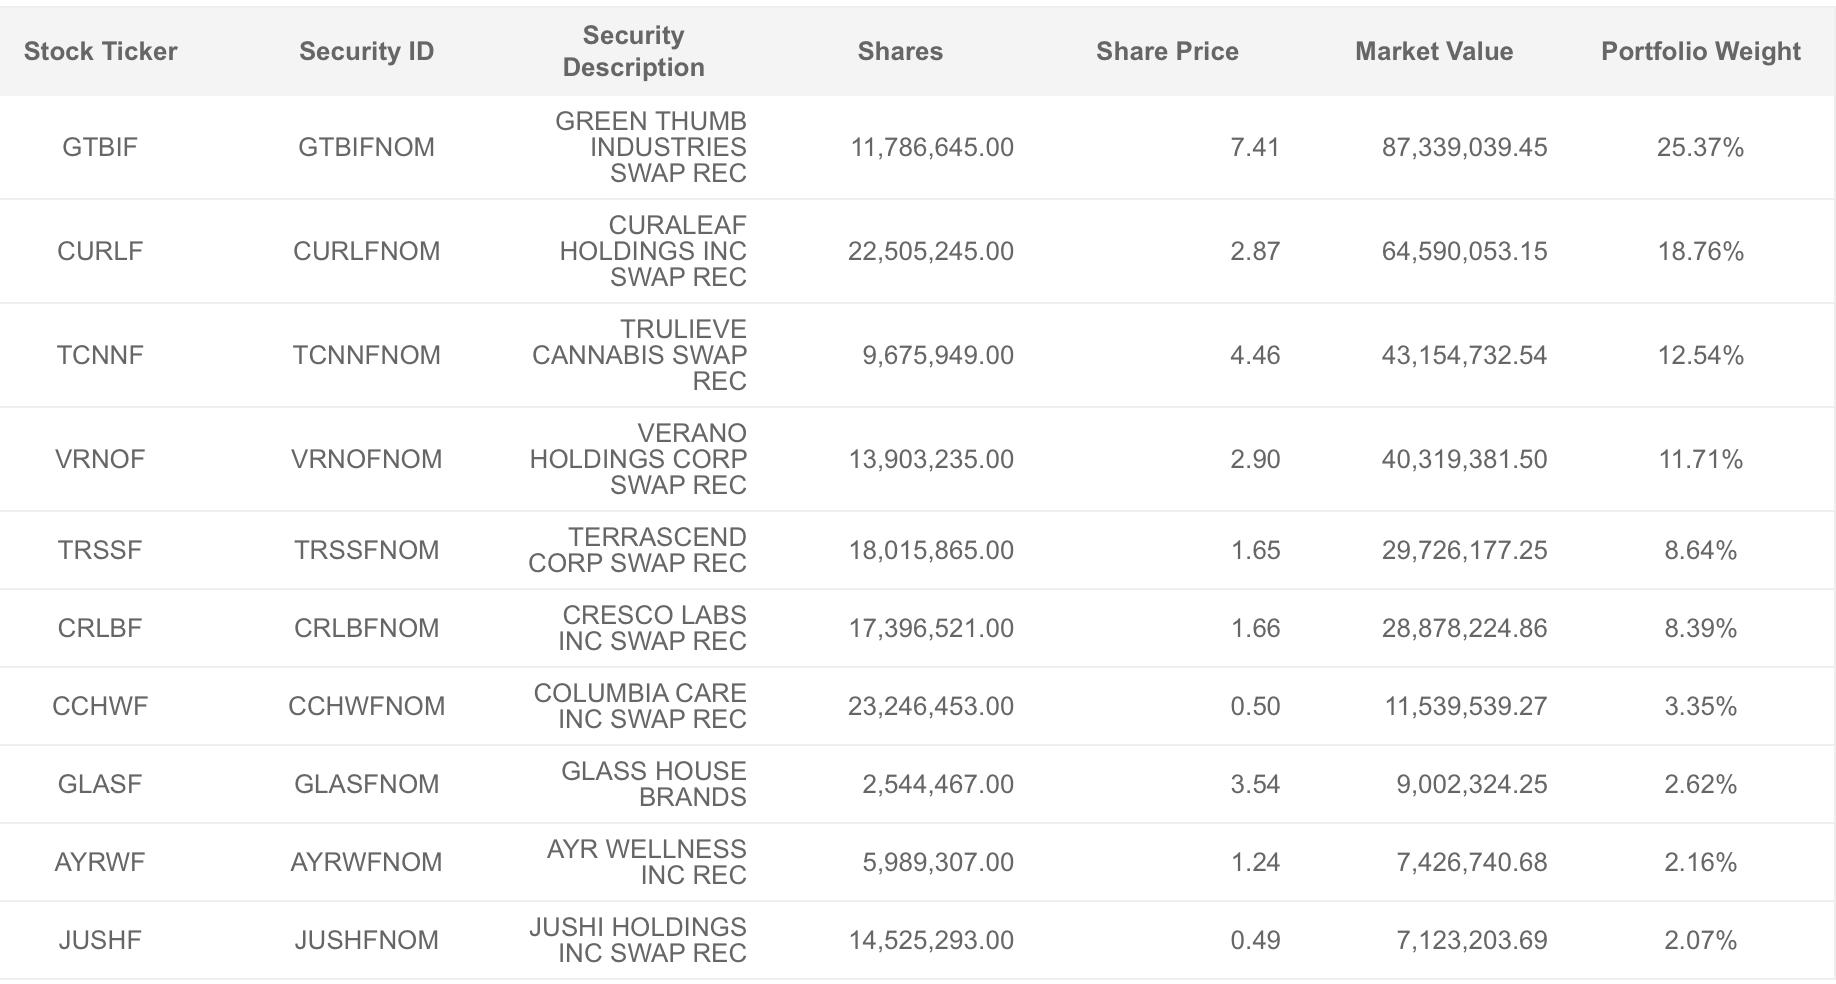
MSOS is an actively managed narrow portfolio of US stocks or swap contracts related to the domestic cannabis and hemp industry. Click HERE for more information.
Predefined Scans Triggered: Bullish MACD Crossovers, Entered Ichimoku Cloud and P&F Double Bottom Breakout.
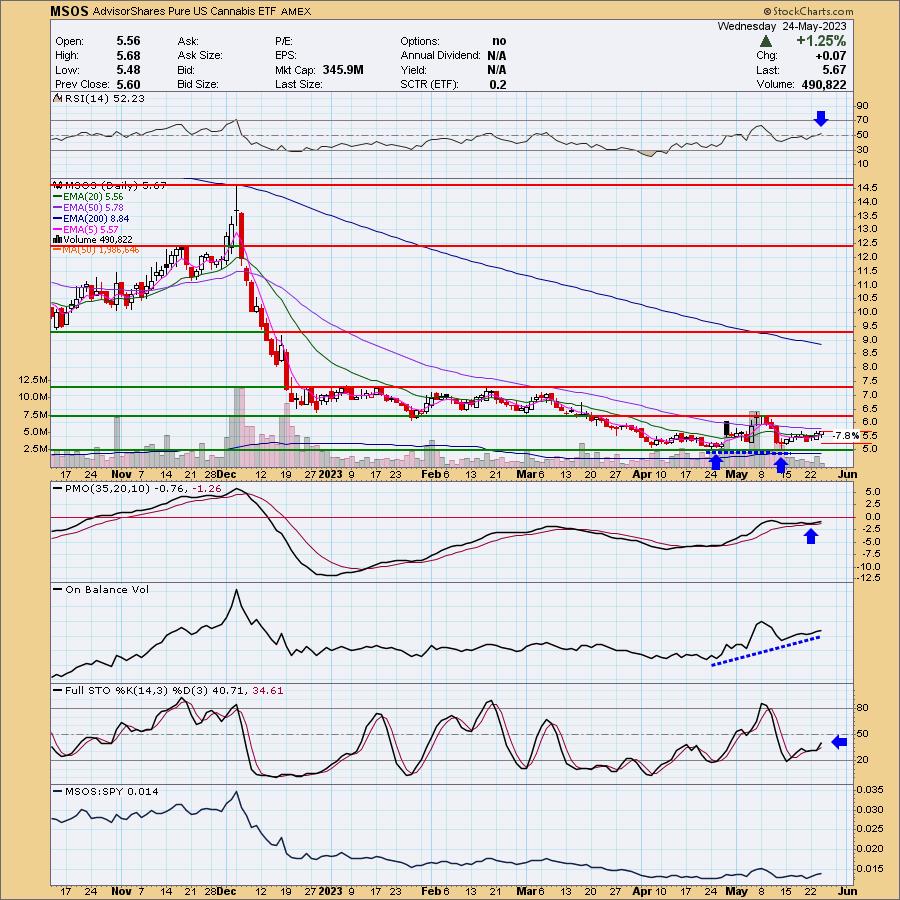
MSOS is down -0.88% in after hours trading. First, this is a low-priced ETF so position size wisely. This is not a trade for the faint of heart, but the earmarks are there to expect price to return to February highs. There is a bullish double bottom pattern. There is a strong positive OBV divergence (rising OBV bottoms, flat or declining price lows). The RSI is positive and the PMO has surged above the signal line. Stochastics are a little tentative, but ultimately are rising. MSOS has been performing in line with the SPY so we do have to be careful MSOS doesn't follow the SPY downward. The stop is set at the prior price low at 7.8% or $5.22.
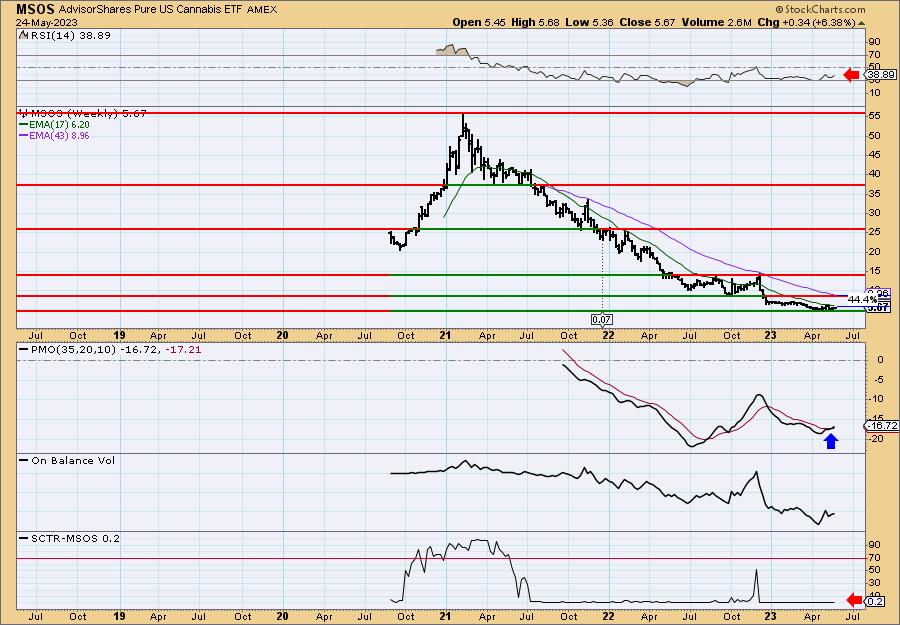
The weekly PMO looks great, the rest of the indicators...not so much. The weekly RSI is rising, but is well within negative territory. The SCTR is about as low as it goes. It's hard to believe this ETF was trading in the $40-$50 range! We have a weekly PMO Crossover BUY Signal. Upside potential is excellent, but I don't know if I could hold out for 44%.
Vanguard Energy ETF (VDE)
EARNINGS: N/A
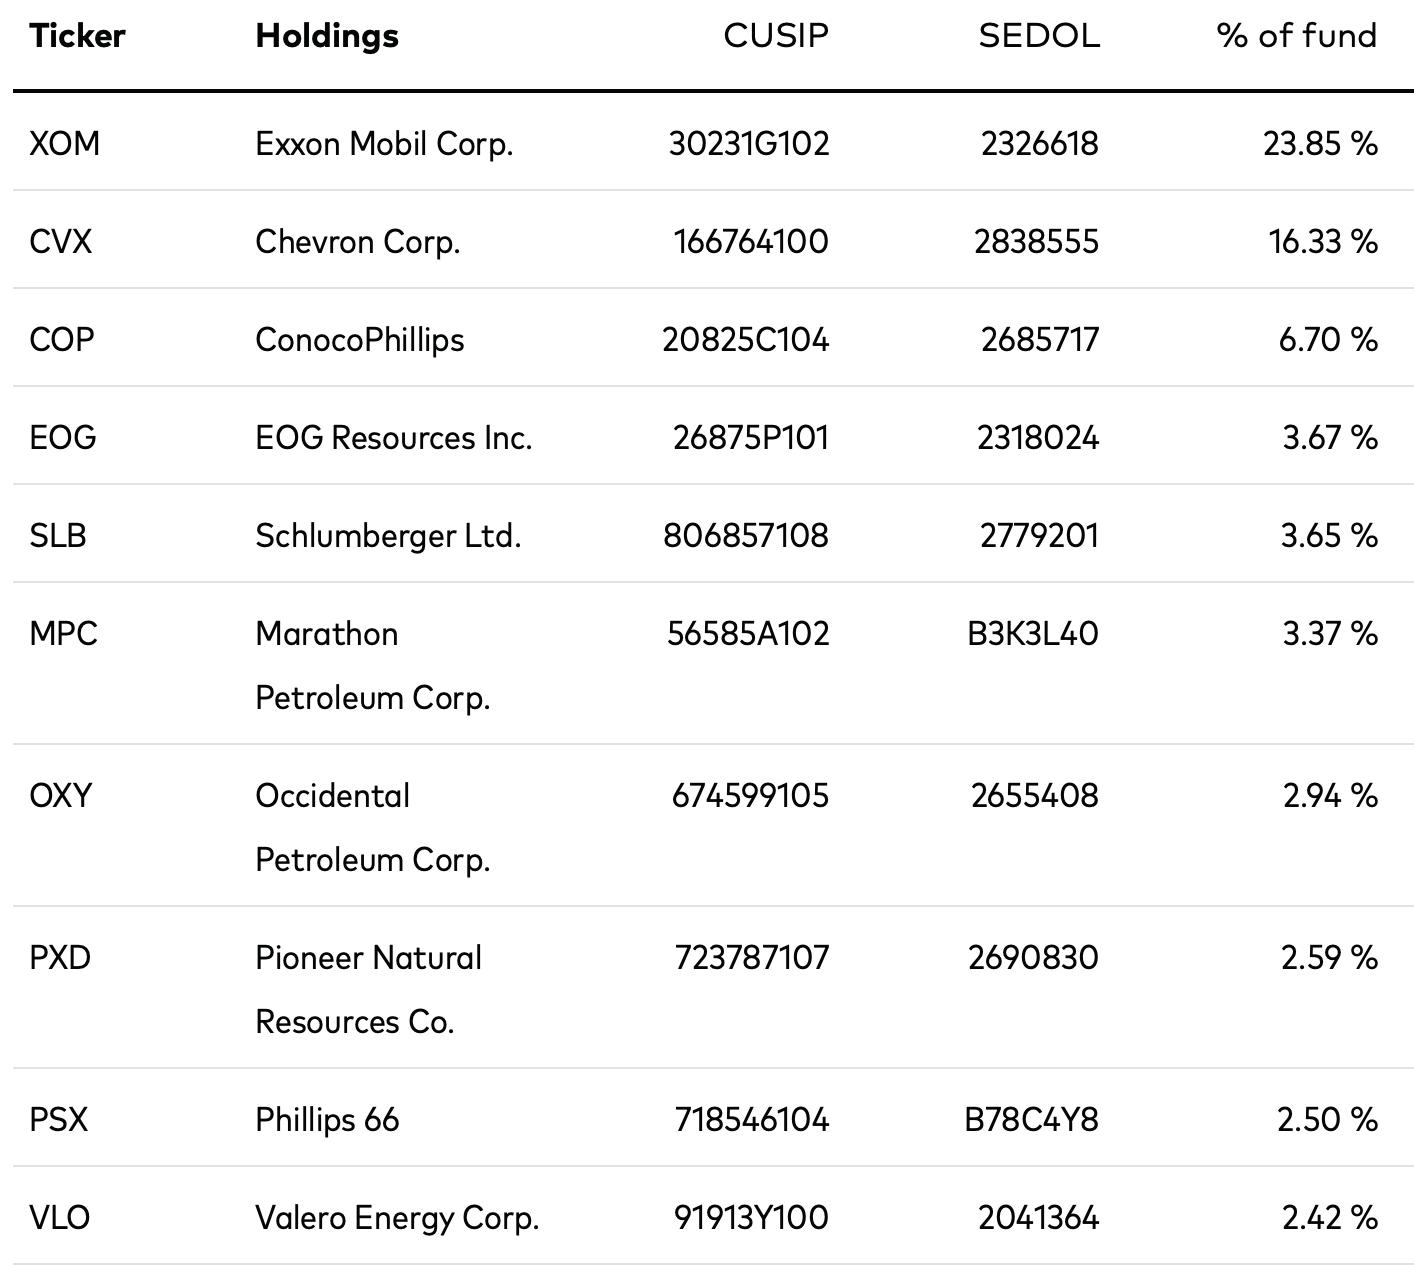
The fund tracks a market cap-weighted index of energy companies in the US. Click HERE for more information.
Predefined Scans Triggered: Filled Black Candlesticks.
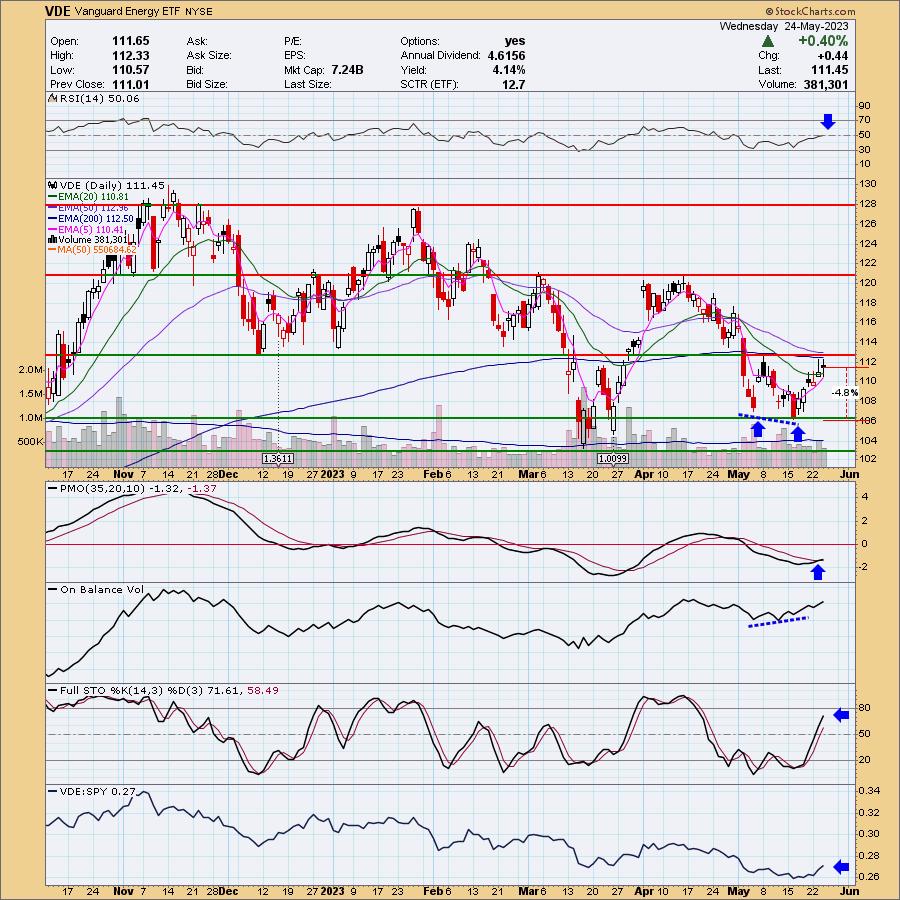
VDE is up +0.49% in after hours trading. All of these Energy charts look similar. We have another bullish double-bottom that hasn't quite been confirmed. The RSI is now positive and there is a new PMO Crossover BUY Signal. Stochastics are rising strongly. VDE is beginning to outperform the SPY. I also spotted a positive OBV divergence. The stop is set at 4.8% or $106.10.
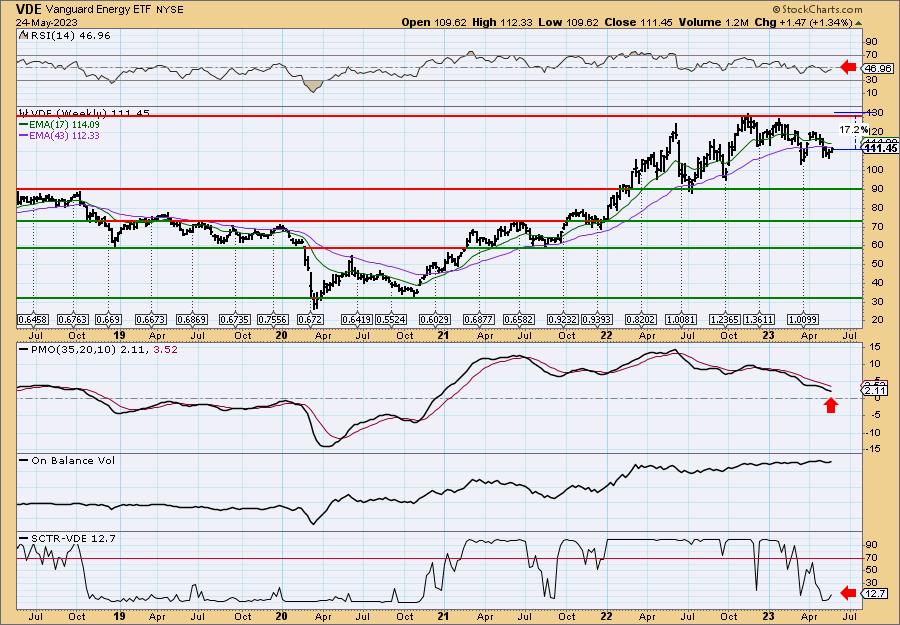
I don't like the weekly chart at all. Price is in an intermediate-term declining trend. The weekly RSI is negative and the weekly PMO is falling. We have another ETF with a SCTR in the basement. On the bright side I see all of these indicators trying to get positive. Still, keep this and all of your investments short-term in nature.
SPDR S&P Oil & Gas Exploration & Production ETF (XOP)
EARNINGS: N/A
XOP tracks an equal-weighted index of companies in the US oil & gas exploration & production space. Click HERE for more information.
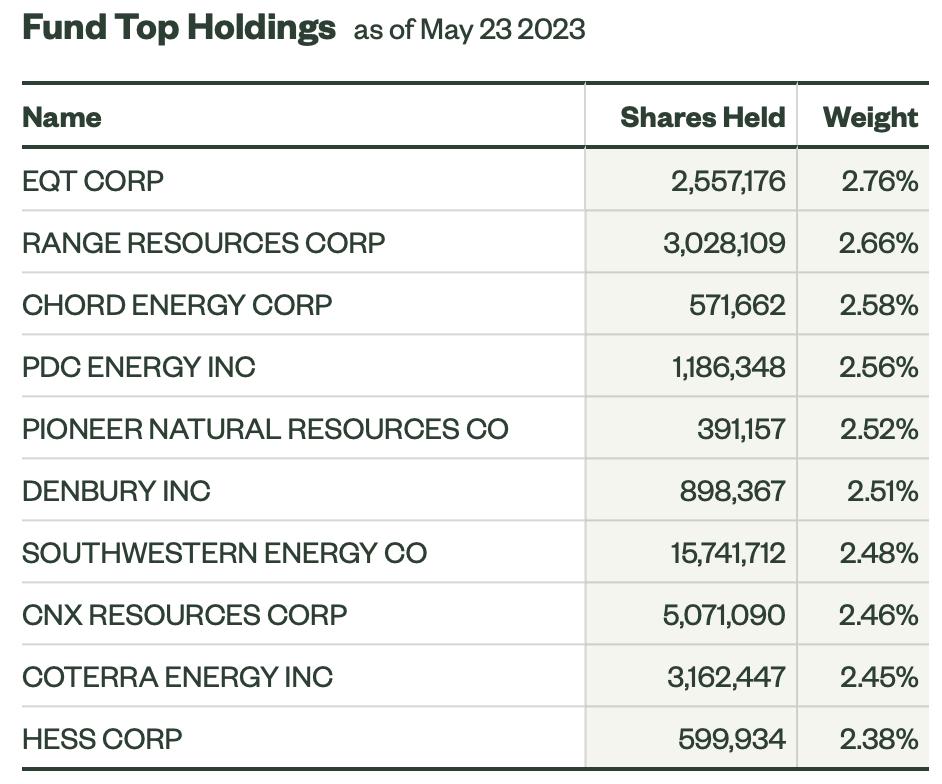
Predefined Scans Triggered: Filled Black Candles and P&F Double Top Breakout.
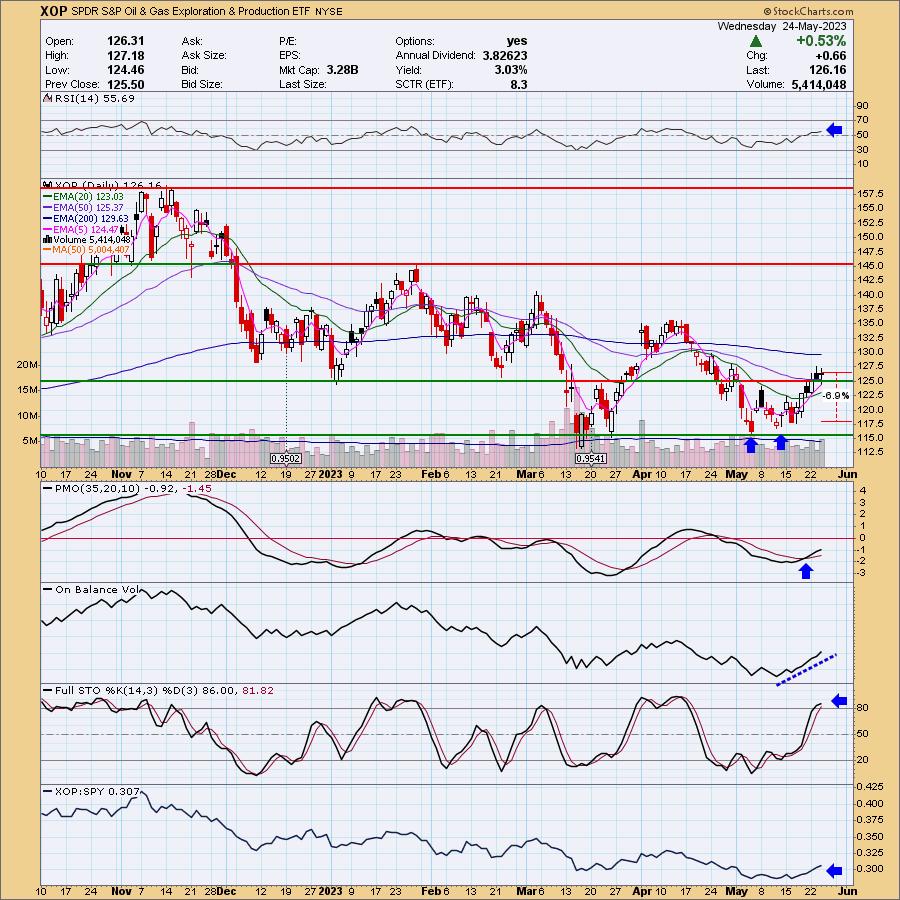
XOP is up +0.14% in after hours trading. We have another bullish double-bottom pattern, only this one has been confirmed with the breakout above resistance. The minimum upside target would take price to overhead resistance at the April high. The RSI is positive and there is a PMO Crossover BUY Signal. The volume is definitely coming in right now. Stochastics are above 80 and relative performance is rising. The stop is set at 6.9% near the second bottom around $117.45.
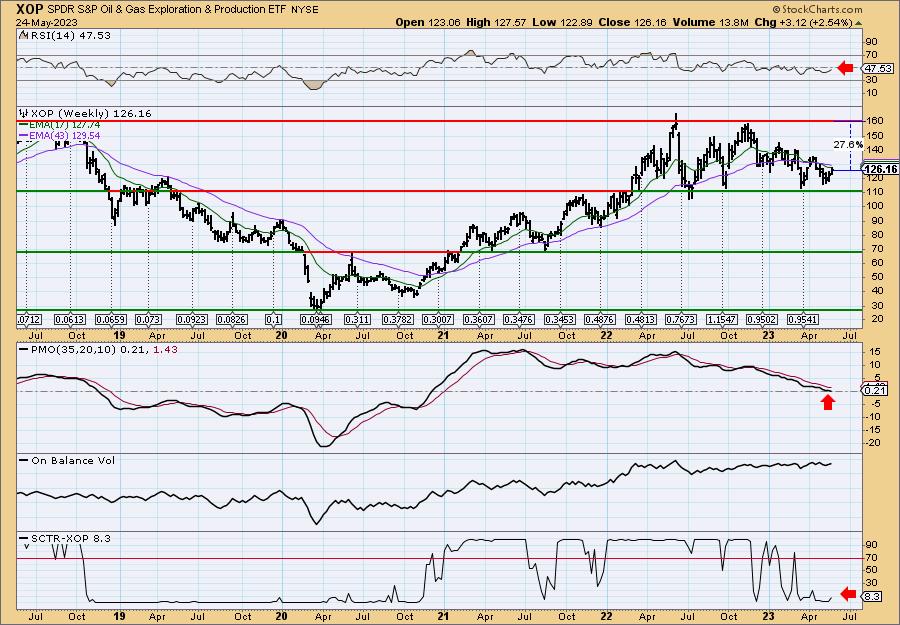
I don't care for this weekly chart either. I see what looks like a giant round top and an intact declining trend. It is bouncing off support and there could be a longer-term bullish double-bottom forming. So the chart is not without merit. Keep this one short-term. Upside potential is over 27%.
Don't forget, on Thursdays I look at reader-requested symbols, click HERE to send me an email. I read every email I receive and try to answer them all!
Current Market Outlook:
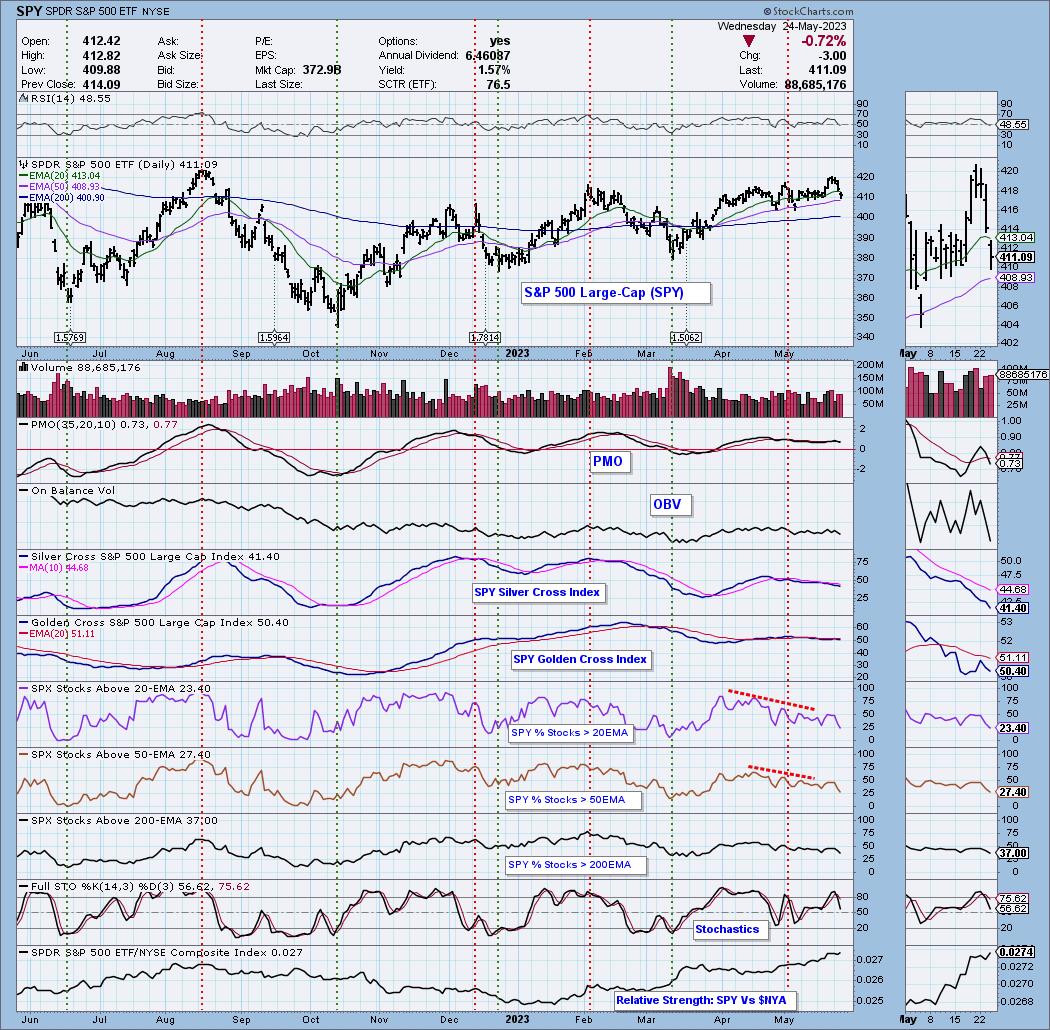
Market Environment: It is important to consider the odds for success by assessing the market tides. The following chart uses different methodologies for objectively showing the depth and trend of participation for intermediate- and long-term time frames.
- The Silver Cross Index (SCI) shows the percentage of SPX stocks on IT Trend Model BUY signals (20-EMA > 50-EMA)
- The Golden Cross Index (GCI) shows the percentage of SPX stocks on LT Trend Model BUY signals (50-EMA > 200-EMA)
Don't forget that as a "Diamonds" member, you have access to our GCI/SCI curated ChartList on DecisionPoint.com. You'll find it under "Members Only" links on the left side on the Blogs and Links Page.
Here is the current chart:
Full Disclosure: I am 14% long, 7% short.
I'm required to disclose if I currently own a stock I mention and/or may buy/short it within the next 72 hours.
"Technical Analysis is a windsock, not a crystal ball." - Carl Swenlin
(c) Copyright 2023 DecisionPoint.com
Watch the latest episode of DecisionPoint Trading Room with Carl & Erin Swenlin on Mondays 7:00p EST or on the DecisionPoint playlist on the StockCharts TV YouTube channel here!
NOTE: The stocks reported herein are from mechanical trading model scans that are based upon moving average relationships, momentum and volume. DecisionPoint analysis is then applied to get five selections from the scans. The selections given should prompt readers to do a chart review using their own analysis process. This letter is not a call for a specific action to buy, sell or short any of the stocks provided. There are NO sure things or guaranteed returns on the daily selection of "Diamonds in the Rough."
Regarding BUY/SELL Signals: The signal status reported herein is based upon mechanical trading model signals and crossovers. They define the implied bias of the price index/stock based upon moving average relationships and momentum, but they do not necessarily call for a specific action. They are information flags that should prompt chart review. Further, they do not call for continuous buying or selling during the life of the signal. For example, a BUY signal will probably (but not necessarily) return the best results if action is taken soon after the signal is generated. Additional opportunities for buying may be found as price zigzags higher, but the trader must look for optimum entry points. Conversely, exit points to preserve gains (or minimize losses) may be evident before the model mechanically closes the signal.
Helpful DecisionPoint Links:
DecisionPoint Shared ChartList and DecisionPoint Chart Gallery
Price Momentum Oscillator (PMO)
Swenlin Trading Oscillators (STO-B and STO-V)
For more links, go to DecisionPoint.com