
As I expected, I received a good amount of requests today to fill up the report. I appreciate the time you take to send the requests in.
It was brought to my attention that the June 2nd Diamond Mine recording link was broken. I have since fixed it so you can go in a download the video or watch it for another 2 weeks in the cloud.
One of the requests today is from the General Mining industry group. I'm not a huge fan of this area, but the chart did look interesting so I included it.
I have two requests that come in from a subscriber with plenty of risk appetite. Upside potential on these stocks is outstanding, but the picks will come with some downside risk due to volatility.
The final request comes from a reader who asked to see AT&T (T) or Verizon (VZ). VZ actually came up in one of my scans today, but looking at the two side by side, I decided that T looked more bullish.
Good Luck & Good Trading,
Erin
Today's "Diamonds in the Rough": LGO, T, TGTX and WOLF.
Other requests: SLCA, PLSE, BTG, BUD, VZ, AAPL, THC and USPH.
** JULY VACATION **
I will be in Europe 7/14 - 7/27 so there will not be any Diamonds reports or trading rooms during that time. All subscribers with active subscriptions on 7/27 will be compensated with two weeks added to their renewal date.

RECORDING LINK (6/2/2023):
Topic: DecisionPoint Diamond Mine (6/2/2023) LIVE Trading Room
Recording LINK
Passcode: June#2nd
REGISTRATION for 6/9/2023:
When: Jun 9, 2023 09:00 AM Pacific Time (US and Canada)
Topic: DecisionPoint Diamond Mine (6/9/2023) LIVE Trading Room
Register in advance for this webinar: HERE
After registering, you will receive a confirmation email containing information about joining the webinar.

Here is the last recording (6/5):
Welcome to DecisionPoint Diamonds, wherein I highlight ten "Diamonds in the Rough" per week. These are selected from the results of my DecisionPoint Scans which search for stocks that could benefit from the trend and condition of the market. Remember, these are not recommendations to buy or sell, but are the most interesting of the stocks that surfaced in my scans. My objective is to save you the work of the initial, tedious culling process, but you need to apply your own analysis to see if these stocks pique your interest as well. There are no guaranteed winners here!
"Predefined Scans Triggered" are taken from StockCharts.com using the "Symbol Summary" option instead of a "SharpChart" on the workbench.
Stop levels are all rounded down.
Largo Inc. (LGO)
EARNINGS: N/A
Largo Inc. engages in the exploration and production of vanadium at the Maracas Menchen Mine located in Brazil. The firm mines and sells vanadium pentoxide flake, high purity vanadium pentoxide flake, and high purity vanadium pentoxide powder. It also focuses on the advancement of renewable energy storage solutions through its vanadium redox flow battery technology. The company was founded on April 18, 1988 and is headquartered in Toronto, Canada.
Predefined Scans Triggered: P&F Descending Triple Bottom Breakdown, New CCI Buy Signals and P&F Double Bottom Breakout.
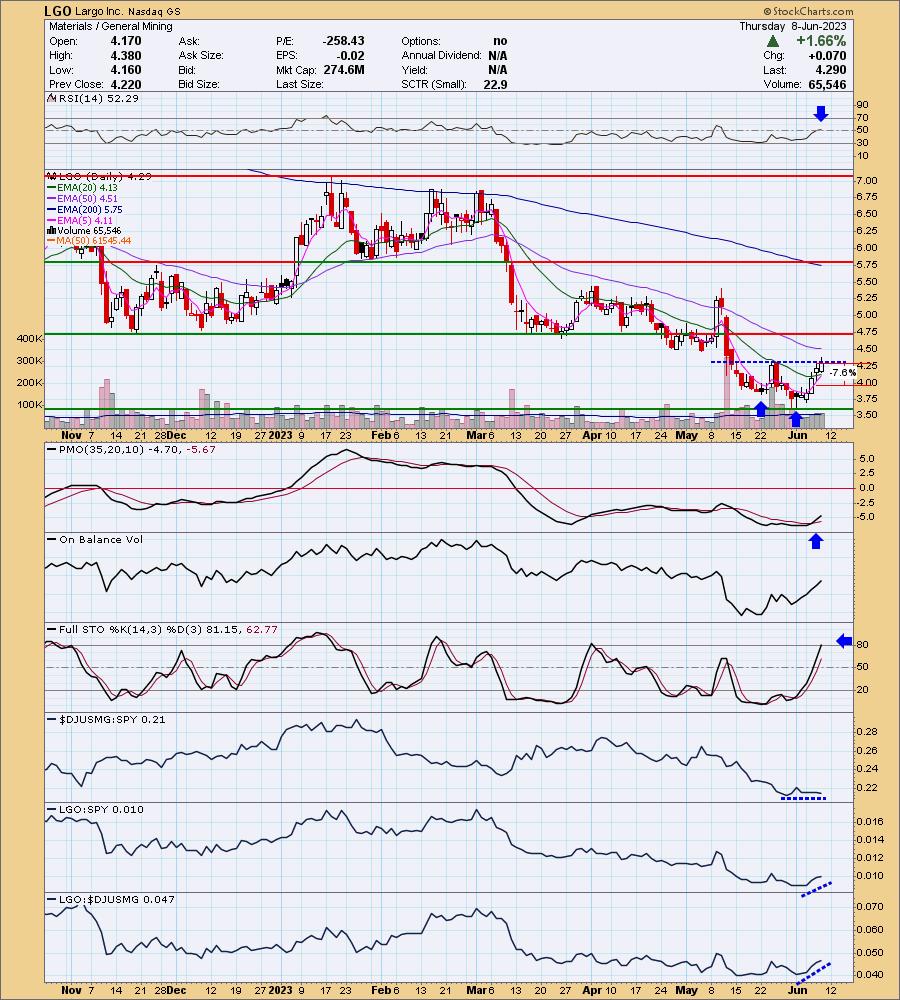
LGO is down -4.43% in after hours trading, so a better buy point is highly likely. If this big decline stand tomorrow, we may be looking at a triple-bottom formation in the future. Be careful with this one based on after hours trading. Other than that, the chart looks very healthy. The RSI has just moved into positive territory, the PMO is rising strongly on a Crossover BUY Signal and Stochastics are above 80 now. The group isn't performing that well relatively speaking, but LGO is starting to see outperformance against the SPY. The stop is set at 7.6% or $3.96 (that percentage would go down should after hours trading stand). This is a low-priced stock so position size wisely.
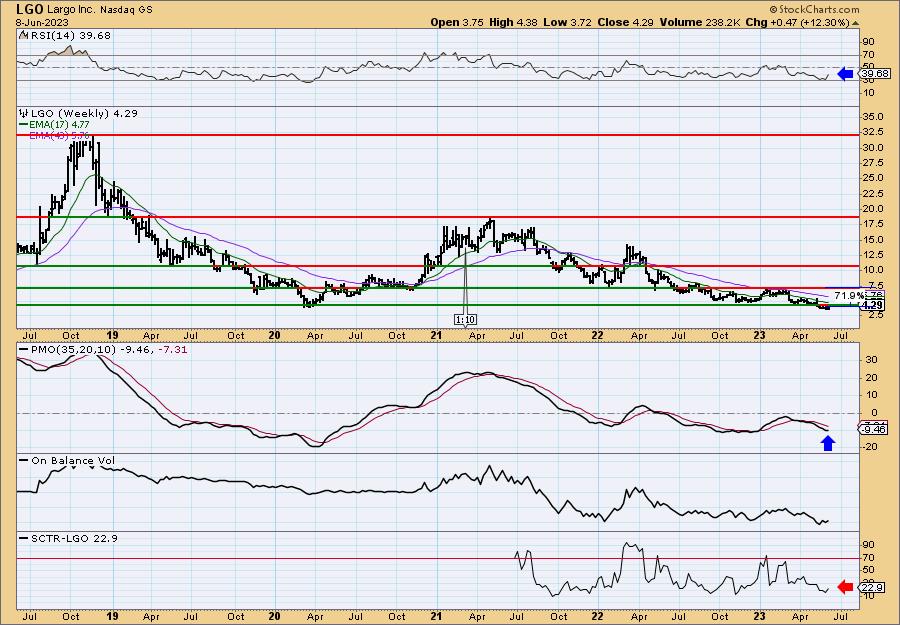
The weekly chart is seeing some improvement but the StockCharts Technical Rank (SCTR) is well outside the "hot zone" above 70*. The weekly RSI is negative but rising. The weekly PMO is turning back up. Upside potential is massive, but with the industry group not performing that well, I would temper expectations significantly.
*If a stock is in the "hot zone" above 70, it implies that it is stronger than 70% of its universe (large-, mid-, small-caps and ETFs) primarily in the intermediate to long terms.
AT&T, Inc. (T)
EARNINGS: 07/20/2023 (BMO)
AT&T, Inc. is a holding company, which engages in the provision of telecommunications media and technology service. It operates through the Communications and Latin America segments. The Communications segment offers services to businesses and consumers located in the U.S., or in U.S. territories, and businesses globally. The Latin America segment is involved in entertainment and wireless services outside of the U.S. The company was founded in 1983 and is headquartered in Dallas, TX.
Predefined Scans Triggered: Hollow Red Candles and P&F Double Bottom Breakout.
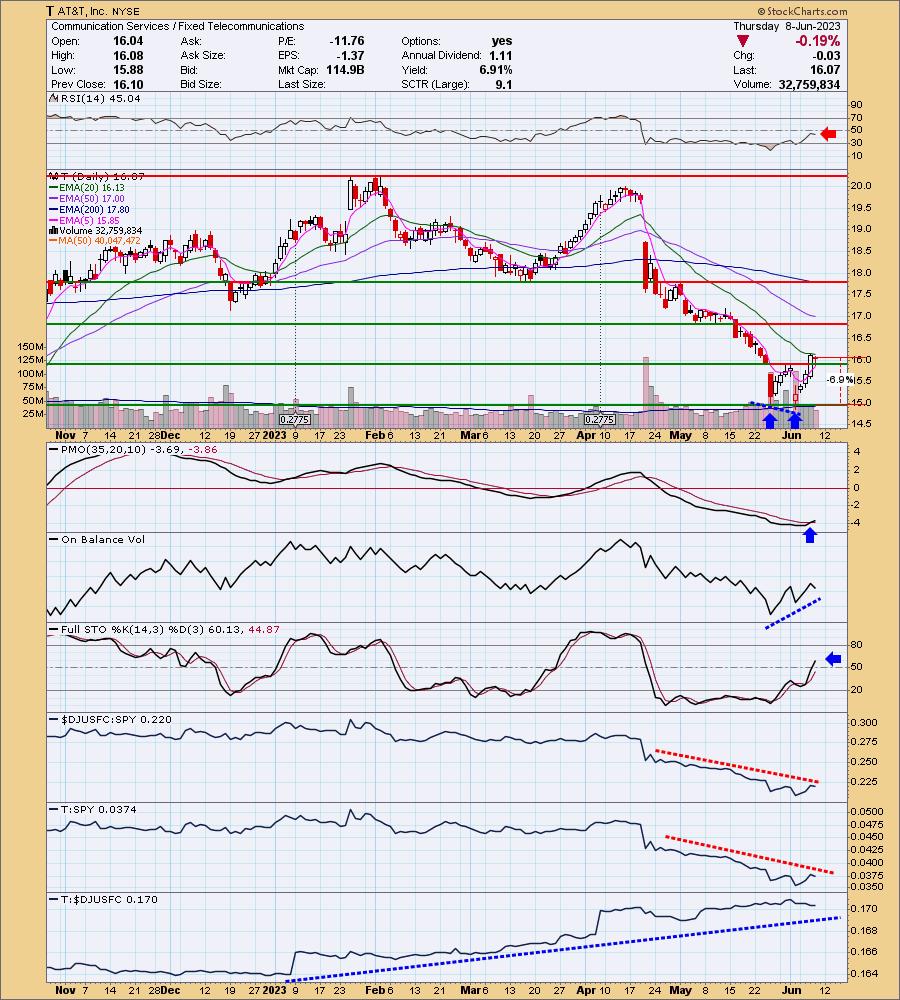
T is up +0.31% in after hours trading. The chart has potential, but it also has problems. The biggest problem is the RSI topping in negative territory. However, it is very beat down and that explains that. What attracted me was the short-term bullish double-bottom and positive OBV divergence. The PMO is also on a new Crossover BUY Signal. Stochastics are rising in positive territory. The industry group is suffering and so has T against the SPY, but if this group gets going, T is where you want to be as it is a dependably outperforms its industry group in most cases. This is a reversal play. The stop can be set below the chart pattern at 6.9% or $14.96.
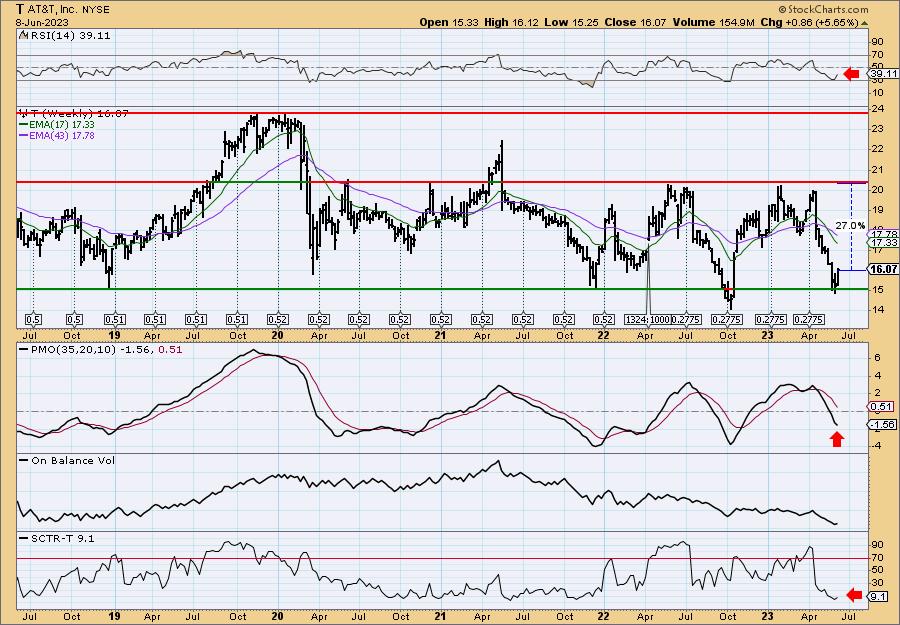
The weekly chart screams that this should be considered only a short-term investment. The weekly RSI is negative, although rising. The PMO is decelerating slightly, but is still declining and isn't oversold yet. The SCTR is in the basement. If it gets going after this bounce at the bottom of this trading range, it does have excellent upside potential.
TG Therapeutics, Inc. (TGTX)
EARNINGS: 08/01/2023 (BMO)
TG Therapeutics, Inc. engages in the acquisition, development, and commercialization of novel treatments for B-cell malignancies and autoimmune diseases. Its product pipeline includes TG-1501, TG-1701, Ublituximab, and Umbralisib. The company was founded by Michael Sean Weiss and Laurence H. Shaw on May 18, 1993 and is headquartered in Morrisville, NC.
Predefined Scans Triggered: Elder Bar Turned Green.
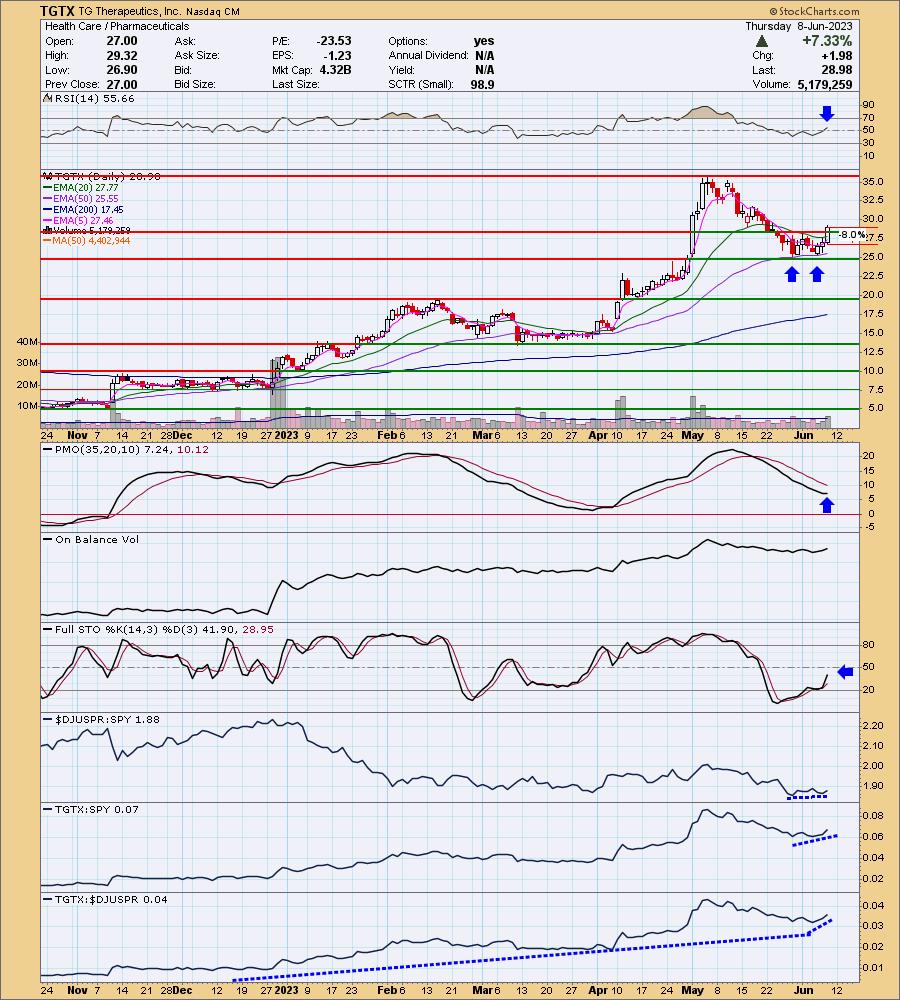
TGTX is up +0.79% in after hours trading. We have a nice double-bottom that has been confirmed with today's breakout rally. The RSI is rising above net neutral (50). The PMO has turned back up and Stochastics are rising strongly albeit in negative territory. The group is slowly starting to outperform. TGTX tends to outperform the group so currently it is outperforming the market. It was a big gain today so unfortunately the stop has to be set on the high side at 8% or $26.66.
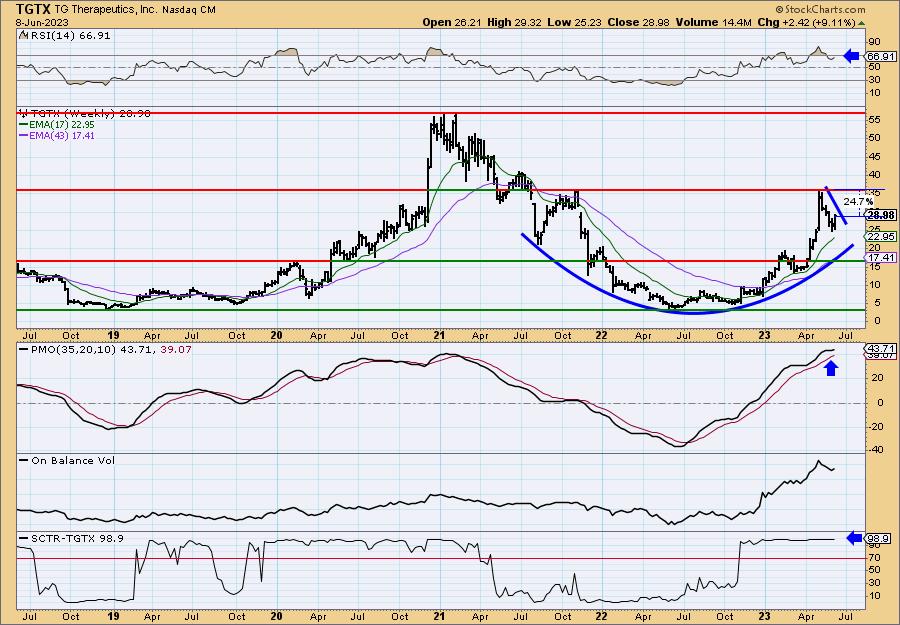
We have a nice big basing pattern and what can be described as a cup with handle bullish chart pattern. The weekly RSI is positive and rising. The weekly PMO is surging above its signal line and the SCTR is at the very top of the hot zone above 70. I believe there is more upside potential, but even if it gets stopped at around $35 it would still be an over 24% gain.
Wolfspeed, Inc. (WOLF)
EARNINGS: 08/16/2023 (AMC)
Wolfspeed, Inc. is an innovator of Wolfspeed power and radio frequency (RF) semiconductors. Its Wolfspeed product families include silicon carbide materials, power-switching devices and RF devices targeted for applications such as electric vehicles, fast charging inverters, power supplies, telecom and military and aerospace. The company was founded by Calvin H. Carter Jr., John W. Palmour, F. Neal Hunter, Eric Hunter, and John Edmond in 1987 and is headquartered in Durham, NC.
Predefined Scans Triggered: None.
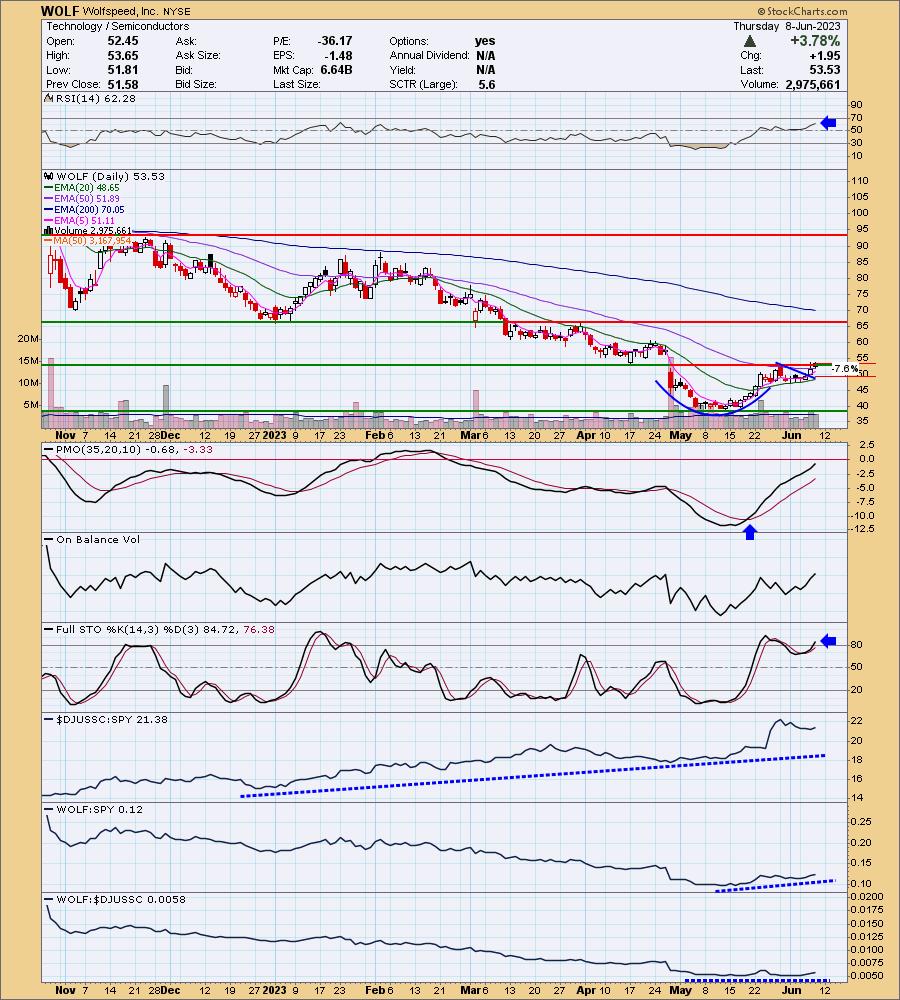
WOLF is up +0.60% in after hours trading. We have a bullish cup with handle pattern and the pattern is executing on the recent breakout. We do need to see it break above overhead resistance still, but it looks very promising. The RSI is positive and not overbought. The PMO is rising strongly on a Crossover BUY signal, it should also get above the zero line soon. The industry group near-term hasn't performed that well, but overall it has been strong for the Semiconductors. WOLF tends to perform in line with the group so as long as the group performs, it should too. Stochastics are also above 80 and rising. The stop is set at the breakout point from the handle at 7.6% or $49.46.
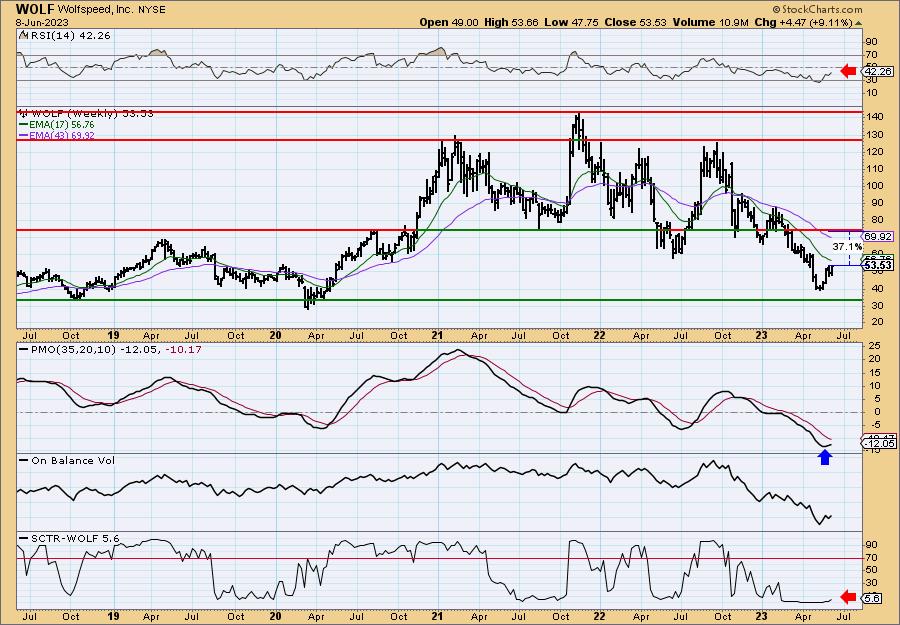
The weekly chart is moving positive, but I'd like to see the SCTR start to move upward since it is in the basement. The weekly PMO is turning back up. The weekly RSI is rising, but still beneath net neutral (50). Consider this mostly short-term unless the weekly RSI gets positive and we see some positive movement on the SCTR.
Don't forget, on Thursdays I look at reader-requested symbols, click HERE to send me an email. I read every email I receive and try to answer them all!
Current Market Outlook:
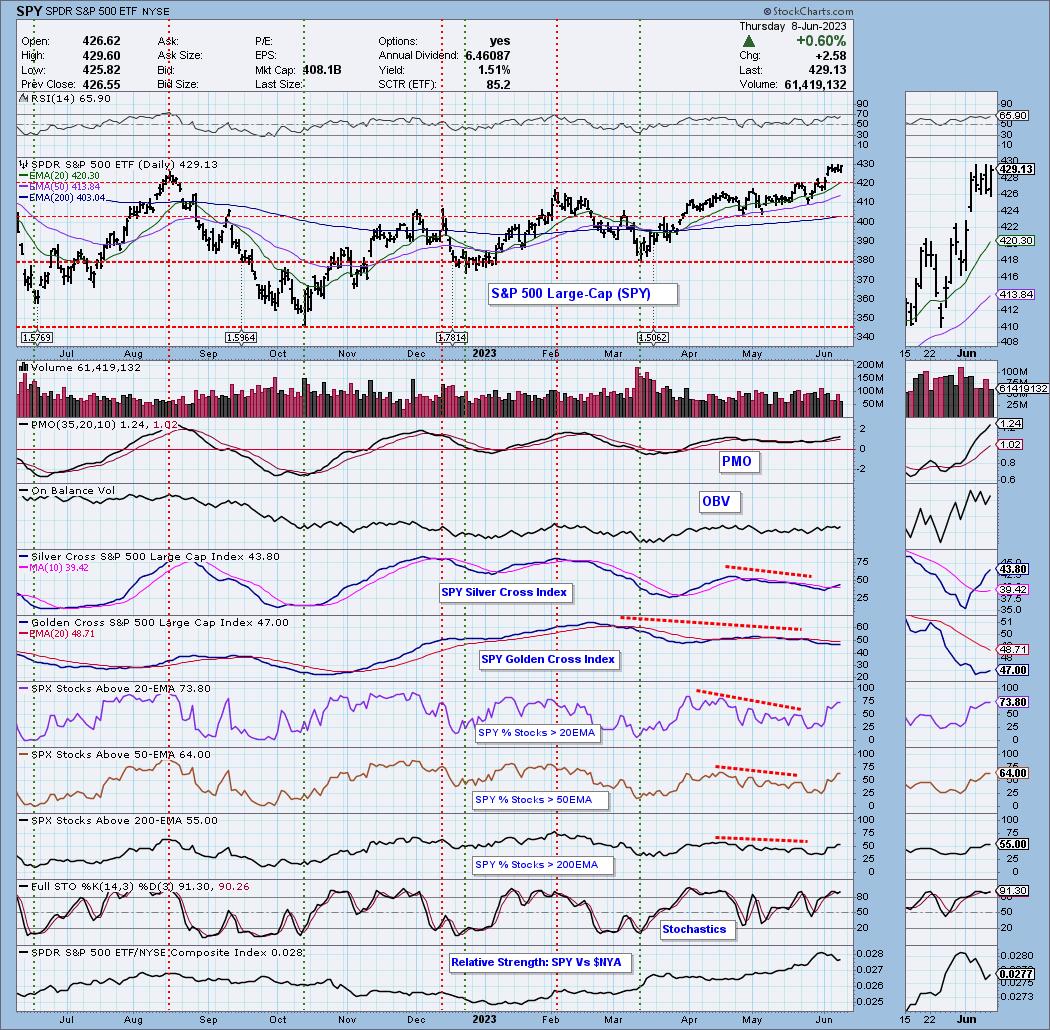
Market Environment: It is important to consider the odds for success by assessing the market tides. The following chart uses different methodologies for objectively showing the depth and trend of participation for intermediate- and long-term time frames.
- The Silver Cross Index (SCI) shows the percentage of SPX stocks on IT Trend Model BUY signals (20-EMA > 50-EMA)
- The Golden Cross Index (GCI) shows the percentage of SPX stocks on LT Trend Model BUY signals (50-EMA > 200-EMA)
Don't forget that as a "Diamonds" member, you have access to our GCI/SCI curated ChartList on DecisionPoint.com. You'll find it under "Members Only" links on the left side on the Blogs and Links Page.
Here is the current chart:
Full Disclosure: I am 30% long, 0% short.
I'm required to disclose if I currently own a stock I mention and/or may buy/short it within the next 72 hours.
"Technical Analysis is a windsock, not a crystal ball." - Carl Swenlin
(c) Copyright 2023 DecisionPoint.com
Watch the latest episode of DecisionPoint Trading Room with Carl & Erin Swenlin on Mondays 7:00p EST or on the DecisionPoint playlist on the StockCharts TV YouTube channel here!
NOTE: The stocks reported herein are from mechanical trading model scans that are based upon moving average relationships, momentum and volume. DecisionPoint analysis is then applied to get five selections from the scans. The selections given should prompt readers to do a chart review using their own analysis process. This letter is not a call for a specific action to buy, sell or short any of the stocks provided. There are NO sure things or guaranteed returns on the daily selection of "Diamonds in the Rough."
Regarding BUY/SELL Signals: The signal status reported herein is based upon mechanical trading model signals and crossovers. They define the implied bias of the price index/stock based upon moving average relationships and momentum, but they do not necessarily call for a specific action. They are information flags that should prompt chart review. Further, they do not call for continuous buying or selling during the life of the signal. For example, a BUY signal will probably (but not necessarily) return the best results if action is taken soon after the signal is generated. Additional opportunities for buying may be found as price zigzags higher, but the trader must look for optimum entry points. Conversely, exit points to preserve gains (or minimize losses) may be evident before the model mechanically closes the signal.
Helpful DecisionPoint Links:
Price Momentum Oscillator (PMO)
Swenlin Trading Oscillators (STO-B and STO-V)
For more links, go to DecisionPoint.com