
Thank you for your patience on the delay of ETF Day. It is crazy what can happen in one day. Two of the ETFs lost Crossover BUY Signals today after 'surging' yesterday. I still think they have merit given bullish characteristics remain.
Reader requests were fairly light, but I did find three with excellent potential and one that should hold a rising trend.
The market is likely beginning another short pullback so you could look for slightly better entries in the days ahead.
I was traveling again today so I'm just going to get into the six symbols. Enjoy!
Erin will be on Making Money with Charles Payne next week, we'll see. The schedule there is very fluid. I'll send the date when I have it. It's on Fox Business at 11a PT/2p ET.
Good Luck & Good Trading,
Erin
Today's "Diamonds in the Rough": MSFT, OLLI, PAYC, TUR, VNQI, VOX and WW.
Other requests: TFC, STLA, TSLA, ARCT, PG, PRI, SBUX, F.
** JULY VACATION **
I will be in Europe 7/14 - 7/28 so there will not be any Diamonds reports or trading rooms during that time. All subscribers with active subscriptions on 7/28 will be compensated with two weeks added to their renewal date.

RECORDING LINK (6/30/2023):
Topic: DecisionPoint Diamond Mine (6/30/2023) LIVE Trading Room
Passcode: June#30th
REGISTRATION for 7/7/2023:
When: Jul 7, 2023 09:00 AM Pacific Time (US and Canada)
Topic: DecisionPoint Diamond Mine (7/7/2023) LIVE Trading Room
Register in advance for this webinar HERE.
After registering, you will receive a confirmation email containing information about joining the webinar.

Here is the last recording from 6/23, no recording on 7/3:
Welcome to DecisionPoint Diamonds, wherein I highlight ten "Diamonds in the Rough" per week. These are selected from the results of my DecisionPoint Scans which search for stocks that could benefit from the trend and condition of the market. Remember, these are not recommendations to buy or sell, but are the most interesting of the stocks that surfaced in my scans. My objective is to save you the work of the initial, tedious culling process, but you need to apply your own analysis to see if these stocks pique your interest as well. There are no guaranteed winners here!
"Predefined Scans Triggered" are taken from StockCharts.com using the "Symbol Summary" option instead of a "SharpChart" on the workbench.
Stop levels are all rounded down.
Microsoft Corp. (MSFT)
EARNINGS: 07/25/2023 (AMC)
Microsoft Corp. engages in the development and support of software, services, devices, and solutions. It operates through the following business segments: Productivity and Business Processes, Intelligent Cloud, and More Personal Computing. The Productivity and Business Processes segment consists of Office Commercial (Office 365 subscriptions, the Office 365 portion of Microsoft 365 Commercial subscriptions, and Office licensed on-premises), Exchange, SharePoint, Microsoft Teams, Office 365 Security and Compliance, and Skype for Business, Office Consumer, including Microsoft 365 Consumer subscriptions, Office licensed on-premises, and other Office services, LinkedIn, including Talent Solutions, Marketing Solutions, Premium Subscriptions, Sales Solutions, and Learning Solutions, Dynamics business solutions, including Dynamics 365, comprising a set of intelligent, cloud-based applications across ERP, CRM, Customer Insights, Power Apps, and Power Automate, and on-premises ERP and CRM applications. The Intelligent Cloud segment consists of Server products and cloud services, including Azure and other cloud services, SQL Server, Windows Server, Visual Studio, System Center, and related Client Access Licenses (CALs), and Nuance and GitHub, Enterprise Services, including Enterprise Support Services, Microsoft Consulting Services, and Nuance professional services. The More Personal Computing segment consists of Windows, including Windows OEM licensing and other non-volume licensing of the Windows operating system, Windows Commercial, comprising volume licensing of the Windows operating system, Windows cloud services, and other Windows commercial offerings, patent licensing, and Windows Internet of Things, Devices, including Surface and PC accessories, Gaming, including Xbox hardware and Xbox content and services, comprising digital transactions, Xbox Game Pass and other subscriptions, video games, third-party video game royalties, cloud services, and advertising, Search and news advertising. The company was founded by Paul Gardner Allen and William Henry Gates, III in 1975 and is headquartered in Redmond, WA.
Predefined Scans Triggered: P&F High Pole.
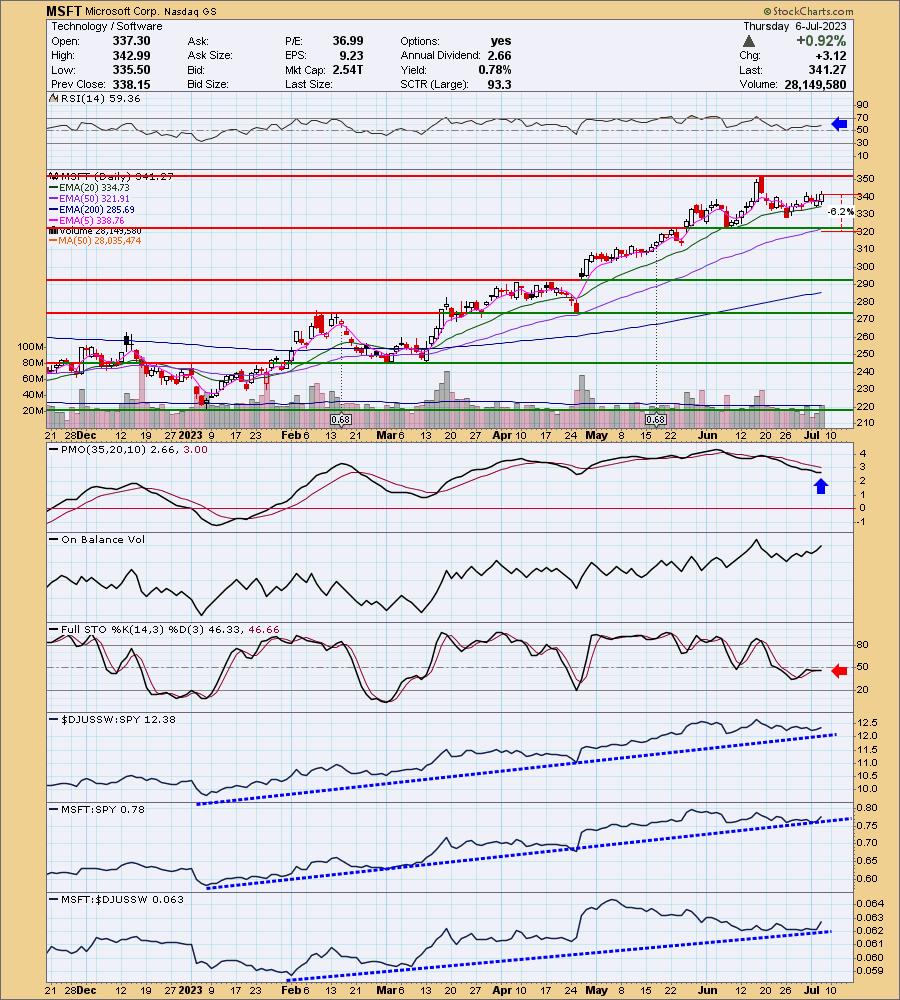
MSFT is up +0.11% in after hours trading. MSFT has shown incredible leadership this year alongside the other mega-cap stocks and it doesn't seem ready to correct yet. The PMO is falling, but it is decelerating that decline. The RSI is positive which is no surprise given the steady rising trend. Stochastics aren't falling, but they are still below net neutral (50). Relative strength is excellent as it is with most mega-cap stocks. I've set the stop at 6.2% or $320.11.
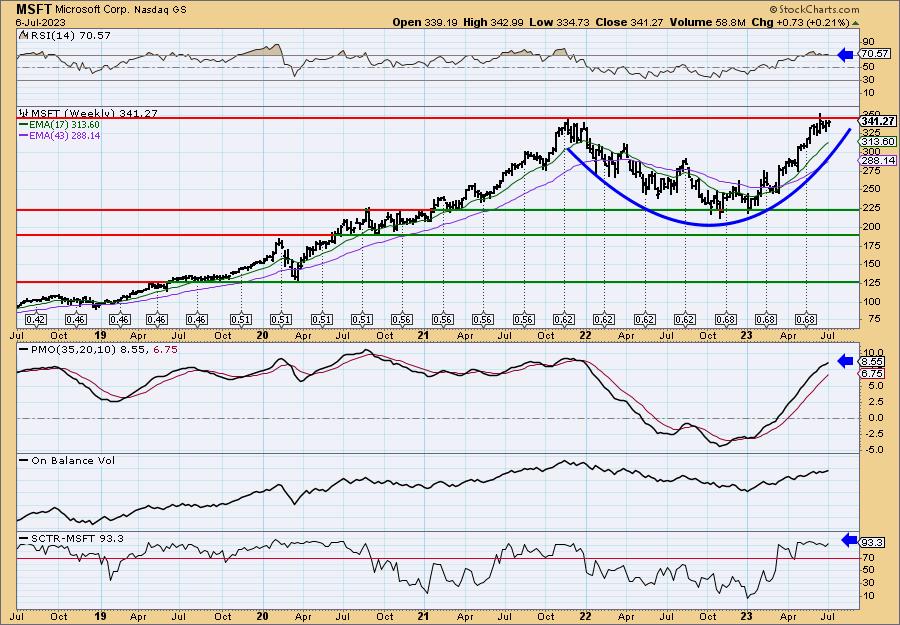
There is a large rounded base that suggests an upside breakout ahead. The weekly RSI is positive and the weekly PMO is rising. The StockCharts Technical Rank (SCTR) is well within the hot zone* above 70. This can be considered an intermediate-term investment.
*If a stock is in the "hot zone" above 70, it implies that it is stronger than 70% of its universe (large-, mid-, small-caps and ETFs) primarily in the intermediate to long terms.
Ollie's Bargain Outlet Holdings Inc. (OLLI)
EARNINGS: 08/31/2023 (BMO)
Ollie's Bargain Outlet Holdings, Inc. is a holding company, which engages in the retail of closeouts, excess inventory, and salvage merchandise. It offers overstocks, package changes, manufacturer refurbished goods, and irregulars. The company's products include housewares, food, books and stationery, bed and bath, floor coverings, electronics and toys. Ollie's Bargain Outlet Holdings was founded by Mark Butler, Mort Bernstein, Oliver Rosenberg and Harry Coverman on July 29, 1982, and is headquartered in Harrisburg, PA.
Predefined Scans Triggered: New CCI Buy Signals and P&F Double Top Breakout.
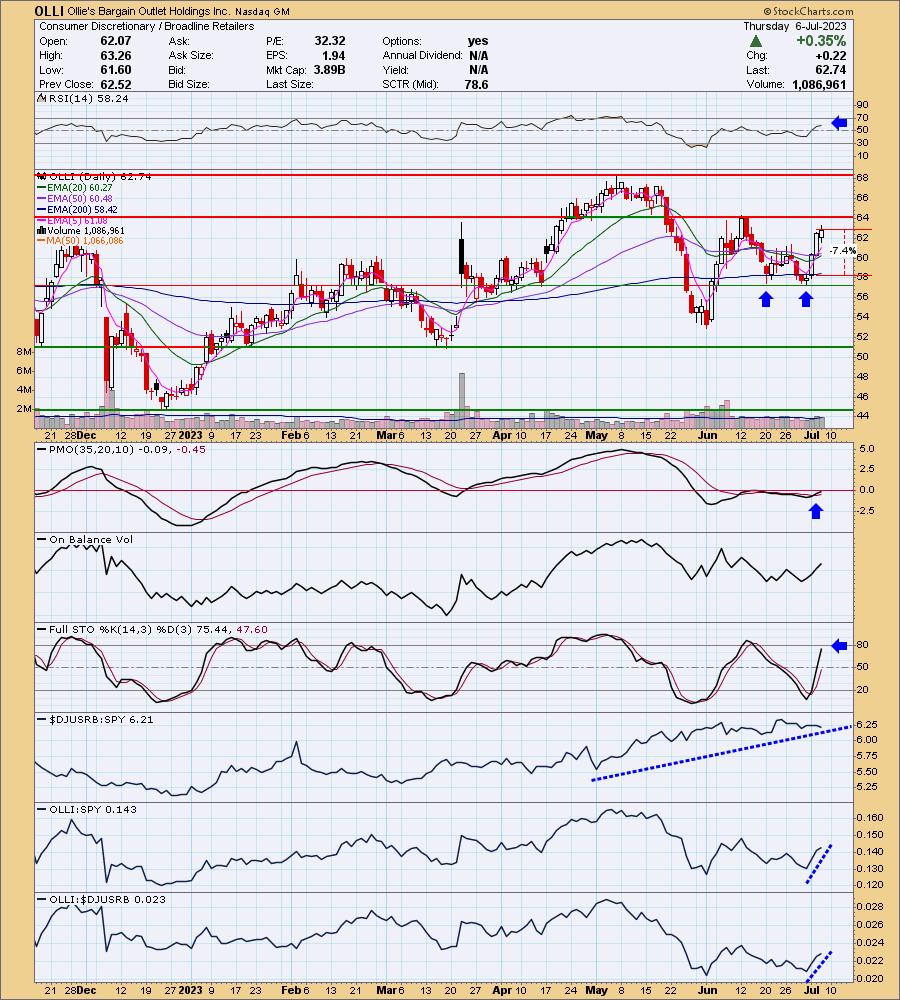
OLLI is down -0.35% in after hours trading. I like the short-term double-bottom pattern that suggests price will test overhead resistance at around $68. The RSI is positive and not at all overbought. The PMO has generated a Crossover BUY Signal and should move into positive territory soon. Stochastics are rising vertically. The group overall has been outperforming in the intermediate term. OLLI is picking up strength in the short term. The stop is set below the 200-day EMA. I'd prefer to set it below the double-bottom pattern as the pattern would bust if it dropped that low. I just didn't want to put a stop in above 8%. I chose 7.4% or $58.09.
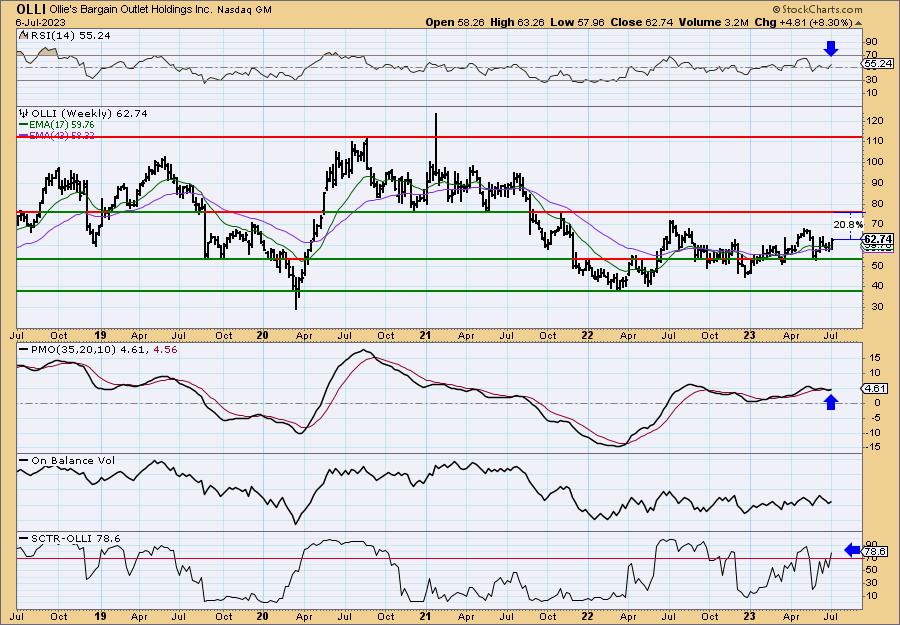
I like how this chart is shaping up. I believe this could be an intermediate-term investment. The weekly RSI is positive and rising/not overbought. The weekly PMO is triggering a Crossover BUY Signal and the SCTR is in the hot zone. Upside potential is very good, set at the late 2021 top.
Paycom Software, Inc. (PAYC)
EARNINGS: 08/01/2023 (AMC)
Paycom Software, Inc. engages in the provision of cloud-based human capital management (HCM) software solutions delivered as Software-as-a-Service. It offers functionality and data analytics that businesses need to manage the complete employment life cycle from recruitment to retirement. Its solutions include talent acquisition, time and labor management, payroll, talent management, and human resource management. The company was founded by Chad R. Richison in 1998 and is headquartered in Oklahoma City, OK.
Predefined Scans Triggered: Elder Bar Turned Green, Parabolic SAR Buy Signals and P&F Low Pole.
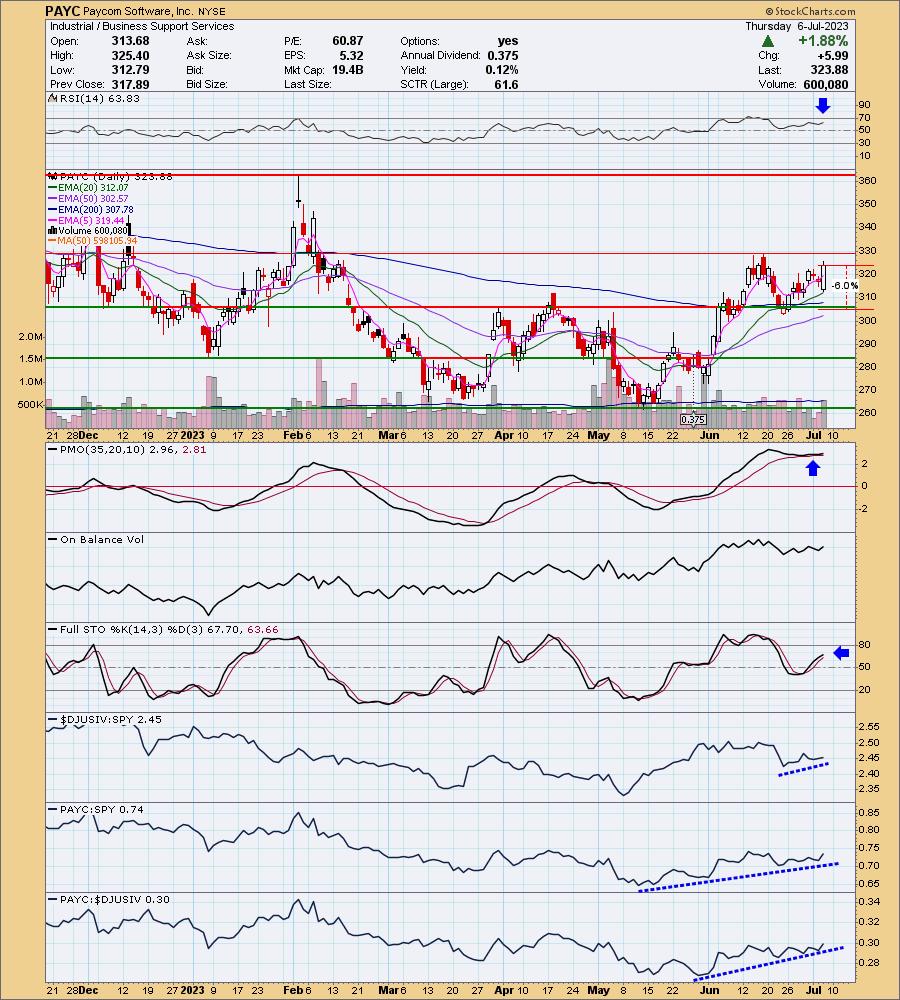
PAYC is up +0.03% in after hours trading. We have a giant bullish engulfing candlestick today. The RSI is positive and the PMO is surging (bottoming) above the signal line. Stochastics are rising in positive territory and relative strength is rising for the group and the stock. The only issue is the possibility that it is setting up a double-top. I don't think it is based on these strong indicators. I expect a breakout. Nonetheless, the stop is set below support at 6% or $304.44.
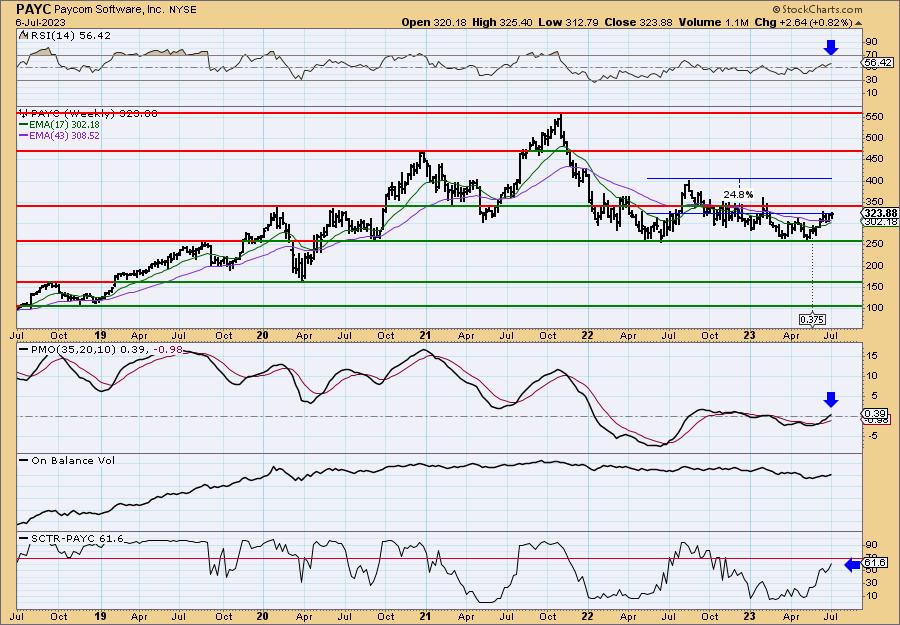
I feel somewhat mixed about the weekly chart primarily due to the trading range. However, indicators are very favorable. The weekly RSI is rising in positive territory and is not overbought. The weekly PMO just entered positive territory on a Crossover BUY Signal. The SCTR isn't quite in the hot zone, but it is showing improvement. I've set upside potential at the 2022 high.
iShares MSCI Turkey ETF (TUR)
EARNINGS: N/A
TUR tracks the performance of a market-cap-weighted index of Turkish stocks. Click HERE for more information.
Predefined Scans Triggered: Filled Black Candles.
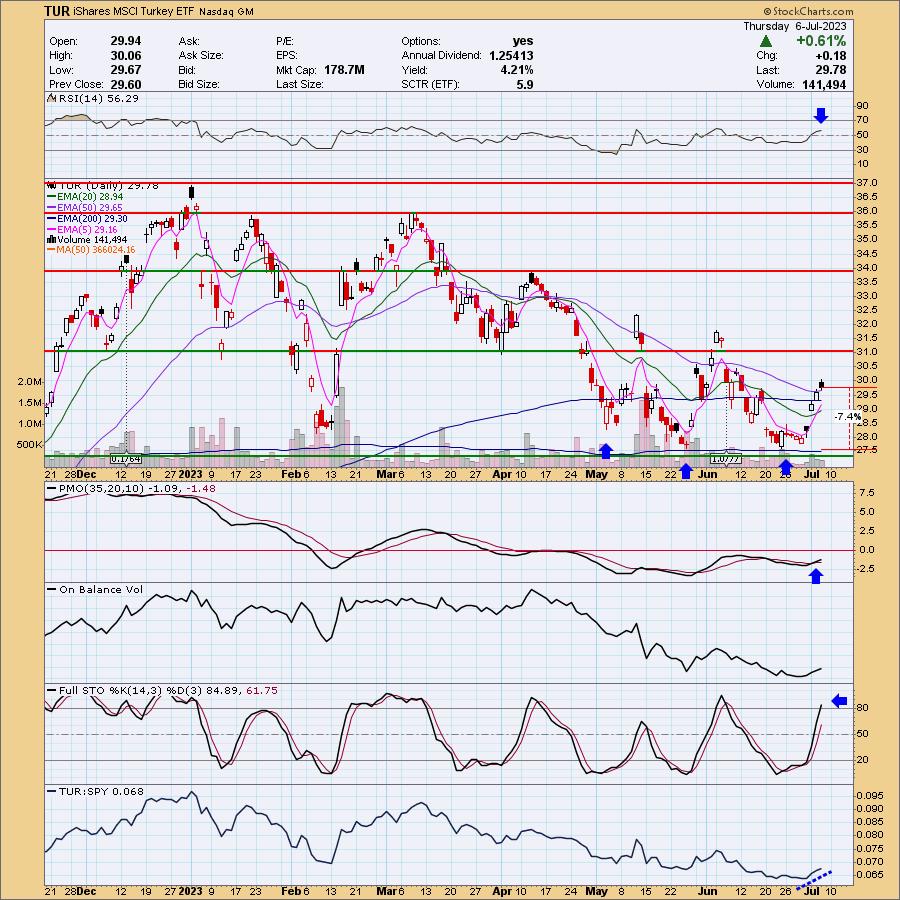
TUR is unchanged in after hours trading. I really like the triple-bottom pattern that is developing. A breakout above the confirmation line at about $32 would imply an upside move to at least the 2023 high. We do have a filled black candlestick today which is bearish so you may get a better entry. The RSI is positive and not overbought. There is a PMO Crossover BUY Signal in oversold territory. Stochastics are now above 80 and rising. Relative strength is just beginning to improve. The stop is set below the pattern at 7.4% or $27.57.
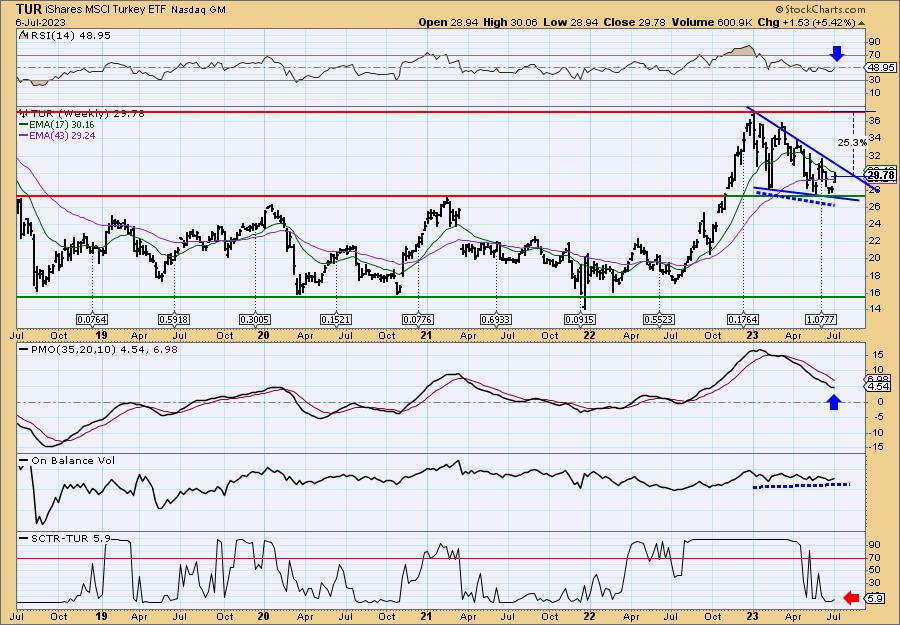
There is a large bullish falling wedge. We don't have a breakout yet, but the indicators are improving. This could be an intermediate-term investment. The weekly RSI is rising and nearly in positive territory. The weekly PMO is decelerating. The SCTR definitely needs help. I do see a positive OBV divergence. Upside potential is excellent.
Vanguard Global ex-U.S. Real Estate ETF (VNQI)
EARNINGS: N/A
The Fund seeks to track the performance of a benchmark index that measures the investment return of international real estate stocks.
Predefined Scans Triggered: Moved Below Ichimoku Cloud and Elder Bar Turned Red.
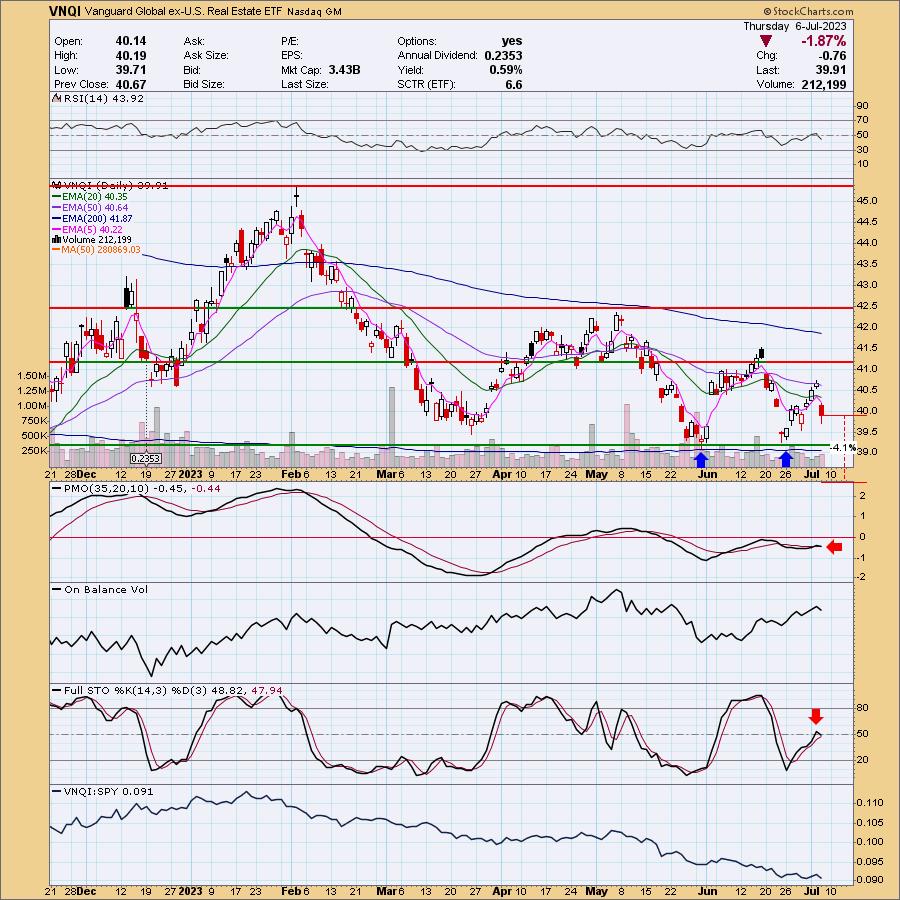
VNQI is down -2.28% in after hours trading. I picked this yesterday, but would not have picked it today so consider this watchlist material for now, it appears another test of support is coming. If it drops below the double-bottom, it can probably be scrapped. A move like that would bust the bullish double-bottom pattern. The RSI was positive yesterday but today's decline took it out. The PMO had surged above the signal line, but instead has failed and moved into a SELL signal. This one got stinky pretty quick. I hate putting it on the spreadsheet, but oh well. The stop is very thin at 4.1% or $38.27.
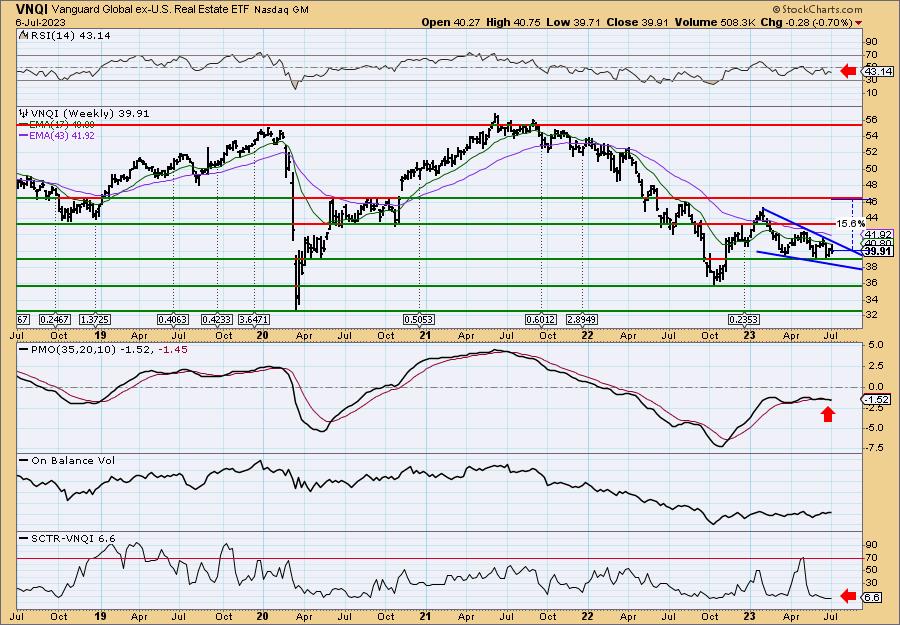
The weekly chart looks slightly better given the bullish falling wedge, but that's about it. The weekly RSI is negative and the weekly PMO is triggering a Crossover SELL Signal. The SCTR is in the basement. This one has work to do.
Vanguard Communication Services ETF (VOX)
EARNINGS: N/A
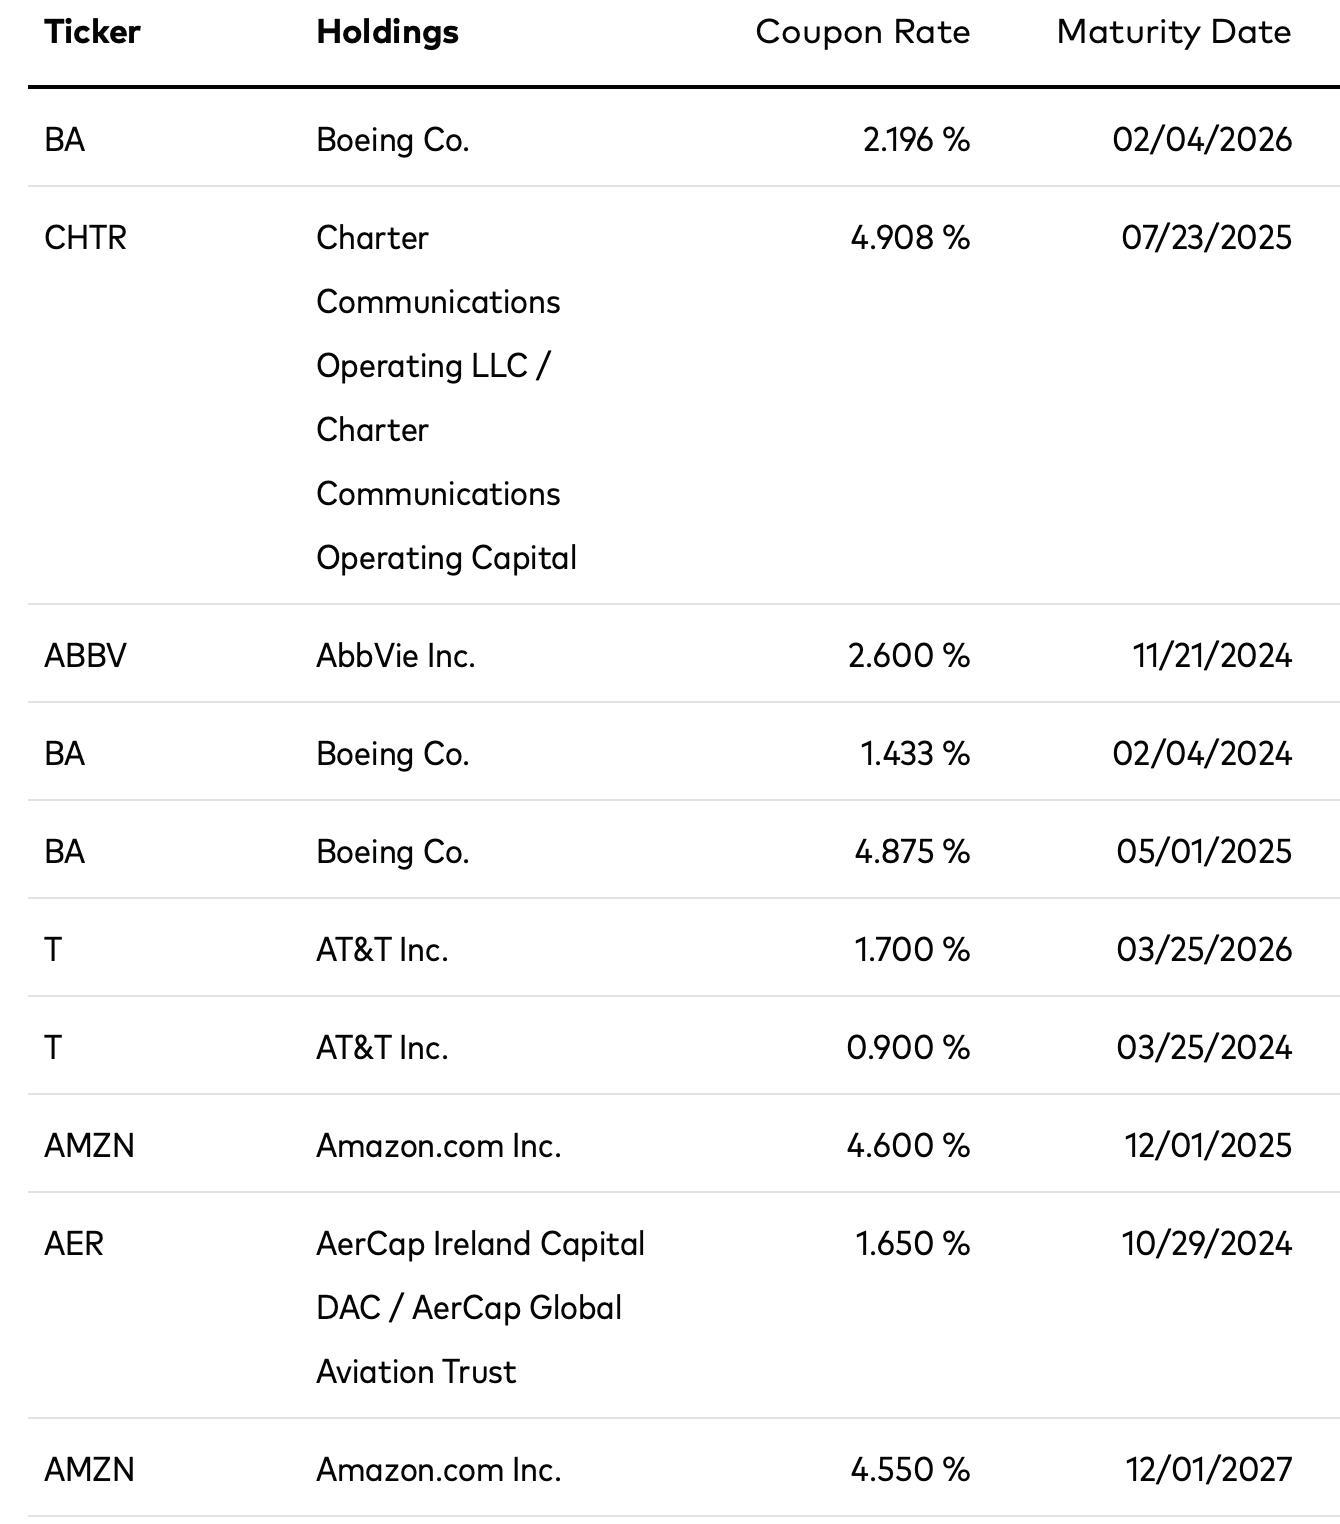
This fund is designed to give investors exposure to high- and medium-quality, investment-grade bonds with short-term maturities. The fund invests in corporate bonds, pooled consumer loans, and U.S. government bonds. Although short-term bond funds tended to have a higher yield than money market funds, the tradeoff has been that the share price fluctuates. Additionally, increases in interest rates can cause the prices of the bonds in the portfolio, and thus the fund's share price, to decrease. Investors with a short-term savings goal who are willing to accept some price movement may wish to consider this fund.
Predefined Scans Triggered: Elder Bar Turned Blue, P&F Double Top Breakout and P&F Triple Top Breakout.
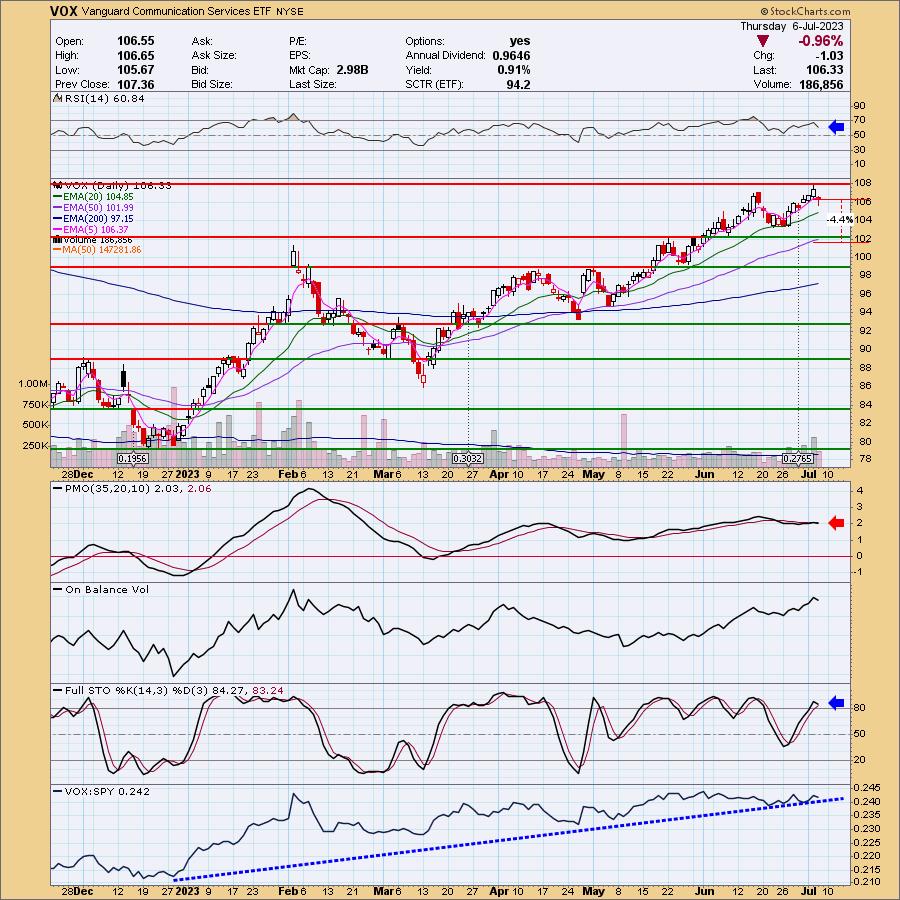
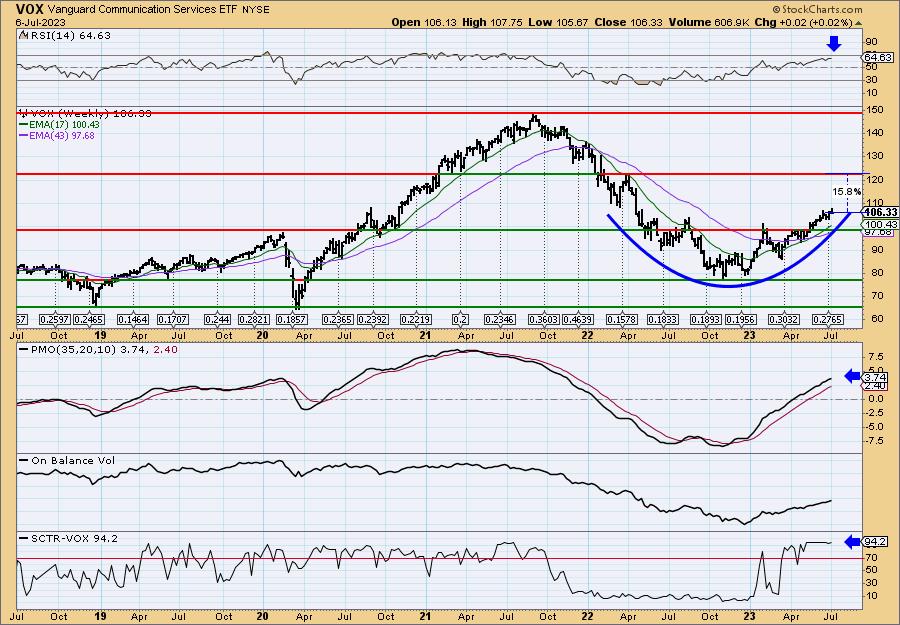
VOX is down -0.45% in after hours trading. I found that this one was a "Diamond in the Rough" on January 4th so the position is still technically open. It does appear that price is readying for a small pullback so a better entry is likely ahead. I'm unhappy with what today's decline did to the PMO. We have a new PMO SELL Signal. I'm concerned this may turn into a small double-top pattern. At least the RSI is positive and Stochastics are above 80. Relative strength doesn't look too bad either. The stop is nice and thin at 4.4% or $101.65.
I see a beautiful basing pattern on the weekly chart and the indicators look fantastic. It may be touch and go in the short term, but it looks very good in the intermediate term. The weekly RSI is positive and the weekly PMO is rising strongly on a Crossover BUY Signal. It is not yet overbought. The SCTR is at the top of the hot zone. I've conservatively listed upside potential at 15.8%, but I don't believe it out of the question that it could move to test all-time highs. It just may take awhile.
Weight Watchers Intl Inc. (WW)
EARNINGS: 08/03/2023 (AMC)
WW International, Inc. engages in the provision of weight management services. It operates through the following geographical segments: North America, United Kingdom, Continental Europe and Other. The North America segment consists of United States and Canada company-owned operations. The United Kingdom segment includes United Kingdom company-owned operations. The Continental Europe segment consists of Germany, Switzerland, France, Spain, Belgium, Netherlands, and Sweden company-owned operations. The others segment offers Australia, New Zealand company-owned operations, as well as revenues and costs from franchises in the United States. The company was founded by Jean Nidetch in 1963 and is headquartered in New York, NY.
Predefined Scans Triggered: Hollow Red Candles.
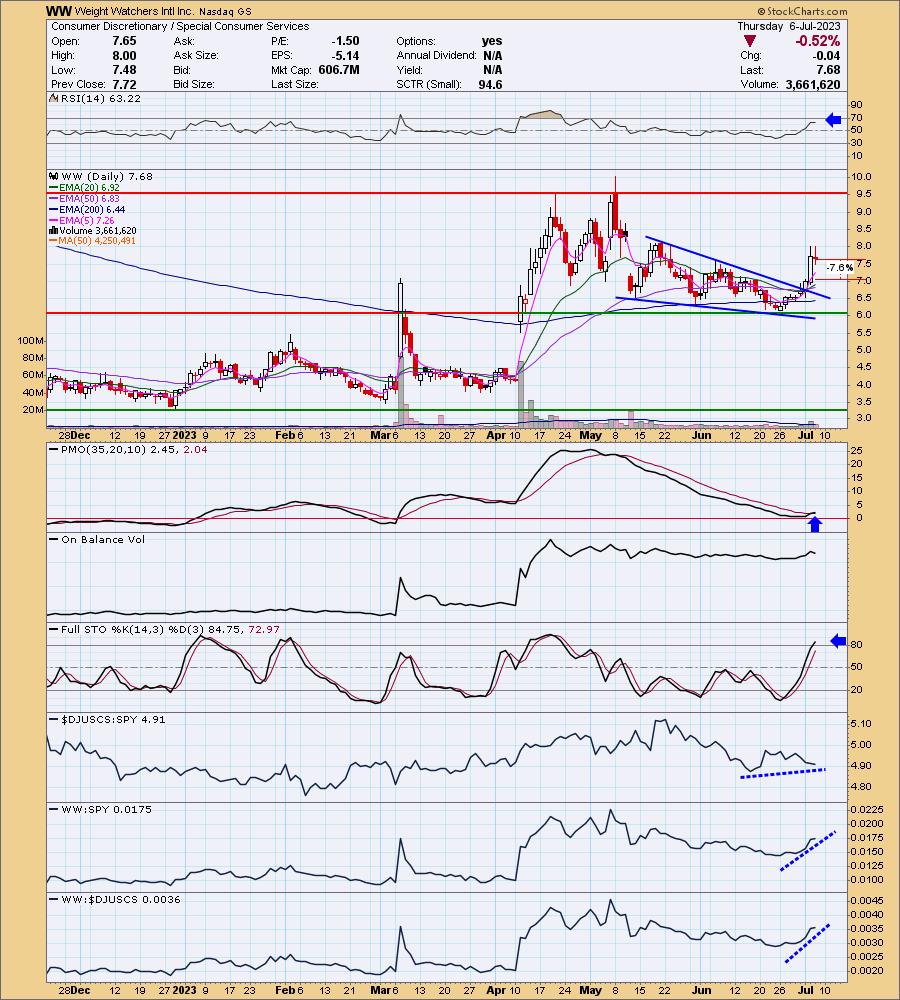
WW is down -0.26% in after hours trading. WW had a strong rally and it is in the process of digesting it. Today saw a bullish hollow red candlestick. Price broke from a bullish falling wedge and appears determined to reach overhead resistance. The RSI is positive and not overbought. The PMO just triggered a Crossover BUY Signal and Stochastics are above 80 and rising. The group near-term isn't performing particularly well, but it is in a rising trend on relative performance. WW is beginning to outperform the group and SPY. The stop is set around the 20-day EMA at 7.6% or $7.09.
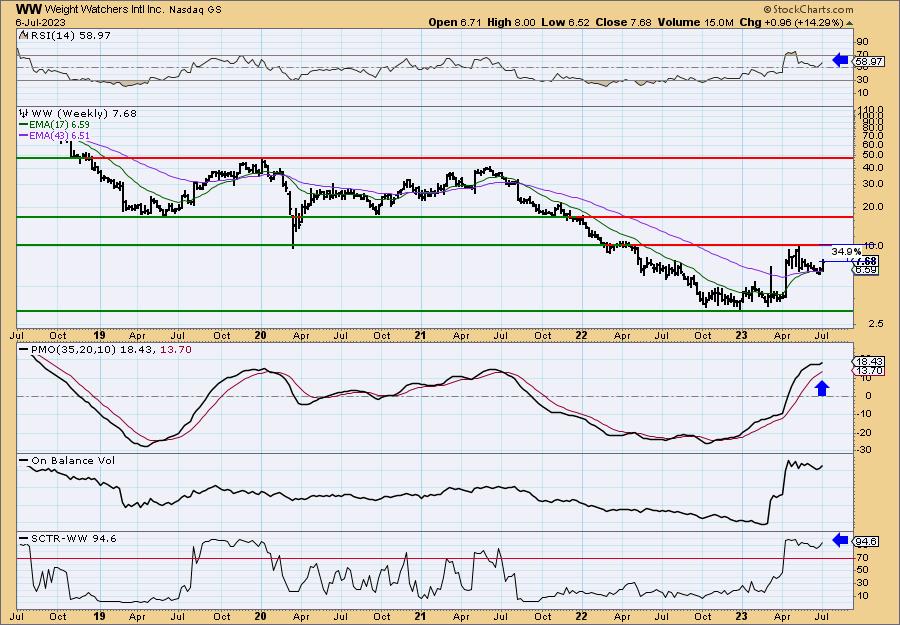
I really like the weekly chart so this could be considered an intermediate-term trade. The weekly RSI is positive, rising and not overbought. There is a weekly PMO Surge above the signal line and the SCTR is at the top of the hot zone. I like upside potential here.
Don't forget, on Thursdays I look at reader-requested symbols, click HERE to send me an email. I read every email I receive and try to answer them all!
Current Market Outlook:
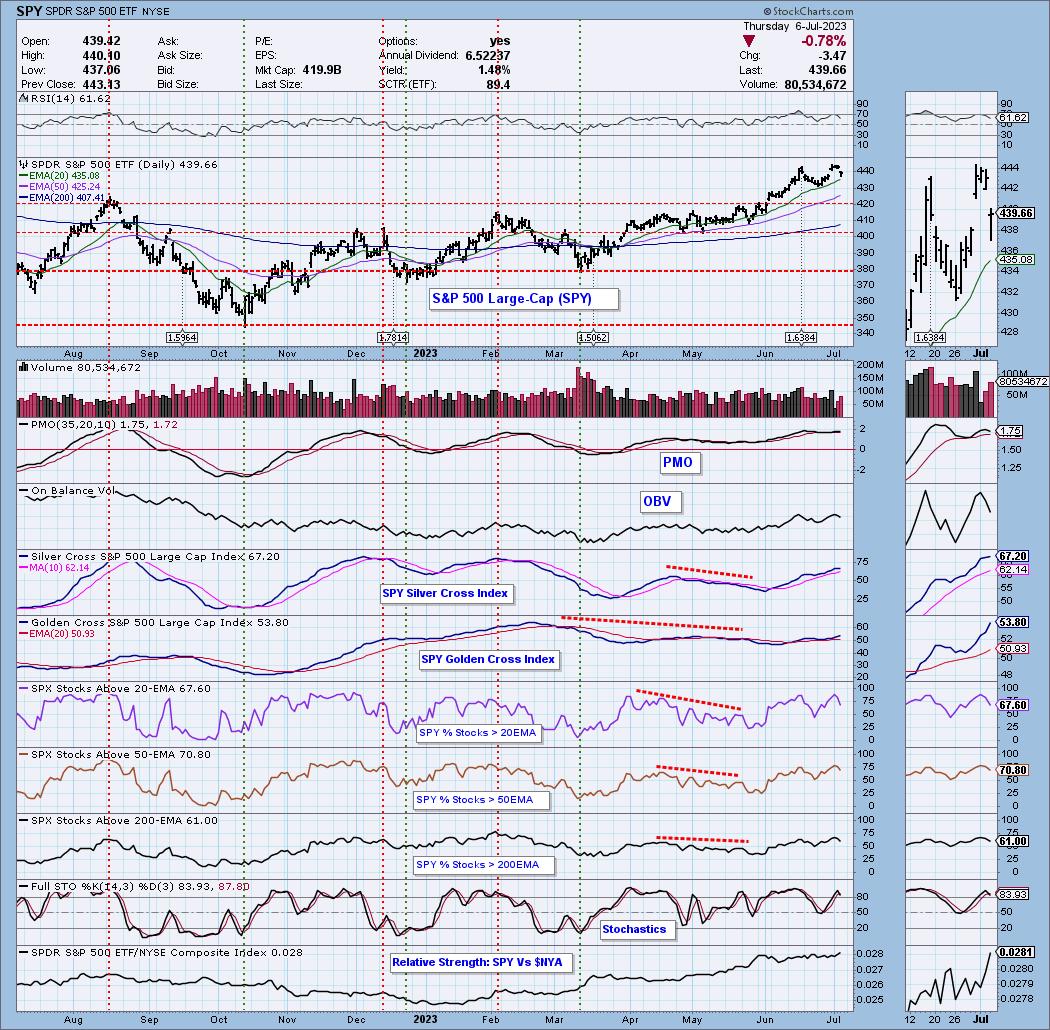
Market Environment: It is important to consider the odds for success by assessing the market tides. The following chart uses different methodologies for objectively showing the depth and trend of participation for intermediate- and long-term time frames.
- The Silver Cross Index (SCI) shows the percentage of SPX stocks on IT Trend Model BUY signals (20-EMA > 50-EMA)
- The Golden Cross Index (GCI) shows the percentage of SPX stocks on LT Trend Model BUY signals (50-EMA > 200-EMA)
Don't forget that as a "Diamonds" member, you have access to our GCI/SCI curated ChartList on DecisionPoint.com. You'll find it under "Members Only" links on the left side on the Blogs and Links Page.
Here is the current chart:
Full Disclosure: I am 60% long, 0% short.
I'm required to disclose if I currently own a stock I mention and/or may buy/short it within the next 72 hours.
"Technical Analysis is a windsock, not a crystal ball." - Carl Swenlin
(c) Copyright 2023 DecisionPoint.com
Watch the latest episode of DecisionPoint Trading Room with Carl & Erin Swenlin on Mondays 7:00p EST or on the DecisionPoint playlist on the StockCharts TV YouTube channel here!
NOTE: The stocks reported herein are from mechanical trading model scans that are based upon moving average relationships, momentum and volume. DecisionPoint analysis is then applied to get five selections from the scans. The selections given should prompt readers to do a chart review using their own analysis process. This letter is not a call for a specific action to buy, sell or short any of the stocks provided. There are NO sure things or guaranteed returns on the daily selection of "Diamonds in the Rough."
Regarding BUY/SELL Signals: The signal status reported herein is based upon mechanical trading model signals and crossovers. They define the implied bias of the price index/stock based upon moving average relationships and momentum, but they do not necessarily call for a specific action. They are information flags that should prompt chart review. Further, they do not call for continuous buying or selling during the life of the signal. For example, a BUY signal will probably (but not necessarily) return the best results if action is taken soon after the signal is generated. Additional opportunities for buying may be found as price zigzags higher, but the trader must look for optimum entry points. Conversely, exit points to preserve gains (or minimize losses) may be evident before the model mechanically closes the signal.
Helpful DecisionPoint Links:
Price Momentum Oscillator (PMO)
Swenlin Trading Oscillators (STO-B and STO-V)
For more links, go to DecisionPoint.com