
"Diamonds in the Rough" outperformed this week due to an excellent shorting opportunity. That short continues to look constructive. "Diamonds in the Rough" were up on the week while the SPY finished lower. We'll take that win.
This week's "Darling" as I alluded to above was the short on PulteGroup (PHM). This week's "Dud" was Amazon (AMZN). Both of these positions came in yesterday but I have to say I have serious reservations about AMZN right now given the weakness pervading the market right now. It is a leadership stock and so could lead the market downward as it suffered greatly today.
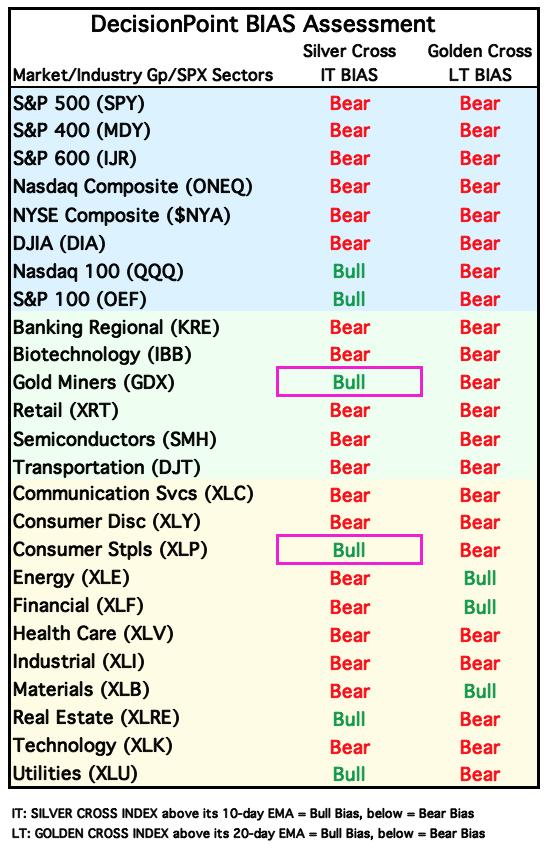
The Sector to Watch was easy to pick this week. While defensive groups Consumer Staples (XLP) and Utilities (XLU) are showing relative strength now, I really liked participation beneath the surface on Financials (XLF).
I have three Industry Groups to Watch. I'll only cover one, Life Insurance which is in XLF. I'll feed you the symbols we 'mined' out of today's Diamond Mine trading room when I discuss it below. The other two groups are Asset Managers and Investment Services. These are covered by this week's ETF, IAI so I opted not to cover them today. Symbols of interest from these groups? APO, DBRG, JXN, LPLA and HLI.
IMPORTANT: There will not be a Diamond Mine trading room next week. I will be out of town and on an airplane during our regular time. I'm contemplating holding one at 3p ET on Friday as I should be home by then. I'll keep you posted. Reports will go out late on Wednesday and Thursday.
Good Luck & Good Trading,
Erin

RECORDING LINK (9/15/2023):
Topic: DecisionPoint Diamond Mine (9/15/2023) LIVE Trading Room
Passcode: Sept#15th
REGISTRATION for 9/29/2023**:
When: Sep 29, 2023 09:00 AM Pacific Time (US and Canada)
Topic: DecisionPoint Diamond Mine (9/29/2023) LIVE Trading Room
Register in advance for this webinar HERE.
** I will be out of town so there won't be a Diamond Mine trading room on 9/22. **
After registering, you will receive a confirmation email containing information about joining the webinar.

Our latest DecisionPoint Trading Room recording (9/11):
A few items about the spreadsheet: I've put on the spreadsheet whether the RSI is positive (green) or negative (red). The PMO column tells you if it is rising (green) or falling (red). Finally I've added my own "Sparkle Factor" that gives you my assessment going forward, bullish (green), bearish (red) or neutral (gray). The Sparkle Factor is basically my thoughts on whether I expect it to rise or fall. A neutral means it could really go either way so it could be added to a watch list. If you're in a stock I consider "neutral" going forward, the ball is in your court.
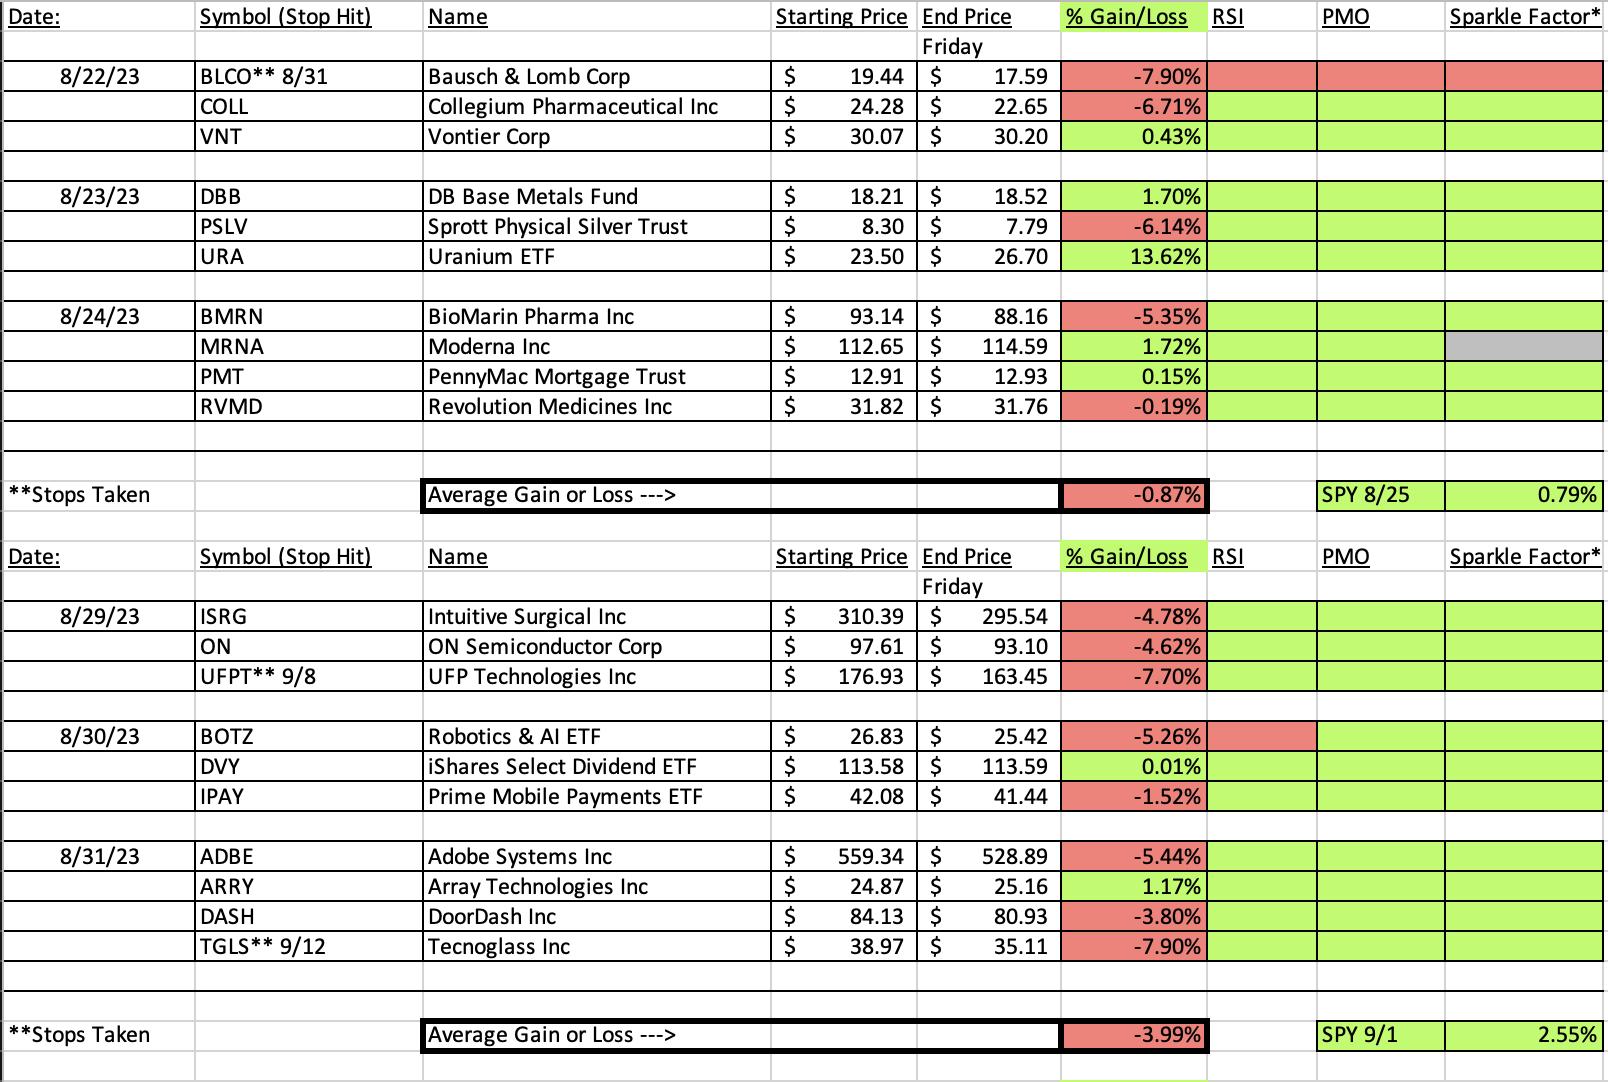
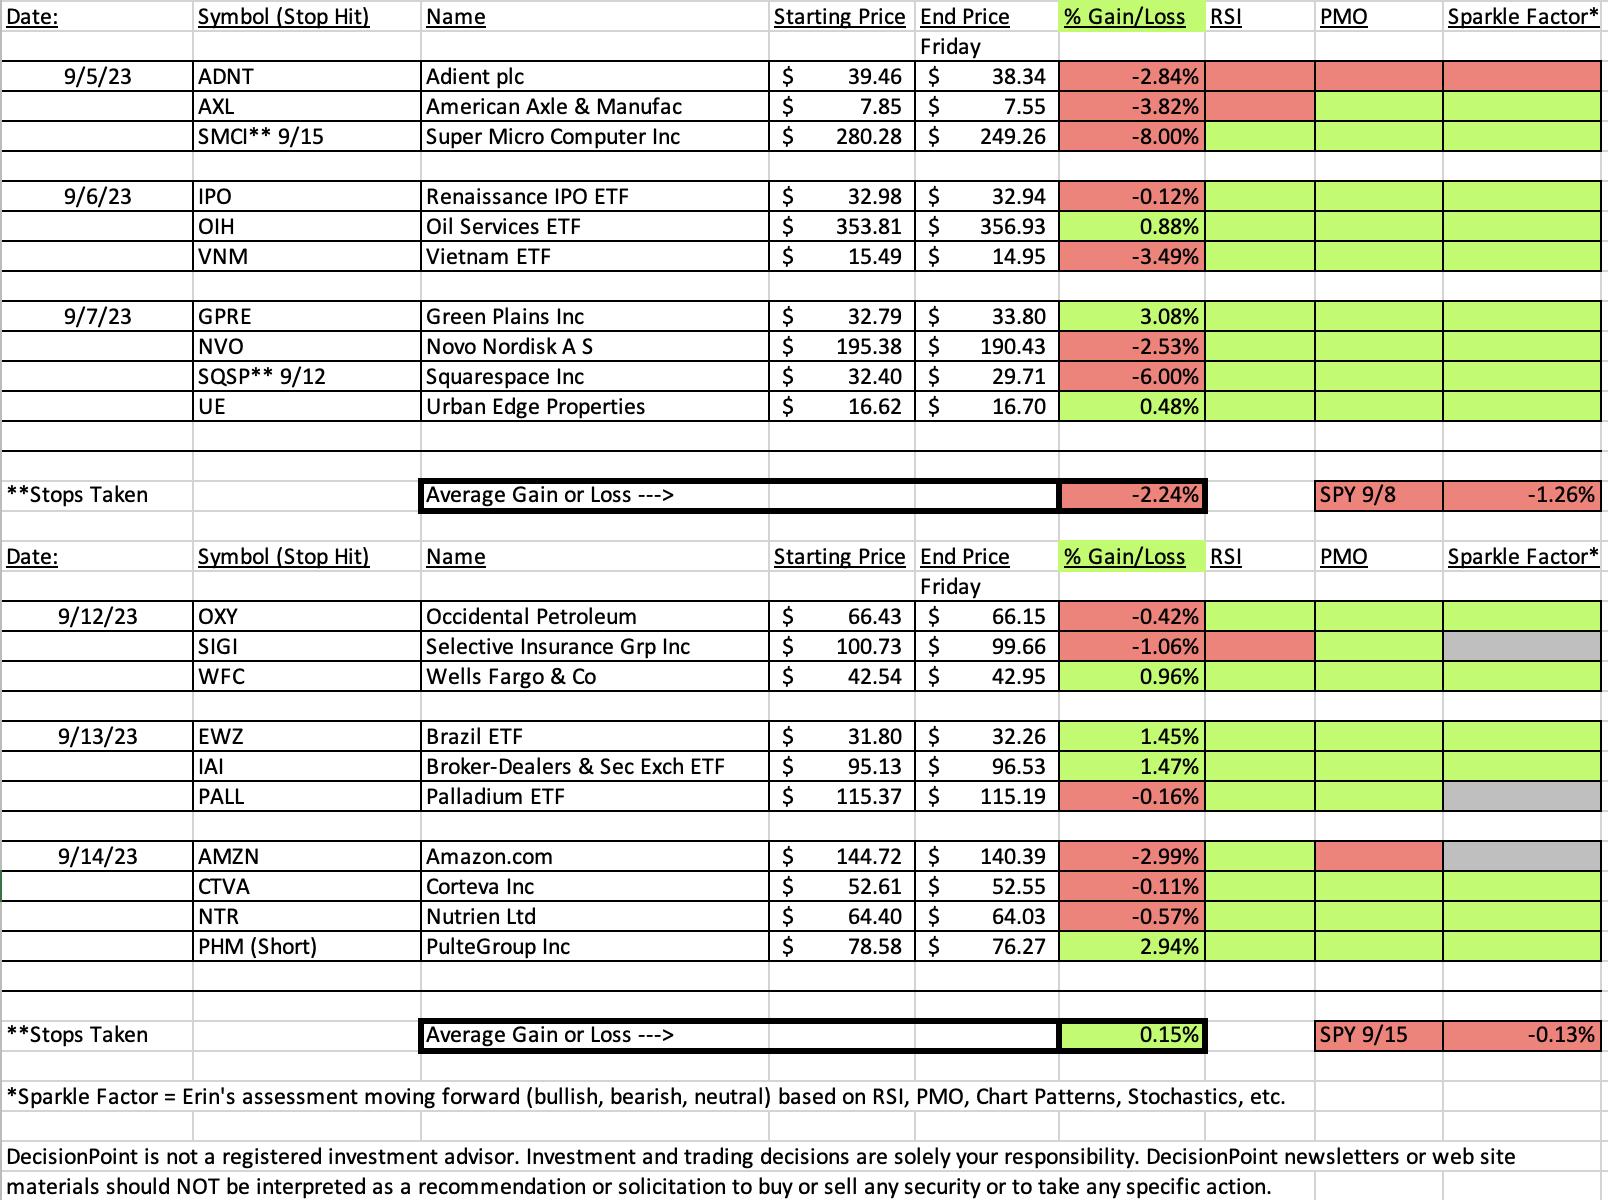
Darling:
PulteGroup, Inc. (PHM) - SHORT
EARNINGS: 10/24/2023 (BMO)
PulteGroup, Inc. engages in the homebuilding business. The firm is also involved in mortgage banking and title and insurance brokerage operations. It operates through the Homebuilding and Financial services business segments. The Homebuilding segment includes operations from Connecticut, Maryland, Massachusetts, New Jersey, New York, Pennsylvania, Virginia, Georgia, North Carolina, South Carolina, Tennessee, Florida, Illinois, Indiana, Kentucky, Michigan, Minnesota, Missouri, Ohio, Texas, Arizona, California, Nevada, New Mexico, and Washington. The Financial Services segment is composed of mortgage banking and title operations. The company was founded by William J. Pulte in 1950 and is headquartered in Atlanta, GA.
Predefined Scans Triggered: P&F Double Bottom Breakdown and Elder Bar Turned Blue.
Below are the commentary and chart from Thursday 9/14:
"PHM is down -1.34% in after hours trading, so our friend Joe might be onto something here. I noticed a large bearish rounded top. Remember this is a short so we want the chart to look as ugly as possible. The one positive on the chart is that support at $75 hasn't been broken and so it could hold up. Other than that everything is looking negative. The RSI is in negative territory right now, albeit currently rising. The PMO is declining and should drop beneath the zero line soon. Stochastics are tumbling lower in negative territory. I noticed a reverse divergence on the OBV. Notice that volume has been increasing, but price is not following volume with higher highs. Relative strength is failing across the board. The stop is set above the current price since this is a short. I've set it at the two previous tops at 6.4% or $83.60."
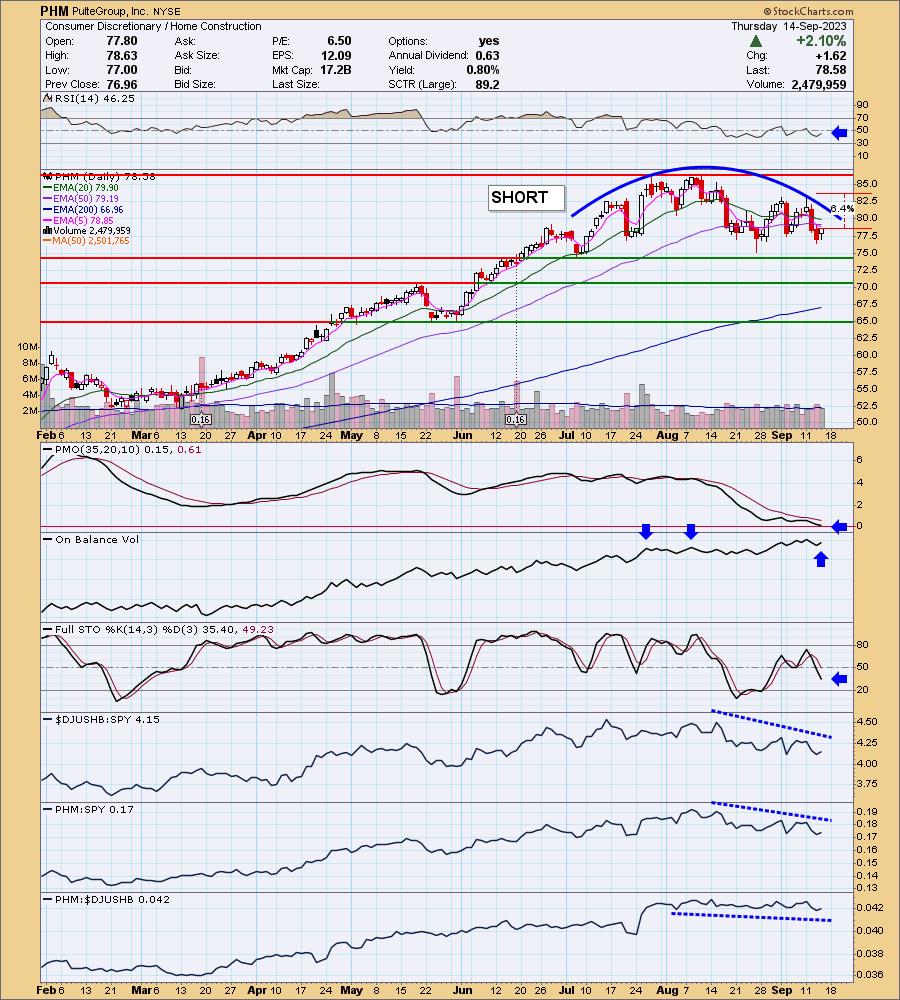
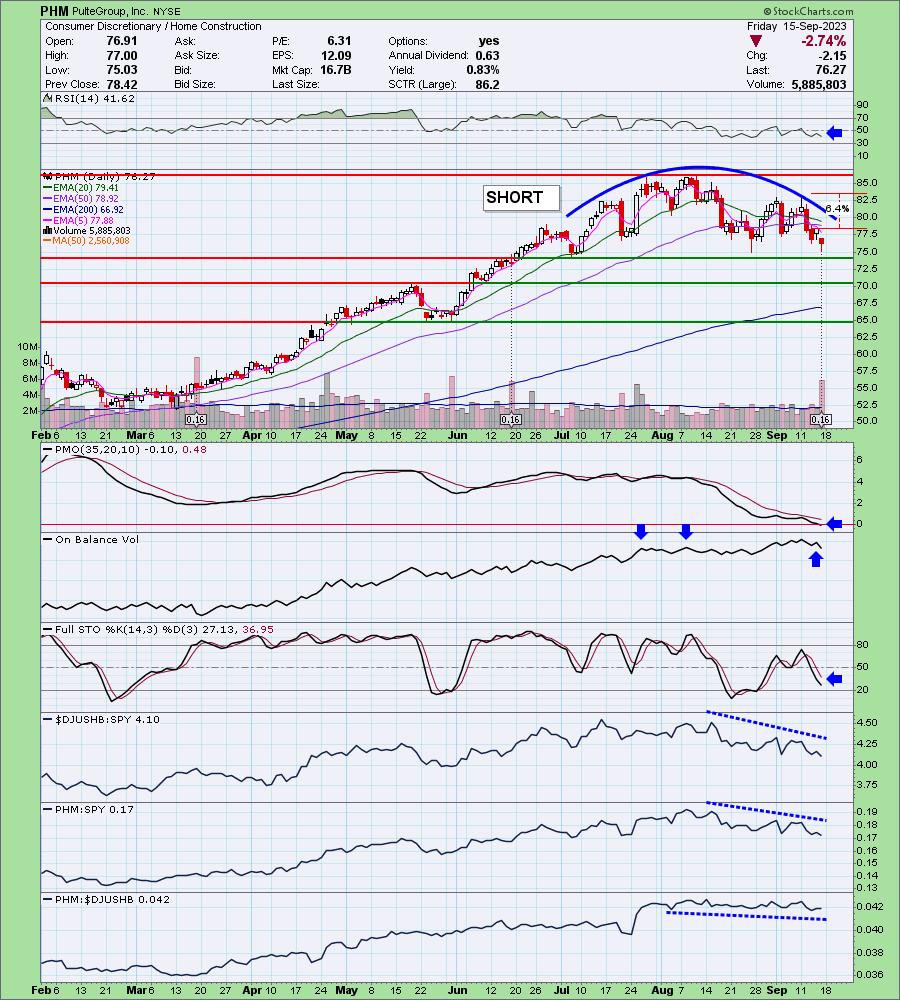
Here is today's chart:
The only negative to this short is that support is about to be reached and that is where the danger would lie for an upside reversal. However, the intermediate-term rounded top is ominous and the PMO just hit negative territory today. The RSI is still negative. Look at the volume on the selling. Clearly there are problems. Stochastics continue to look terrible. I think this one has further to fall.
Don't forget, on Thursdays I look at reader-requested symbols, so shoot me an email at erin@decisionpoint.com. I read every email I receive and try to answer them all!
Dud:
Amazon.com, Inc. (AMZN)
EARNINGS: 11/02/2023 (AMC)
Amazon.com, Inc. is a multinational technology company, which engages in the provision of online retail shopping services. It operates through the following segments: North America, International, and Amazon Web Services (AWS). The North America segment is involved in the retail sales of consumer products including from sellers and subscriptions through North America-focused online and physical stores. It also includes export sales from online stores. The International segment focuses on the amounts earned from retail sales of consumer products including from sellers and subscriptions through internationally-focused online stores. The AWS segment consists of global sales of compute, storage, database, and other services for start-ups, enterprises, government agencies, and academic institutions. The company was founded by Jeffrey P. Bezos in July 1994 and is headquartered in Seattle, WA.
Predefined Scans Triggered: New 52-week Highs, Stocks in a New Uptrend (Aroon), P&F Ascending Triple Top Breakout and P&F Double Top Breakout.
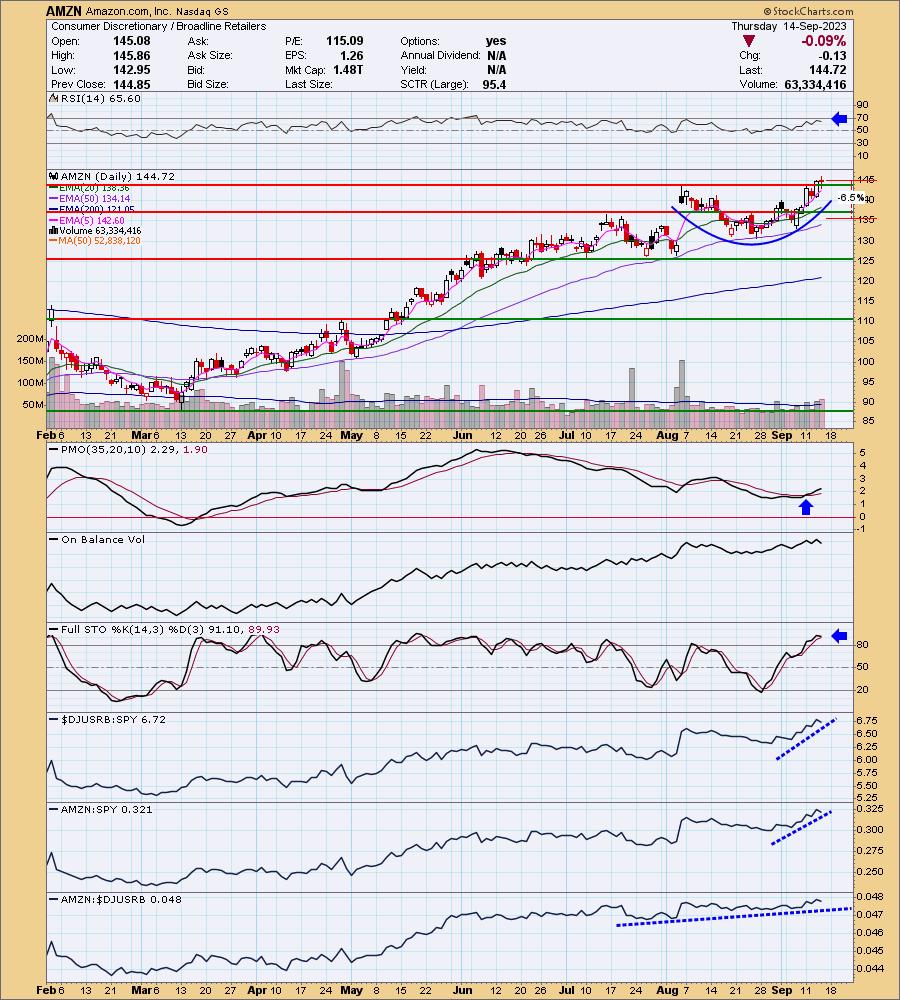
Below are the commentary and chart from Thursday (9/14):
"AMZN is down -0.12% in after hours trading. AMZN broke out yesterday and cooled today. It has formed a nice base that should mean this breakout will lead to higher prices. The RSI is positive and the PMO is on a Crossover BUY Signal. Stochastics are above 80. Relative strength is positive for the group and AMZN is outperforming both the group and the SPY. I've set the stop near the 50-day EMA and below support at the July top at 6.5% or $135.31."
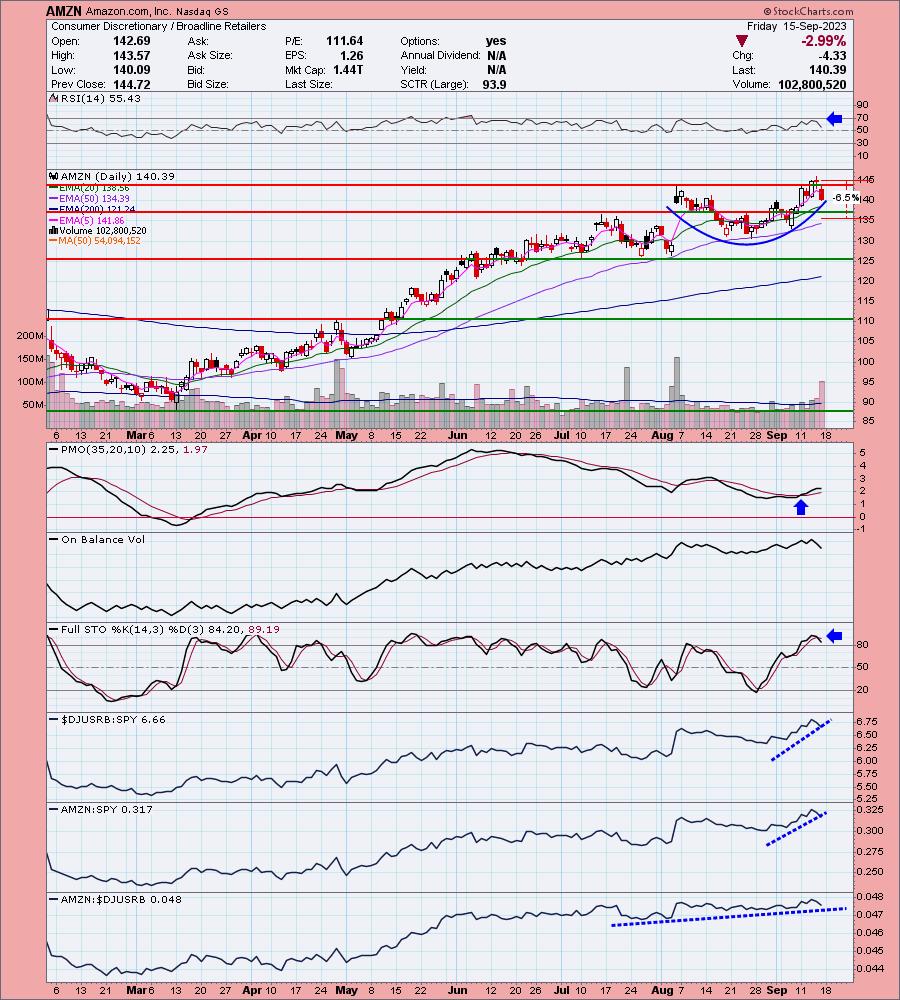
Here is today's chart:
Amazon (AMZN) hit the skids today down almost 3%. With the market looking weak I'm skeptical about AMZN's chances to rally out of the current base. The PMO has turned down in just one day. I've left the Sparkle Factor as simply "Neutral", but I'm definitely leaning bearish. The rising trend is still intact so it isn't over for AMZN, I just think there is more risk than I would like to buy here. Holding may not be a bad idea at least until the rising trend starts to deteriorate more. There is a chance at an upside reversal.
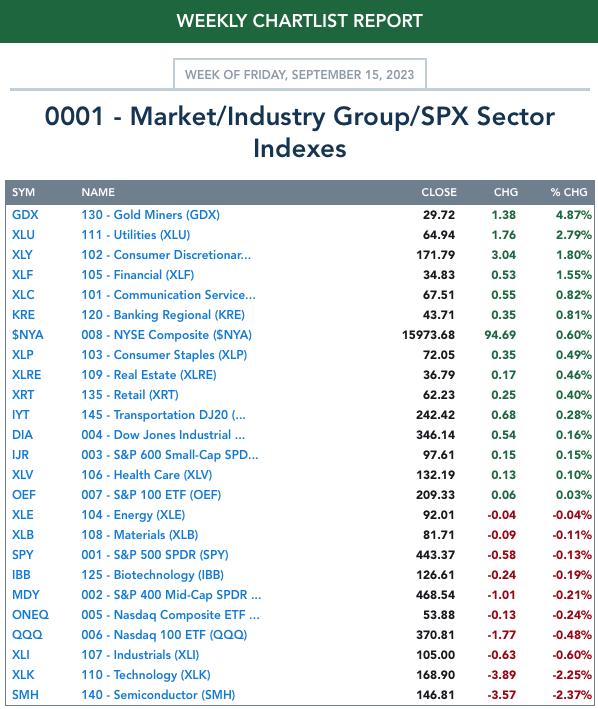
THIS WEEK's Performance:
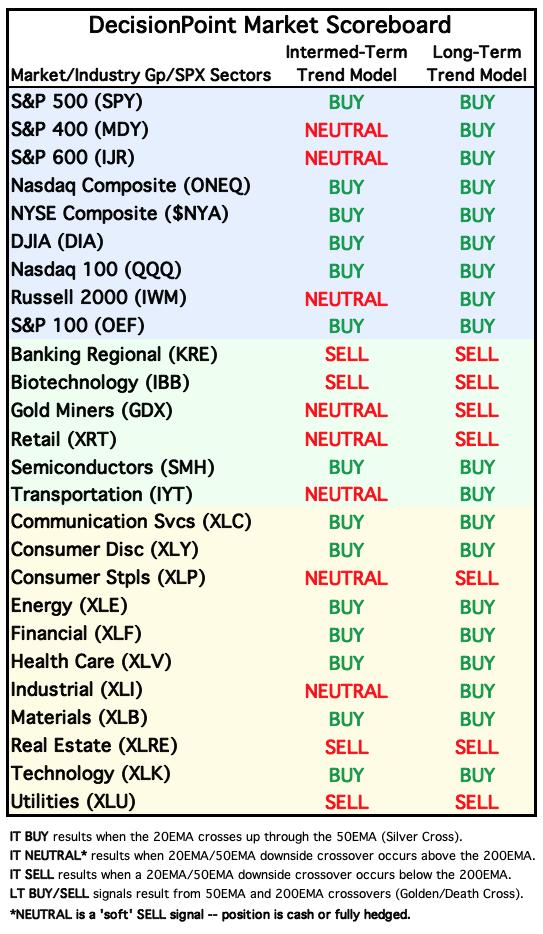
DecisionPoint Sector Scoreboard (Mechanical Trend Model Signals):
Bias Table:
Click Here to view Carl's annotated "Under the Hood" ChartList!
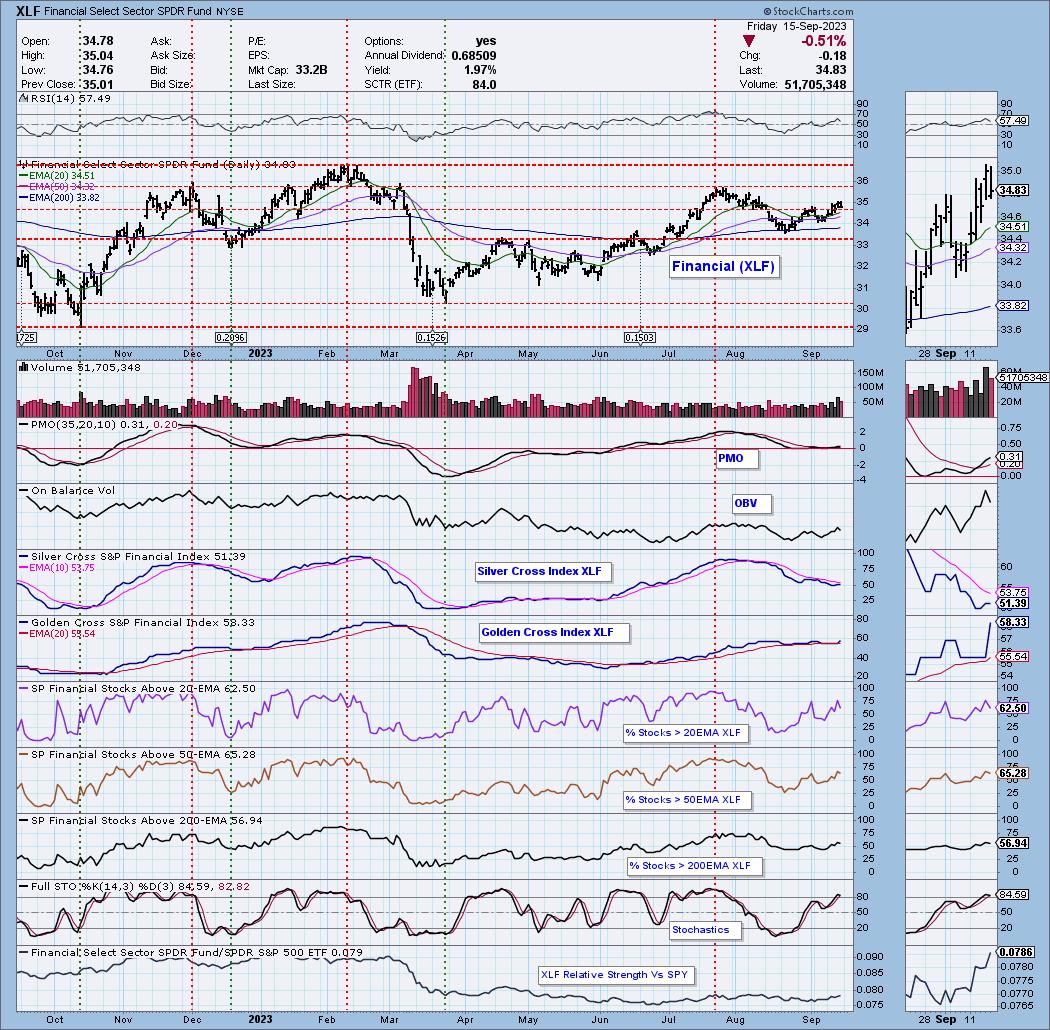
Sector to Watch: Financials (XLF)
There were a few reasons I selected XLF as today's "Sector to Watch". Primary was price action which shows a higher low and higher high out of the August low. Secondary was the improved participation with readings on %Stocks > 20/50/200EMAs expanding and sitting above our bullish 50% threshold. The Silver Cross Index is still a little suspect, but the Golden Cross Index looks quite bullish. Stochastics are above 80 and the RSI is in positive territory. Best of all there is a new PMO Crossover BUY Signal that occurred above the zero line. I like XLF's chances next week.
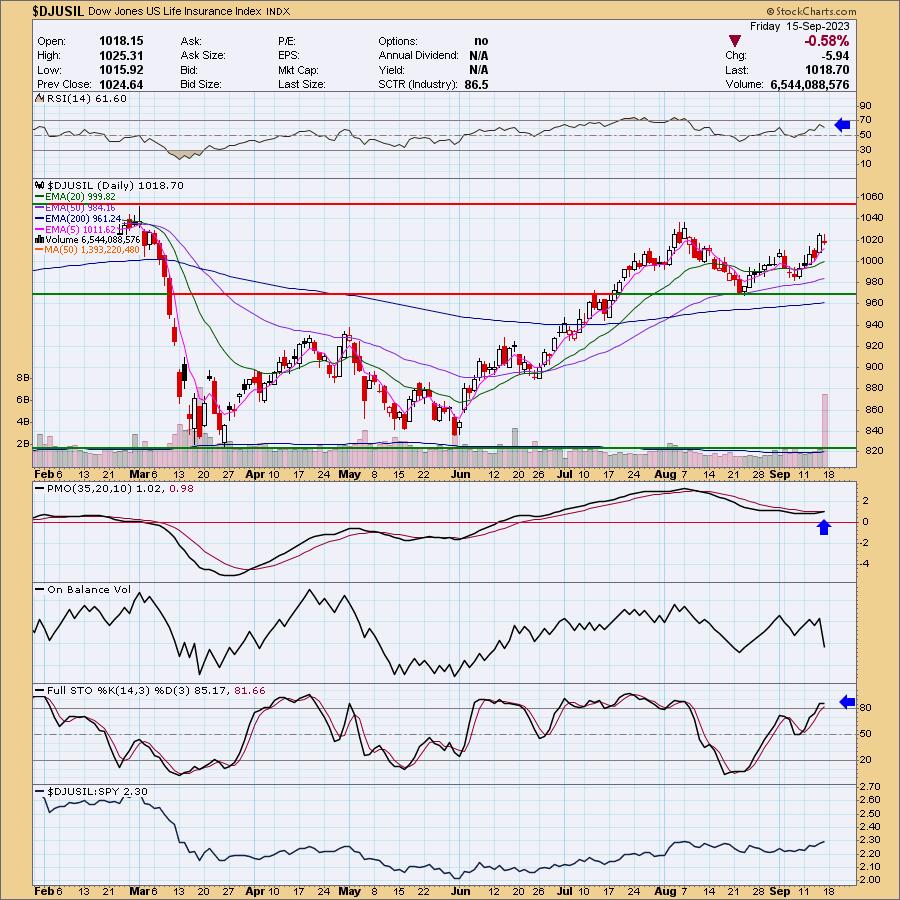
Industry Group to Watch: Life Insurance ($DJUSIL)
Life Insurance looks very similar to XLF itself, higher high and higher low since August bottom. The RSI is positive and there is a new PMO Crossover BUY Signal. I don't like the selling volume today, but good news is that it didn't move price much. The symbols we found that were particularly bullish within this group: PRU, BHF and MET.
Go to our Under the Hood ChartList on DecisionPoint.com to get an in-depth view of all the sectors. On StockCharts.com you can find the Industry Summary.
Good Luck & Good Trading!
- Erin
erin@decisionpoint.com
Full Disclosure: I'm 40% long, 0% short.
Watch the latest episode of the DecisionPoint Trading Room with Carl & Erin Swenlin on Mondays 3:00p EST!
Technical Analysis is a windsock, not a crystal ball. --Carl Swenlin
NOTE: The stocks reported herein are from mechanical trading model scans that are based upon moving average relationships, momentum and volume. DecisionPoint analysis is then applied to get selections from the scans. The selections given should prompt readers to do a chart review using their own analysis process. This letter is not a call for a specific action to buy, sell or short any of the stocks provided. There are NO sure things or guaranteed returns on the selection of "diamonds in the rough."
Helpful DecisionPoint Links:
DecisionPoint Shared ChartList and DecisionPoint Chart Gallery
Price Momentum Oscillator (PMO)
Swenlin Trading Oscillators (STO-B and STO-V)
(c) Copyright 2023 DecisionPoint.com