
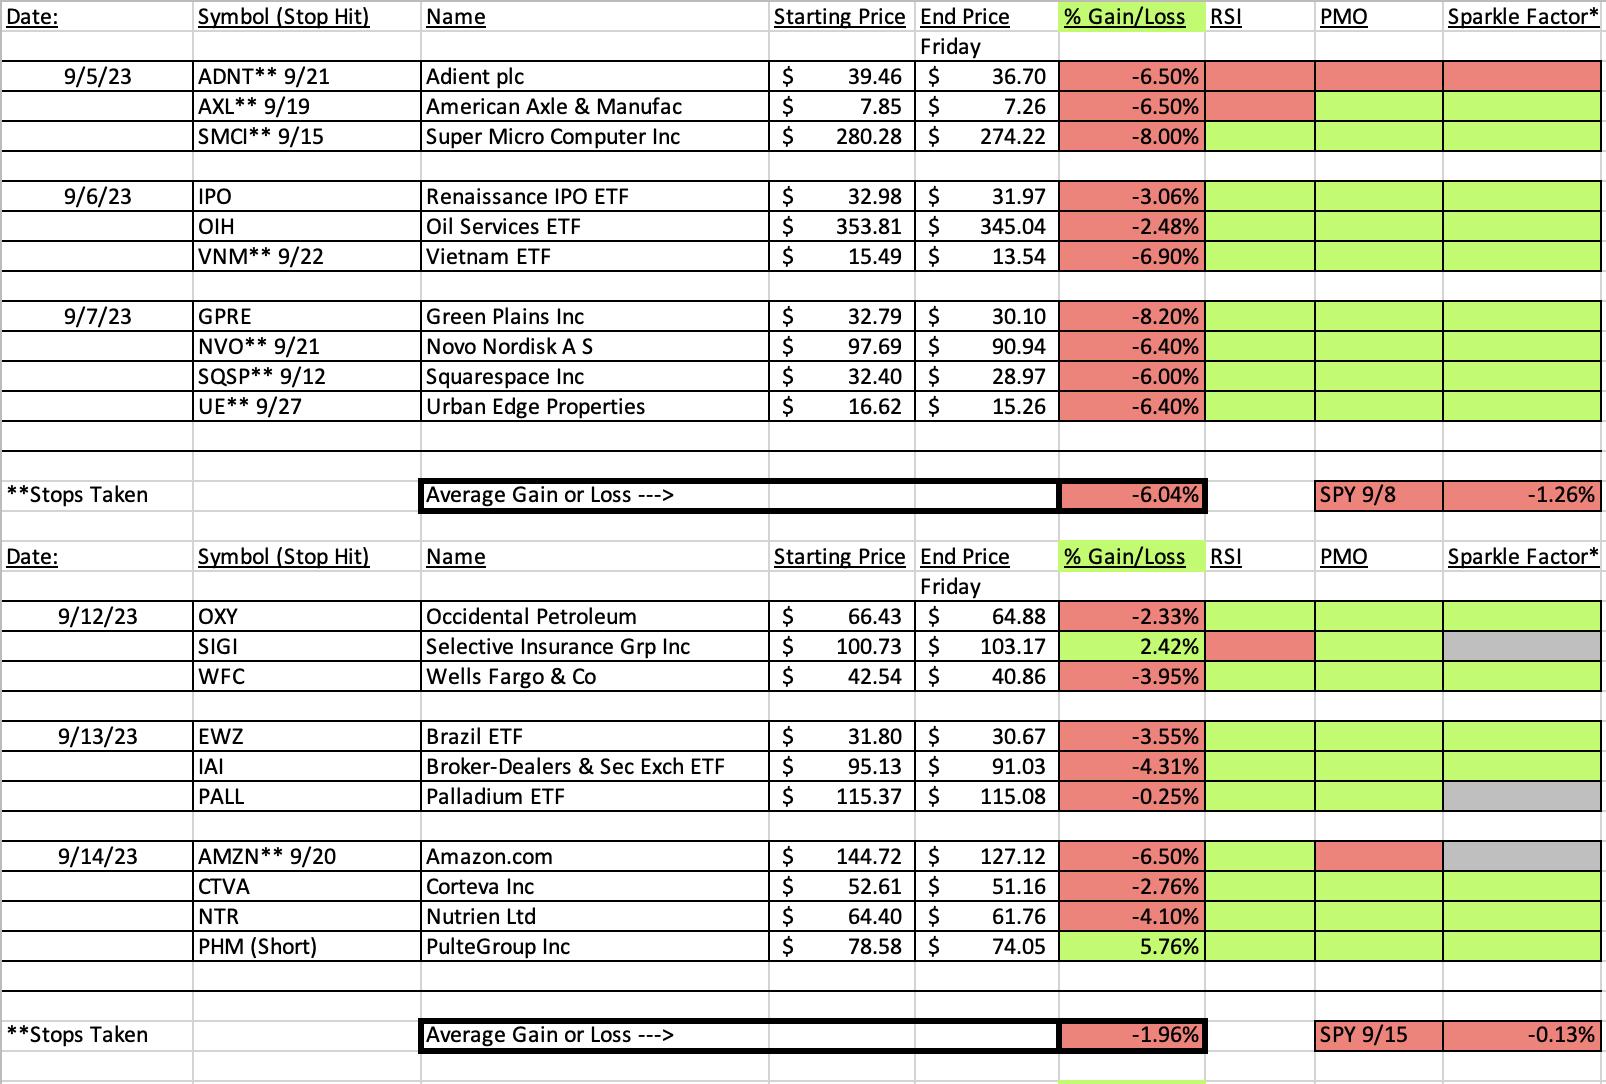
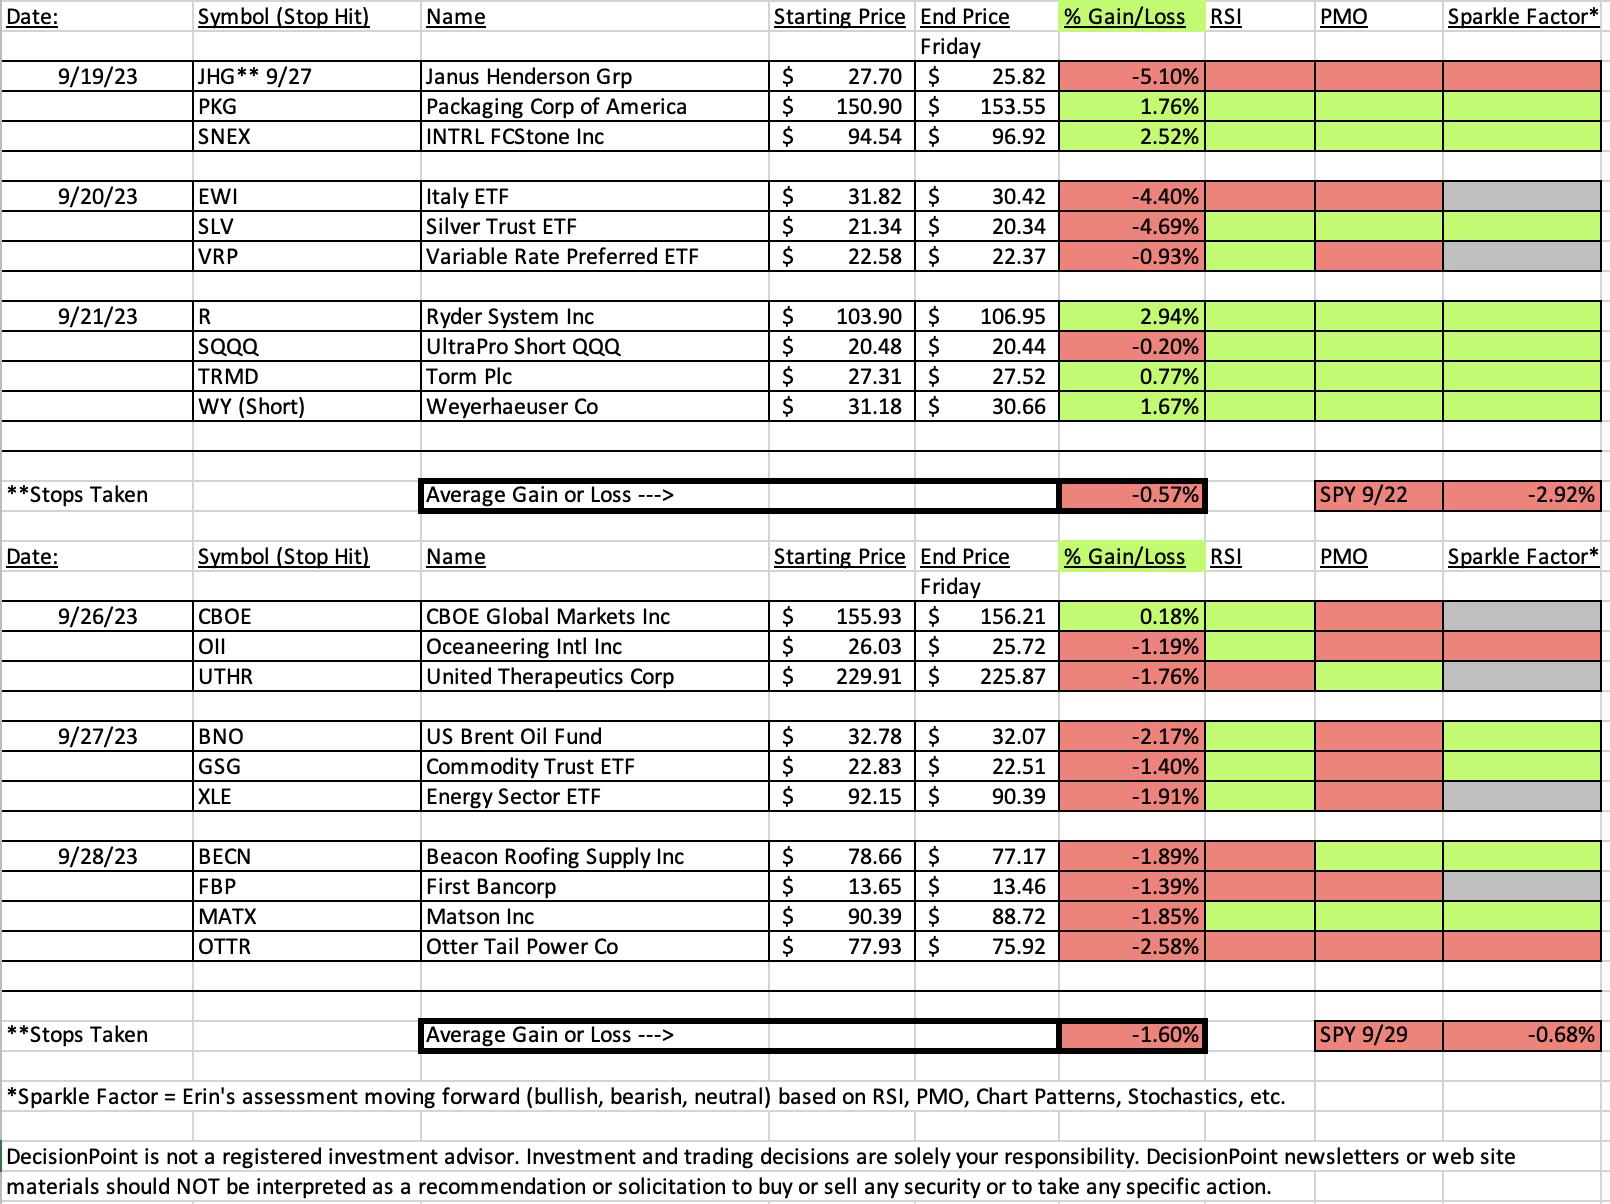
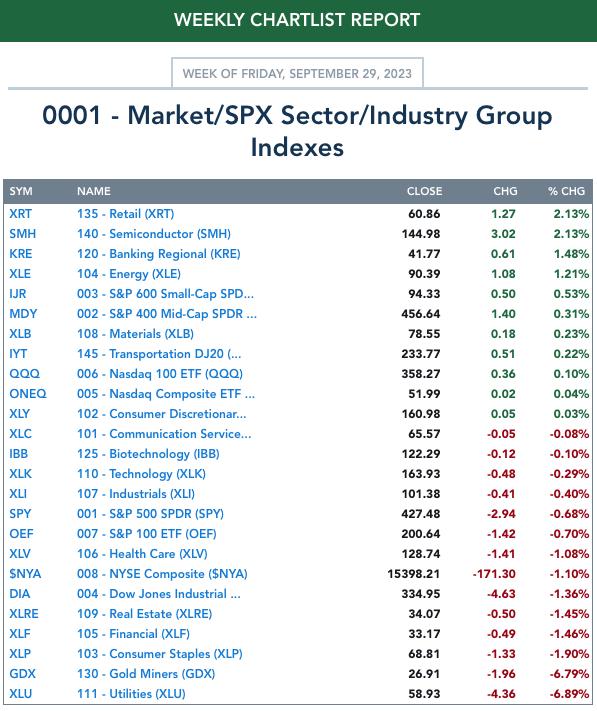
The market finished lower this week as did "Diamonds in the Rough". We went "all in" on one industry group and that did come back to bite us on the recent pullback in Crude Oil. I still think that area of the market will resume its rally, it just needed to cool.
I honestly can't remember a time when the spreadsheet looked so negative for the week. It had to happen eventually and given the market's movement this week it isn't a complete surprise. I think I'll have to get less picky about shorts and expand my bearish scans so that I can catch them before they've been in a lengthy decline.
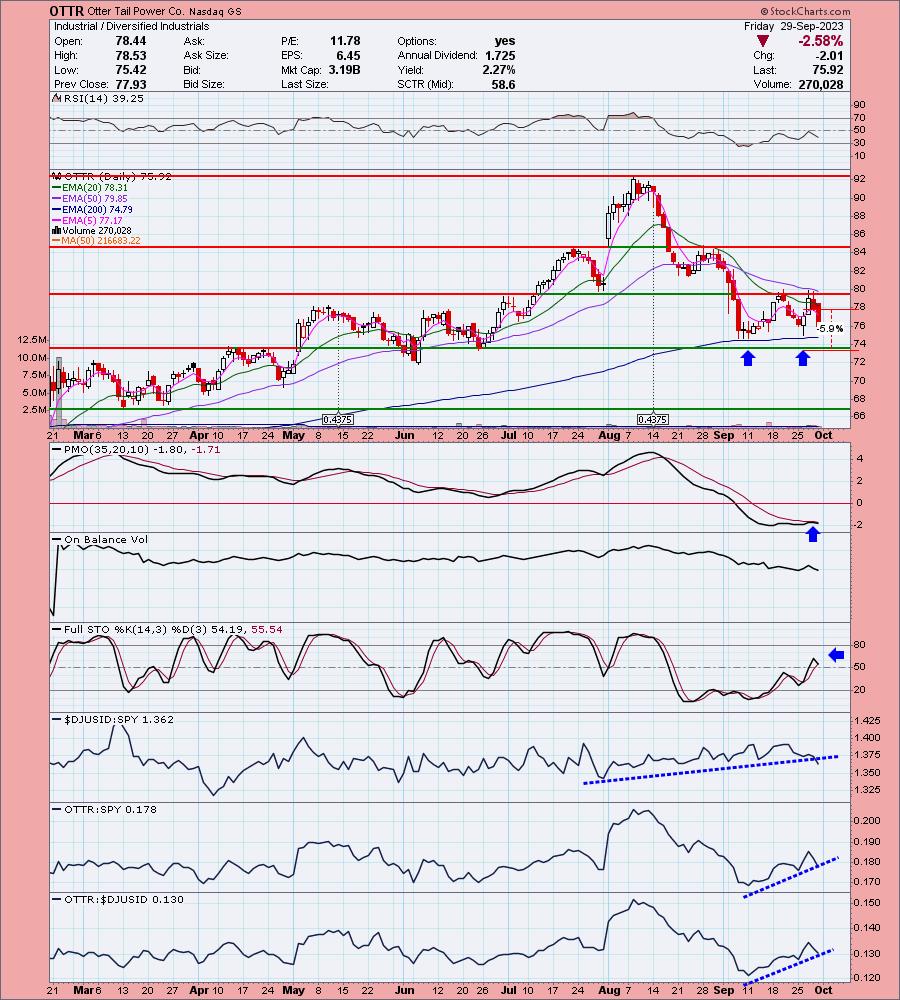
The "Darling" was CBOE Global Markets (CBOE) which was the only position that finished higher this week. The "Dud" was Otter Tail Power (OTTR) which had a terrible day.
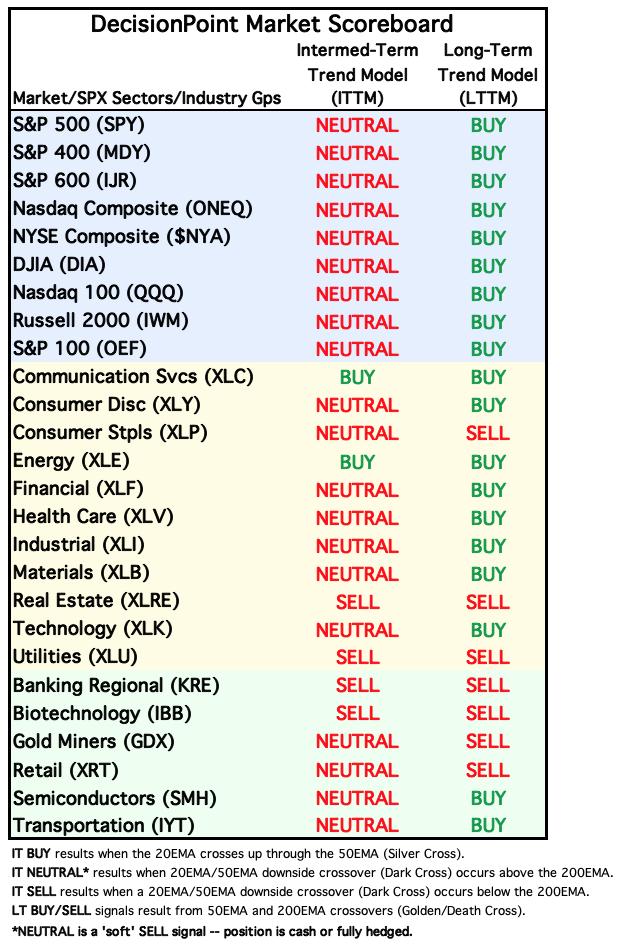
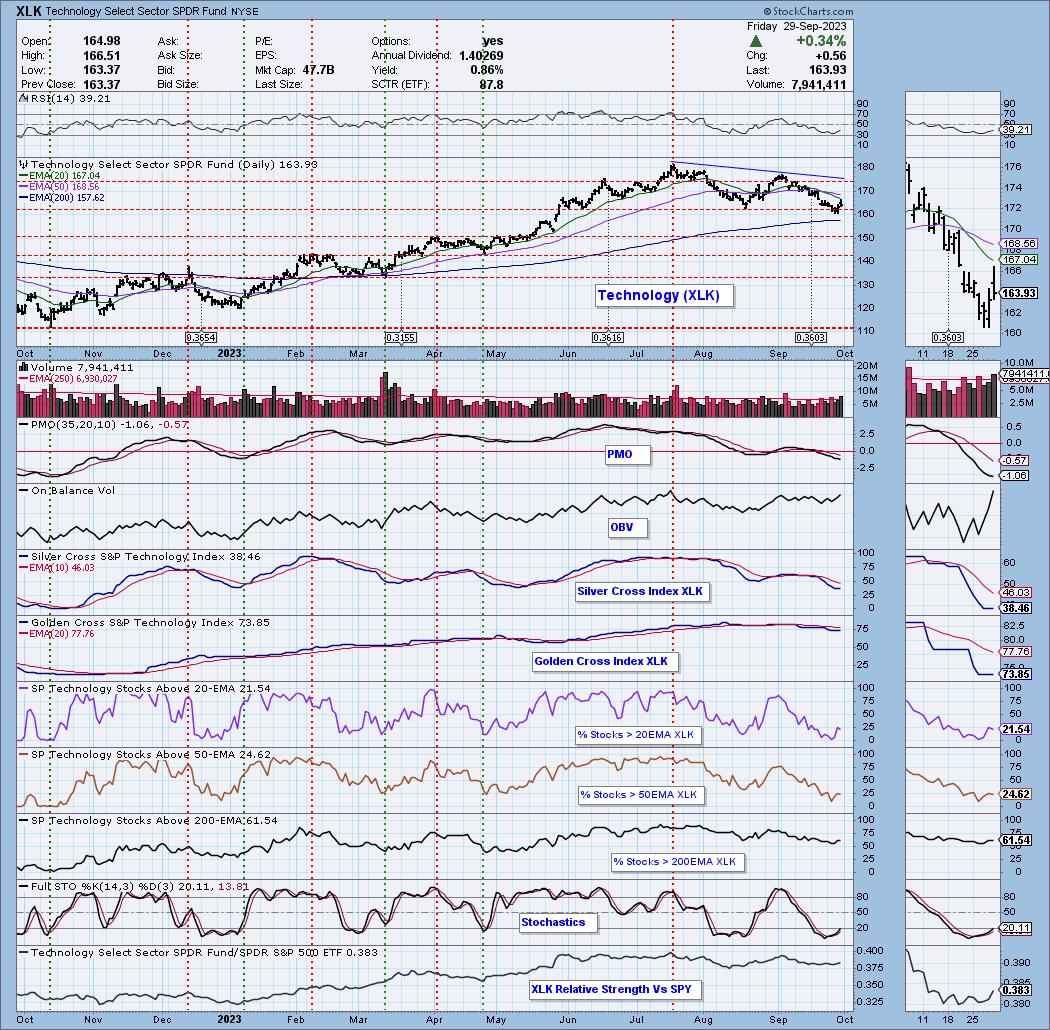
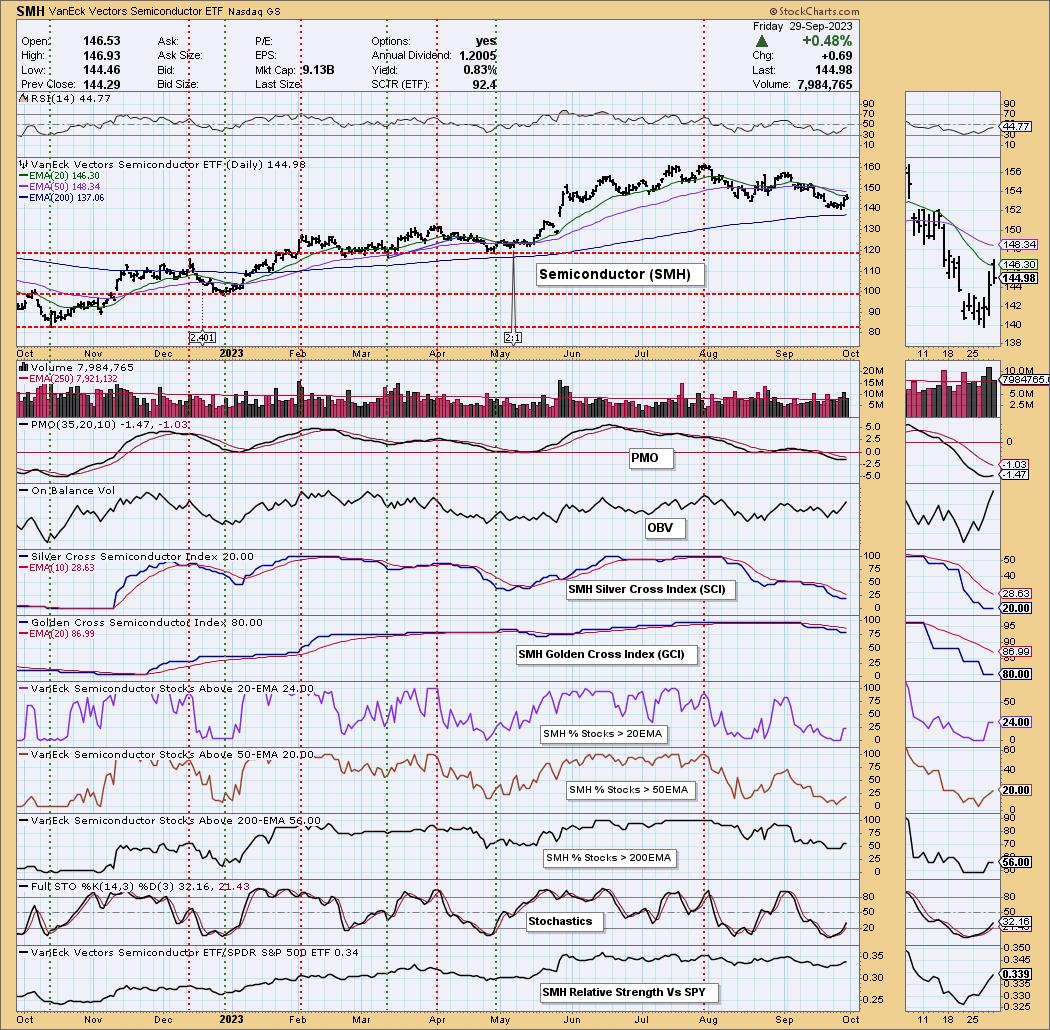
I decided to go with Technology (XLK) as the Sector to Watch this week versus Materials (XLB), as XLK is the only sector that is close to seeing rising momentum. All PMOs are pointed lower on all sectors. I'm going to continue to use Semiconductors (SMH) as the Industry Group to Watch although the market's failure to finish higher has me concerned about both XLK and SMH. You'll need to watch any position in this area like a hawk if the market succumbs to lower prices to begin the week.
Next week we'll do better!
Good Luck & Good Trading,
Erin

RECORDING LINK (9/29/2023):
Topic: DecisionPoint Diamond Mine (9/29/2023) LIVE Trading Room
Passcode: Sept#29th
REGISTRATION for 10/6/2023:
When: Oct 6, 2023 09:00 AM Pacific Time (US and Canada)
Topic: DecisionPoint Diamond Mine (10/6/2023) LIVE Trading Room
Register in advance for this webinar HERE
After registering, you will receive a confirmation email containing information about joining the webinar.

Our latest DecisionPoint Trading Room recording (9/25):
A few items about the spreadsheet: I've put on the spreadsheet whether the RSI is positive (green) or negative (red). The PMO column tells you if it is rising (green) or falling (red). Finally I've added my own "Sparkle Factor" that gives you my assessment going forward, bullish (green), bearish (red) or neutral (gray). The Sparkle Factor is basically my thoughts on whether I expect it to rise or fall. A neutral means it could really go either way so it could be added to a watch list. If you're in a stock I consider "neutral" going forward, the ball is in your court.
Darling:
CBOE Global Markets Inc. (CBOE)
EARNINGS: 11/09/2023 (BMO)
Cboe Global Markets, Inc. engages in the provision of trading and investment solutions to investors. It operates through the following business segments: Options, North American Equities, Futures, Europe and Asia Pacific, Global FX, and Digital. The Options segment includes the options exchange business, which lists trading options on market indexes (index options), as well as on non-exclusive multiply listed options. The North American Equities segment covers listed cash equities and ETP transaction services that occur on BZX, BYX, EDGX, and EDGA. The Futures segment is composed of the business of futures exchange, CFE, which includes offering for trading futures on the VIX Index and bitcoin and other futures products. The Europe and Asia Pacific segment relates to the pan-European listed cash equities transaction services, ETPs, exchange-traded commodities, and international depository receipts that occur on the RIE, operated by Cboe Europe Equities. The Global FX segment represents the institutional FX trading services that occur on the Cboe FX platform. The Digital segment refers to Cboe Digital, which operates a digital asset spot market and a regulated futures exchange. The company was founded in 1973 and is headquartered in Chicago, IL.
Predefined Scans Triggered: P&F Ascending Triple Top Breakout and P&F Double Top Breakout.
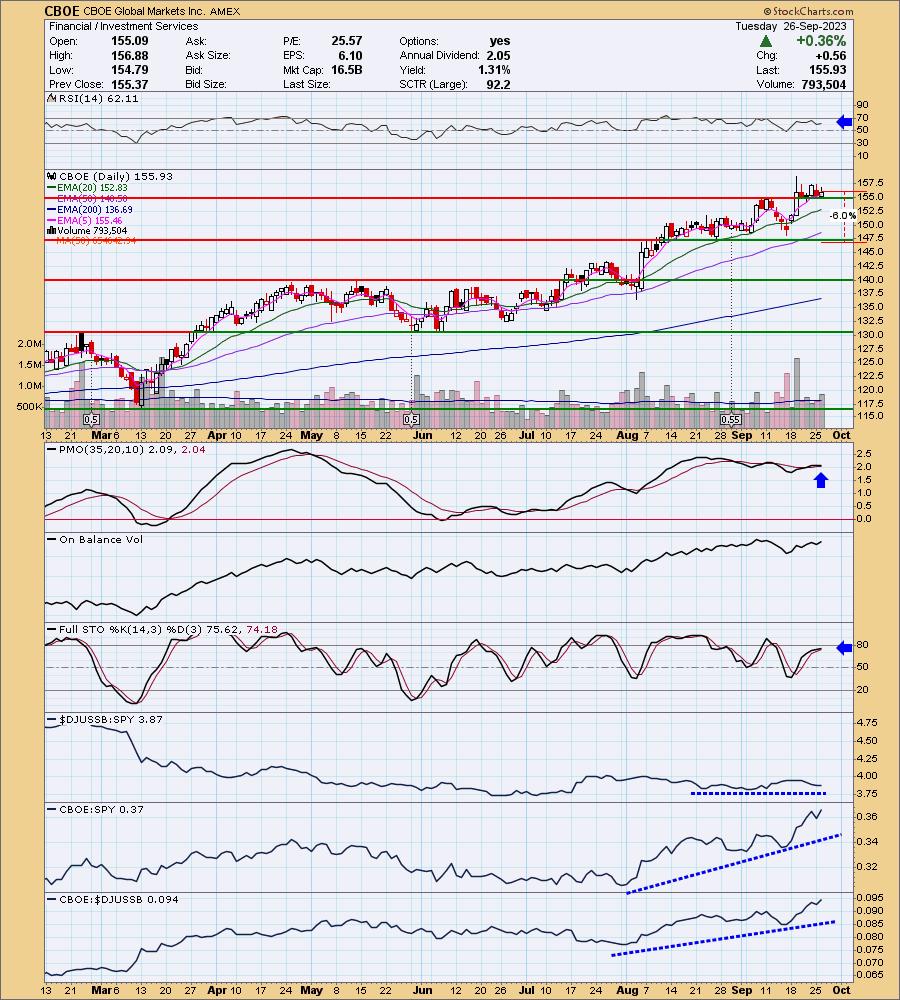
Below are the commentary and chart from Tuesday 9/26:
"CBOE is down -0.71% in after hours trading. I hope that the decline right now doesn't carry into tomorrow as it would likely break below the support it has worked so hard to build over the past five days. Still, this one came through on my Surge Scan so while it is an eye test, the PMO has surged above the signal line. The EMAs are configured positively with the slowest EMA on the bottom and fastest on the top. This one shows internal strength as Stochastics are still rising above net neutral (50). The RSI is also positive. This is a winner that we are looking to keep on winning in spite of market weakness. Relative strength is excellent against the group and SPY. My stop is set beneath support at 6% or $146.57."
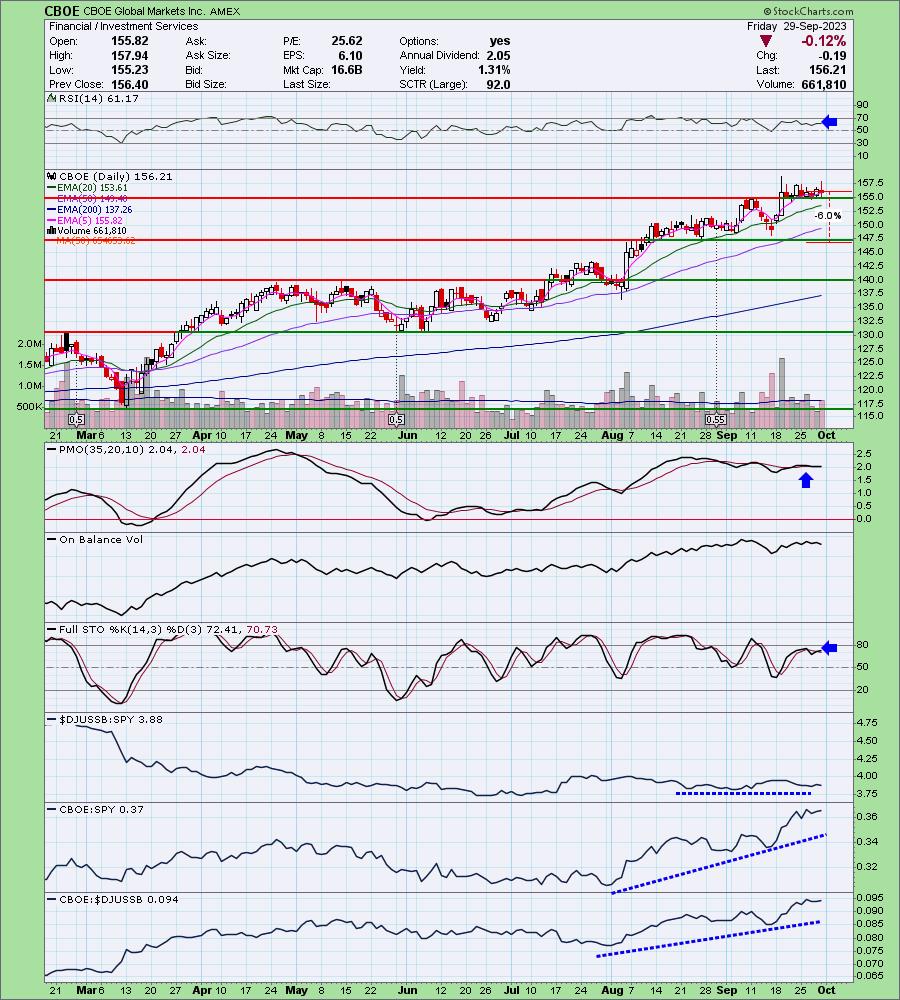
Here is today's chart:
I've marked a Neutral "Sparkle Factor" for this one even though it was the "Darling" this week. So far support is holding which is why I am not bearish, but the PMO turned down so I can't be entirely bullish. Stochastics are also mediocre. This is a hold at this point, but keep a tight stop as I wouldn't be interested in it if it lost support at the 50-day EMA. That has been a fairly good as support along the way on this rally.
Don't forget, on Thursdays I look at reader-requested symbols, so shoot me an email at erin@decisionpoint.com. I read every email I receive and try to answer them all!
Dud:
Otter Tail Power Co. (OTTR)
EARNINGS: 10/30/2023 (AMC)
Otter Tail Corp. is a holding company engaged in the energy, infrastructure, and production businesses. It operates through the following segments: Electric, Manufacturing, and Plastics. The Electric segment is involved in the generation, purchase, transmission, distribution, and sale of electric energy in western Minnesota, eastern North Dakota, and northeastern South Dakota. The Manufacturing segment consists of businesses in the manufacturing arena, including contract machining, metal parts stamping, fabrication, and painting, and the production of plastic thermoformed horticultural containers, life science and industrial packaging, material handling components, and extruded raw material stock. The Plastics segment offers businesses that produce polyvinyl chloride pipes at plants in North Dakota and Arizona. The company was founded in 1907 and is headquartered in Fergus Falls, MN.
Predefined Scans Triggered: None.
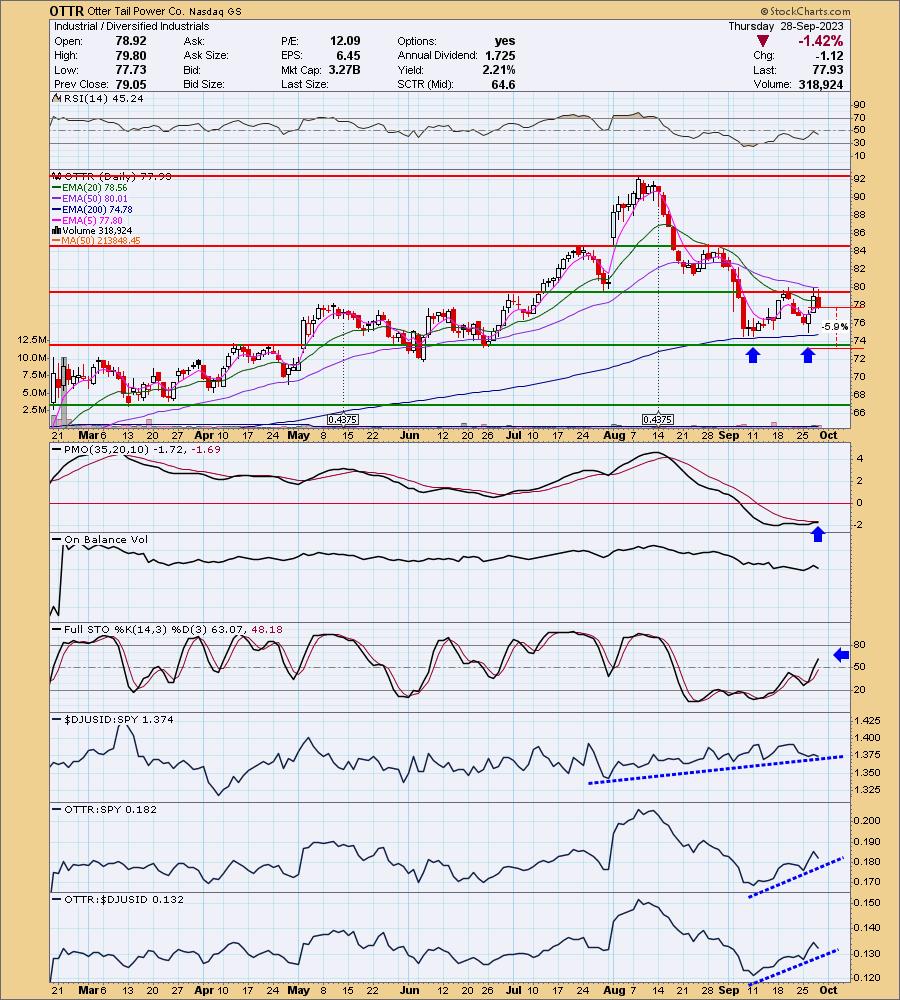
Below are the commentary and chart from Friday 9/28:
"OTTR is up +1.44% in after hours trading, basically erasing today's decline. There is a textbook double bottom pattern that formed right on top of the 200-day EMA. The pattern isn't confirmed yet with a breakout but it looks pretty good. The RSI is not positive and did turn down below net neutral (50) on today's decline, but I like the nearing PMO Crossover BUY Signal and rising Stochastics. Also working in its favor is relative strength which is rising for the group and OTTR against the SPY. The stop could be tighter if you wish. I've set it below support and the 200-day EMA at 5.9% or $73.33."
Here is today's chart:
The industry group lost its rising relative strength line. Overhead resistance was sturdy. The double bottom pattern hasn't fully busted yet and we could see a triple bottom develop, however, I wouldn't count on it given the voracity of the recent decline. The PMO also topped beneath the signal line. The RSI wasn't positive when this one was picked and we didn't have the PMO Crossover BUY Signal yet. The 20-day EMA was below the 50-day EMA. Those are the problems that could've led to the decline.
THIS WEEK's Performance:
DecisionPoint Sector Scoreboard (Mechanical Trend Model Signals):
Click Here to view Carl's annotated "Under the Hood" ChartList!
Sector to Watch: Technology (XLK)
None of the sectors have PMOs that are rising so picking a Sector to Watch was difficult. Technology was the only one with at least a little positive spin. We can see that participation is picking up a bit as far as %Stocks > 20EMA and a little bit for %Stocks > 50EMA. The Silver Cross Index has flattened, but until we see more participation, it likely won't turn back up. Price is bouncing above support at the 200-day EMA which is positive. My concern is that this won't be a lasting rally.
Industry Group to Watch: Semiconductors (SMH)
I noticed participation beginning to expand on Semis and the Silver Cross Index is flattening out. Stochastics are rising and relative strength is picking up. A few symbols I found were the obvious NVDA and ACMR.
Go to our Under the Hood ChartList on DecisionPoint.com to get an in-depth view of all the sectors. On StockCharts.com you can find the Industry Summary.
Good Luck & Good Trading!
- Erin
erin@decisionpoint.com
Full Disclosure: I'm 10% long, 2% short.
Watch the latest episode of the DecisionPoint Trading Room with Carl & Erin Swenlin on Mondays 3:00p EST!
Technical Analysis is a windsock, not a crystal ball. --Carl Swenlin
NOTE: The stocks reported herein are from mechanical trading model scans that are based upon moving average relationships, momentum and volume. DecisionPoint analysis is then applied to get selections from the scans. The selections given should prompt readers to do a chart review using their own analysis process. This letter is not a call for a specific action to buy, sell or short any of the stocks provided. There are NO sure things or guaranteed returns on the selection of "diamonds in the rough."
Helpful DecisionPoint Links:
DecisionPoint Shared ChartList and DecisionPoint Chart Gallery
Price Momentum Oscillator (PMO)
Swenlin Trading Oscillators (STO-B and STO-V)
(c) Copyright 2023 DecisionPoint.com