
Given my bearish outlook on the market, I wanted to create a scan that might catch 'dogs' before they've already run too low. The Diamond Dog Scan is good, but I wanted another. The Diamond Dog Scan is basically the inverse of the Diamond PMO Scan. I decided that one of my favorite bullish scans is the Momentum Sleepers Scan, so I developed a "Sleeping Dog" Scan that is the inverse. I liked the results better. So today I have two short positions and one long position as "Diamonds in the Rough".
Bullish scans are not producing so I want to start moving toward short positions. I think today's 'dogs' are destined to see lower prices in the short term. We'll see how the scan performs this week.
Good Luck & Good Trading,
Erin
Today's "Diamonds in the Rough": F (Short), SXI and YUMC (Short).
Runners-up: AEO, GMED, SIGI, CDNS (Short) and ZUMZ (Short).

RECORDING LINK (9/29/2023):
Topic: DecisionPoint Diamond Mine (9/29/2023) LIVE Trading Room
Passcode: Sept#29th
REGISTRATION for 10/6/2023:
When: Oct 6, 2023 09:00 AM Pacific Time (US and Canada)
Topic: DecisionPoint Diamond Mine (10/6/2023) LIVE Trading Room
Register in advance for this webinar HERE
After registering, you will receive a confirmation email containing information about joining the webinar.

Here is the last recording from 10/2:
Welcome to DecisionPoint Diamonds, wherein I highlight ten "Diamonds in the Rough" per week. These are selected from the results of my DecisionPoint Scans which search for stocks that could benefit from the trend and condition of the market. Remember, these are not recommendations to buy or sell, but are the most interesting of the stocks that surfaced in my scans. My objective is to save you the work of the initial, tedious culling process, but you need to apply your own analysis to see if these stocks pique your interest as well. There are no guaranteed winners here!
"Predefined Scans Triggered" are taken from StockCharts.com using the "Symbol Summary" option instead of a "SharpChart" on the workbench.
Stop levels are all rounded down.
Ford Motor Co. (F)
EARNINGS: 10/26/2023 (AMC)
Ford Motor Co. engages in the manufacture, distribution, and sale of automobiles. It operates through the following segments: Ford Blue, Ford Model E, and Ford Pro, Ford Next, and Ford Credit. The Ford Blue, Ford Model E, and Ford Pro segment includes the sale of Ford and Lincoln vehicles, service parts, and accessories, together with the associated costs to develop, manufacture, distribute, and service the vehicles, parts, and accessories. The Ford Next segment focuses on development costs for autonomous vehicles and related businesses, equity ownership in Argo AI, and other mobility businesses and investments. The Ford Credit segment is involved in the credit business on a consolidated basis, which is primarily vehicle-related financing and leasing activities. The company was founded by Henry Ford on June 16, 1903 and is headquartered in Dearborn, MI.
Predefined Scans Triggered: New CCI Sell Signals and P&F High Pole.
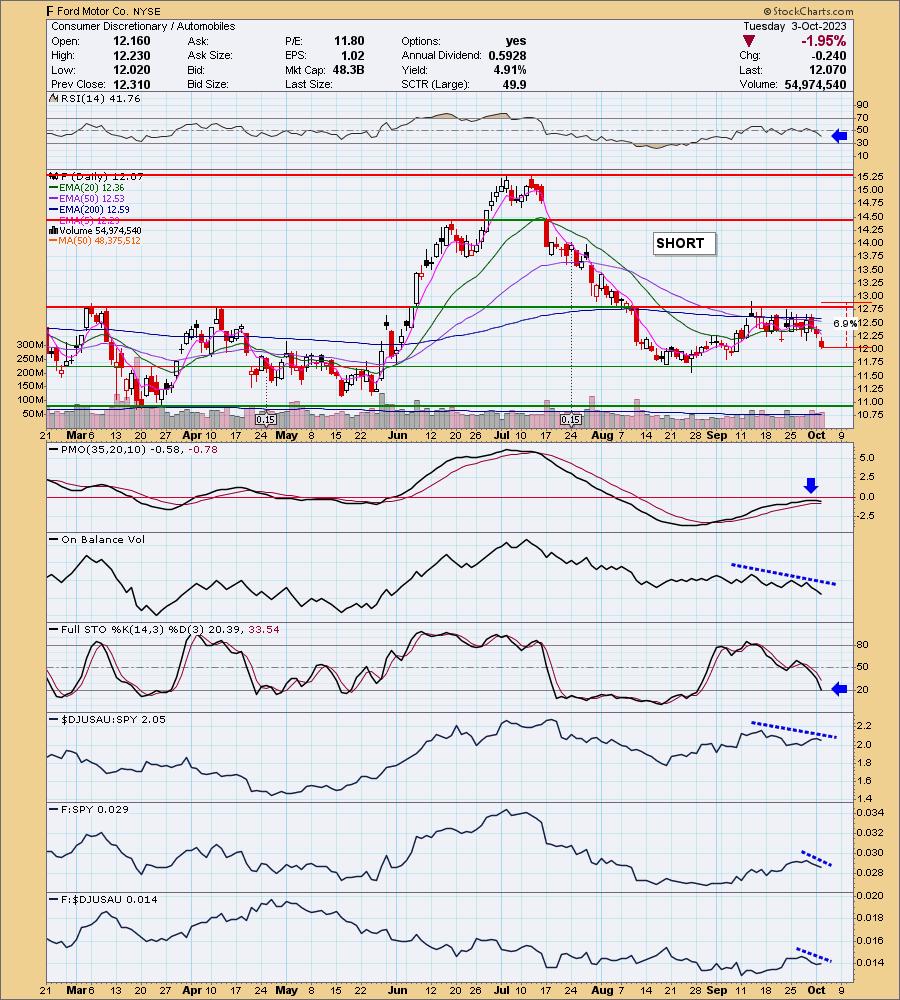
F is unchanged in after hours trading. Price just lost near-term support after failing to breakout. There was a recent "Death Cross" of the 50/200-day EMAs. The PMO is topping beneath the zero line and the RSI is negative and not oversold. The OBV is trending lower, confirming the new downtrend. Stochastics are in negative territory and falling. The group is not performing well against the SPY and Ford is underperforming both. I've set the upside stop at 6.9% or $12.90.
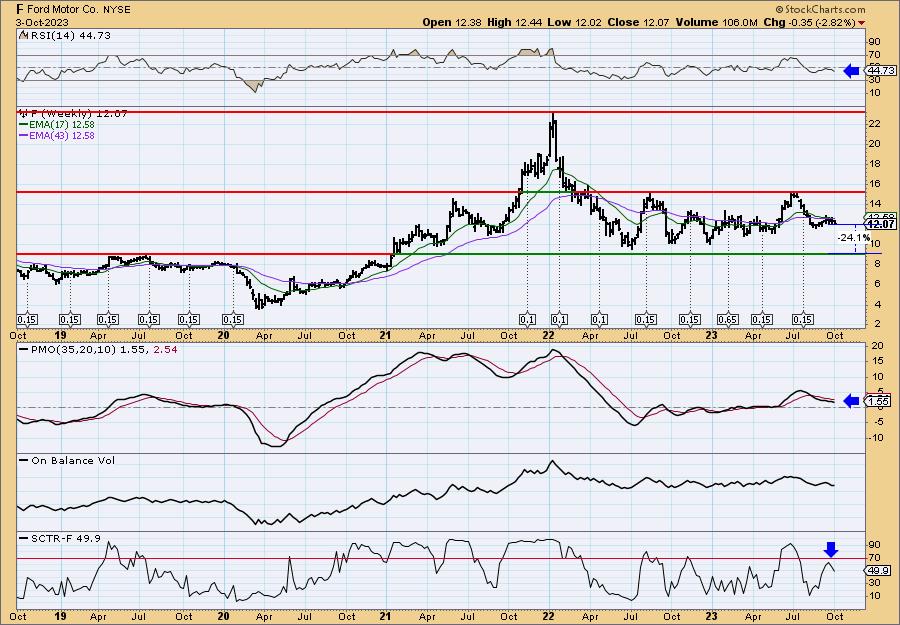
Ford has been stuck in a wide trading range since the end of 2022 and it appears ready to go back down to the low end of the range. The weekly RSI is negative and falling. The weekly PMO is on a Crossover SELL Signal and falling. If it makes it down to the next area of strong support, it would be an over 24% gain on this short.
*If a stock/ETF is in the "hot zone" above 70, it implies that it is stronger than 70% of its universe (large-, mid-, small-caps and ETFs) primarily in the intermediate to long terms.
Standex Intl Corp. (SXI)
EARNINGS: 11/02/2023 (AMC)
Standex International Corp. engages in the provision of products and services for commercial and industrial markets. It operates through the following segments: Electronics, Engraving, Scientific, Engineering Technologies, and Specialty Solutions. The Electronics segment is involved in the manufacturing and selling of electronic components for applications throughout the end-user market spectrum. The Engraving segment provides mold texturizing, slush molding tools, project management and design services, roll engraving, hygiene product tooling, low observation vents for stealth aircraft, and process machinery. The Scientific segment includes temperature-controlled equipment for the medical, scientific, pharmaceutical, biotech and industrial markets. The Engineering Technologies segment offers net and near net formed single-source customized solutions in the manufacture of engineered components for the aviation, aerospace, defense, energy, industrial, medical, marine, oil and gas, and manned and unmanned space markets. The Specialty Solutions segment refers to the manufacture and sale of refrigerated, heated and dry merchandizing display cases, custom fluid pump solutions, and single and double acting telescopic and piston rod hydraulic cylinders. The company was founded by John Bolten in 1955 and is headquartered in Salem, NH.
Predefined Scans Triggered: New CCI Buy Signals and P&F Double Top Breakout.
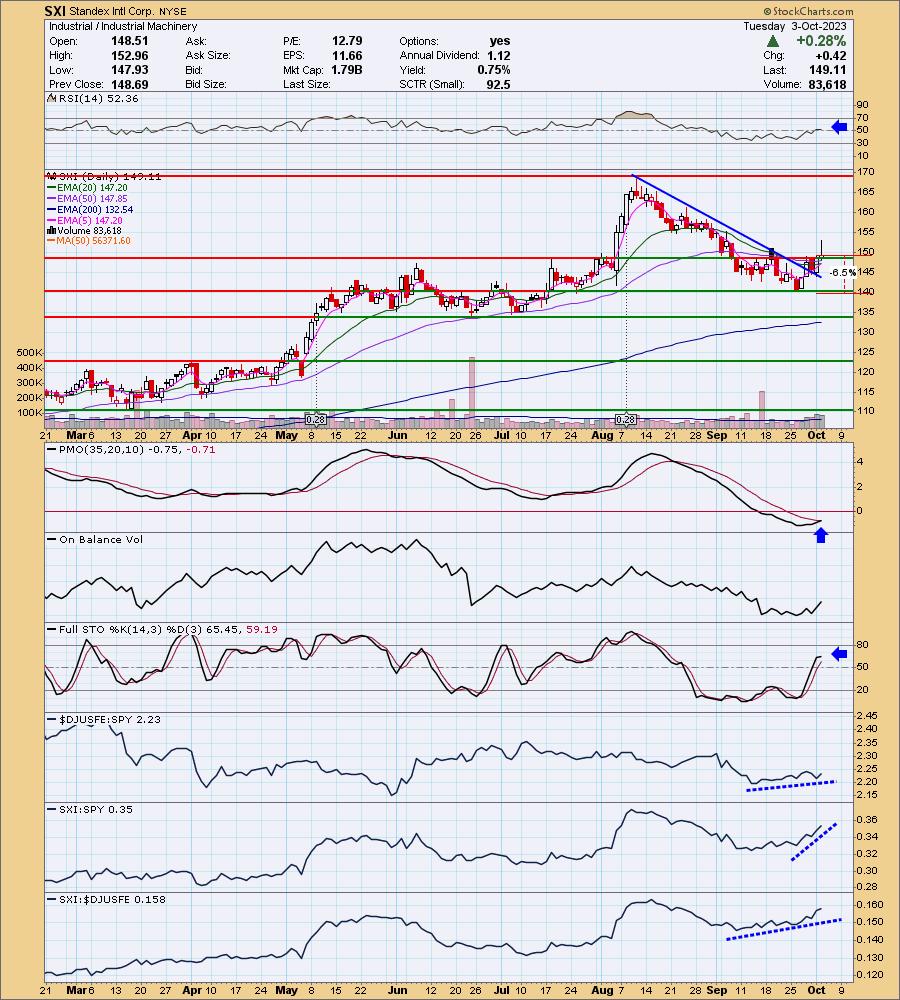
SXI is unchanged in after hours trading. I liked the rounded bottom on this price chart and the breakout from the declining trend. The RSI is now in positive territory and there is a new PMO Crossover BUY Signal on tap. Stochastics did pause today, but they are rising in positive territory. Relative strength studies are bullish for the group and SXI. I've set a 6.5% stop around $139.41.
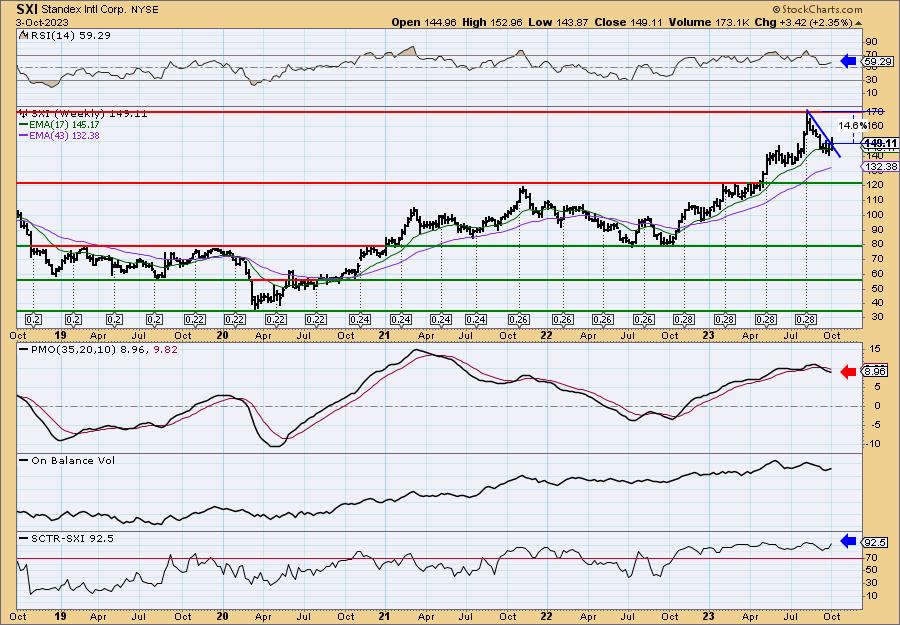
The weekly chart is okay. I would keep this one in the short-term timeframe. We can see the breakout in the making this week. The weekly RSI is positive and the SCTR is at the top of the hot zone. The weekly PMO is the problem. It has decelerated its decline somewhat, but ultimately is on a Crossover SELL Signal and in decline. If price can retrace to the prior high it would be an over 14% gain.
Yum China Holdings, Inc. (YUMC)
EARNINGS: 10/31/2023 (AMC)
Yum China Holdings, Inc. engages in the business of franchising and owning entities that own and operate restaurants. It operates through the following segments: Kentucky Fried Chicken (KFC), Pizza Hut, and All Other Segments. The KFC segment focuses on operating a restaurant chain. The Pizza Hut segment offers casual dining and home service. The All Other segment includes Taco Bell, Lavazza, Little Sheep, Huang Ji Huang, COFFii and JOY, East Dawning, and other e-commerce business. The company was founded in 1987 and is headquartered in Shanghai, China.
Predefined Scans Triggered: Moved Below Ichimoku Cloud, Parabolic SAR Sell Signals and Bearish MACD Crossovers.
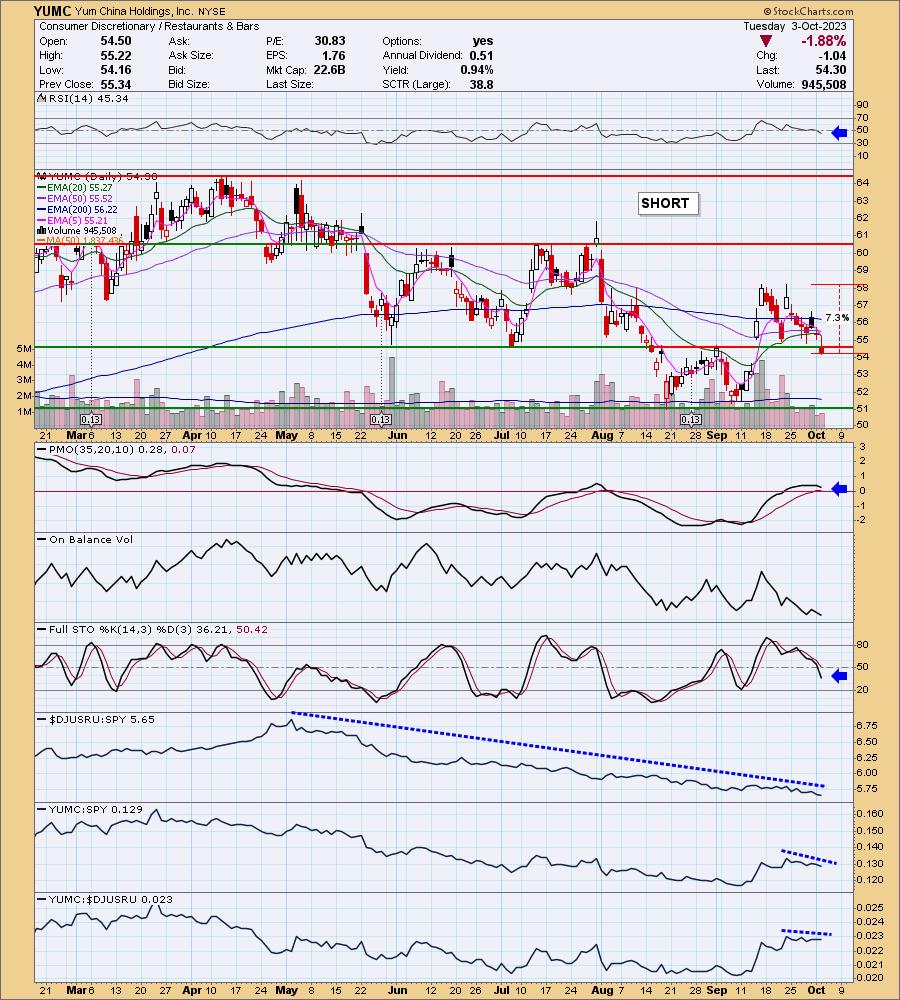
YUMC is down -0.31% in after hours trading. Today YUMC broke below strong support. The RSI has recently moved into negative territory. The PMO is arching over toward a Crossover SELL Signal. The OBV is in decline, confirming the current price decline. Stochastics are dropping in negative territory. The group has been struggling against the SPY for much of the year. YUMC is underperforming this group now and it is starting to underperform the SPY as well. I've set the upside stop level at 7.3% or $58.26. It could easily be tightened toward the 200-day EMA if you don't want it so high.
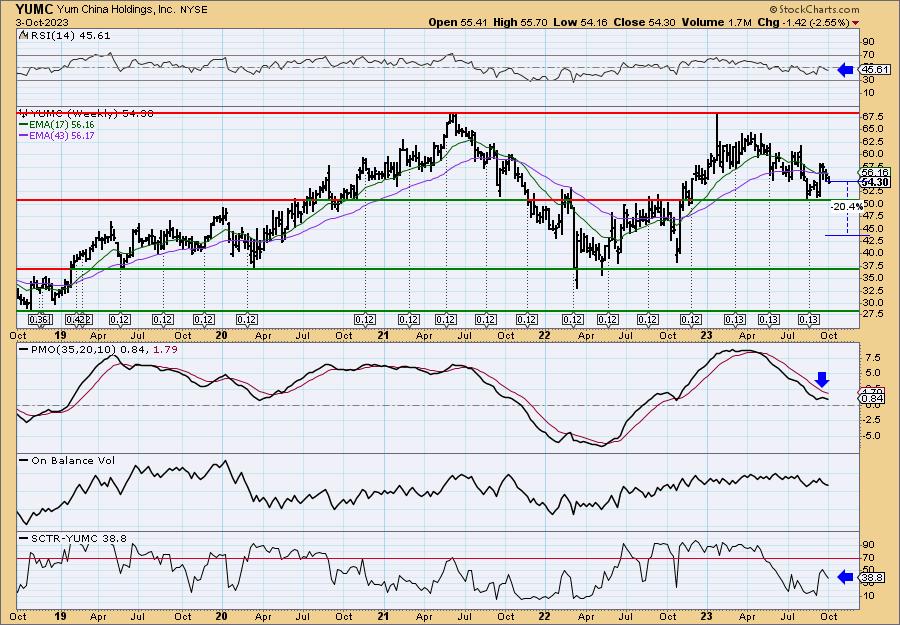
One issue I do see is that strong support is available at the 2023 low, but given the very bearish weekly indicators, I'm looking for a breakdown there. The weekly RSI is negative and the weekly PMO has very bearishly topped beneath the signal line. The SCTR turned lower before getting close to the hot zone. It is headed lower. I've annotated downside potential to about halfway down the prior trading range at 20.4%.
Don't forget, on Thursdays I look at reader-requested symbols, click HERE to send me an email. I read every email I receive and try to answer them all!
Current Market Outlook:
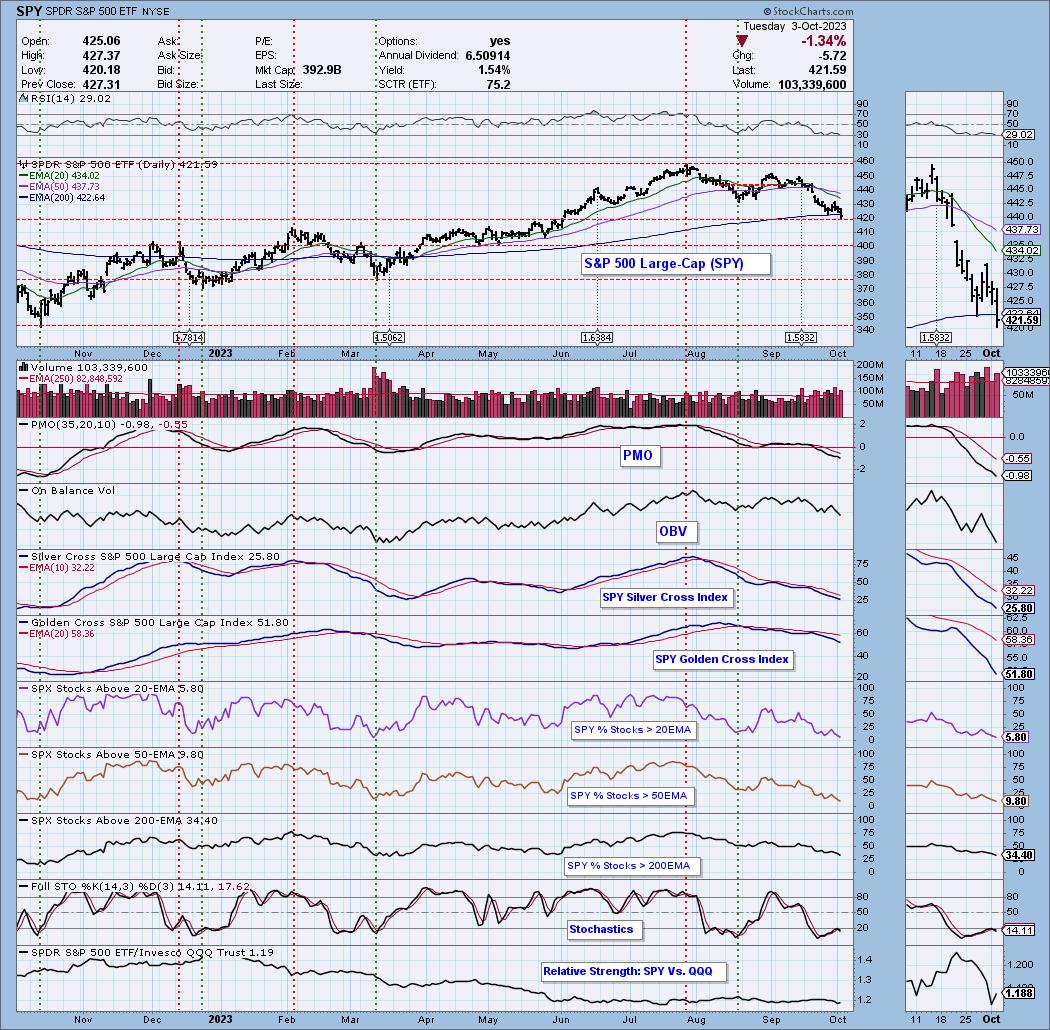
Market Environment: It is important to consider the odds for success by assessing the market tides. The following chart uses different methodologies for objectively showing the depth and trend of participation for intermediate- and long-term time frames.
- The Silver Cross Index (SCI) shows the percentage of SPX stocks on IT Trend Model BUY signals (20-EMA > 50-EMA)
- The Golden Cross Index (GCI) shows the percentage of SPX stocks on LT Trend Model BUY signals (50-EMA > 200-EMA)
Don't forget that as a "Diamonds" member, you have access to our GCI/SCI curated ChartList on DecisionPoint.com. You'll find it under "Members Only" links on the left side on the Blogs and Links Page.
Here is the current chart:
Full Disclosure: I am 10% long, 2% short. Thinking I might go ahead and short Ford.
I'm required to disclose if I currently own a stock I mention and/or may buy/short it within the next 72 hours.
"Technical Analysis is a windsock, not a crystal ball." - Carl Swenlin
(c) Copyright 2023 DecisionPoint.com
Watch the latest episode of DecisionPoint Trading Room with Carl & Erin Swenlin on Mondays 3:00p EST or on the DecisionPoint playlist on the StockCharts TV YouTube channel here!
NOTE: The stocks reported herein are from mechanical trading model scans that are based upon moving average relationships, momentum and volume. DecisionPoint analysis is then applied to get five selections from the scans. The selections given should prompt readers to do a chart review using their own analysis process. This letter is not a call for a specific action to buy, sell or short any of the stocks provided. There are NO sure things or guaranteed returns on the daily selection of "Diamonds in the Rough."
Regarding BUY/SELL Signals: The signal status reported herein is based upon mechanical trading model signals and crossovers. They define the implied bias of the price index/stock based upon moving average relationships and momentum, but they do not necessarily call for a specific action. They are information flags that should prompt chart review. Further, they do not call for continuous buying or selling during the life of the signal. For example, a BUY signal will probably (but not necessarily) return the best results if action is taken soon after the signal is generated. Additional opportunities for buying may be found as price zigzags higher, but the trader must look for optimum entry points. Conversely, exit points to preserve gains (or minimize losses) may be evident before the model mechanically closes the signal.
Helpful DecisionPoint Links:
Price Momentum Oscillator (PMO)
Swenlin Trading Oscillators (STO-B and STO-V)
For more links, go to DecisionPoint.com