
Thank you to everyone who supplied symbol requests for today's Reader Request Day. It wasn't too difficult to pick three from the bunch. You can tell the market is clicking again when scans and readers produce lots of symbols.
I am still applying caution to my trading. I did expand my exposure to 30%, rolled over some Bonds and pared my short exposure down to 5%. I think we can expand our portfolios further in the short term, but it won't be an add it and forget it. I don't think we are completely out of the woods. Fundamentals and bubbles that have weighed heavy on the market haven't gone away. Be sure to use stops on all of your positions and consider setting upside targets and adhering to them.
Good Luck & Good Trading,
Erin
Today's "Diamonds in the Rough": CCJ, SOFI and SPOT.

RECORDING LINK (10/27/2023):
Topic: DecisionPoint Diamond Mine (10/27/2023) LIVE Trading Room
Passcode: October#27
REGISTRATION for 11/3/2023:
When: Nov 3, 2023 09:00 AM Pacific Time (US and Canada)
Topic: DecisionPoint Diamond Mine (11-3-2023) LIVE Trading Room
Register in advance for this webinar HERE
After registering, you will receive a confirmation email containing information about joining the webinar.

Here is the last recording from 10/30:
Welcome to DecisionPoint Diamonds, wherein I highlight ten "Diamonds in the Rough" per week. These are selected from the results of my DecisionPoint Scans which search for stocks that could benefit from the trend and condition of the market. Remember, these are not recommendations to buy or sell, but are the most interesting of the stocks that surfaced in my scans. My objective is to save you the work of the initial, tedious culling process, but you need to apply your own analysis to see if these stocks pique your interest as well. There are no guaranteed winners here!
"Predefined Scans Triggered" are taken from StockCharts.com using the "Symbol Summary" option instead of a "SharpChart" on the workbench.
Stop levels are all rounded down.
Cameco Corp. (CCJ)
EARNINGS: 02/08/2024 (BMO)
Cameco Corp. engages in the provision of uranium. It operates through the Uranium and Fuel Services segments. The Uranium segment is involved in the exploration for, mining, milling, purchase, and sale of uranium concentrate. The Fuel Services segment deals with the refining, conversion, and fabrication of uranium concentrate and the purchase and sale of conversion services. The company was founded in 1988 and is headquartered in Saskatoon, Canada.
Predefined Scans Triggered: Moved Above Upper Keltner Channel, New 52-week Highs, Stocks in a New Uptrend (Aroon), Moved Above Upper Price Channel, P&F Ascending Triple Top Breakout and P&F Double Top Breakout.
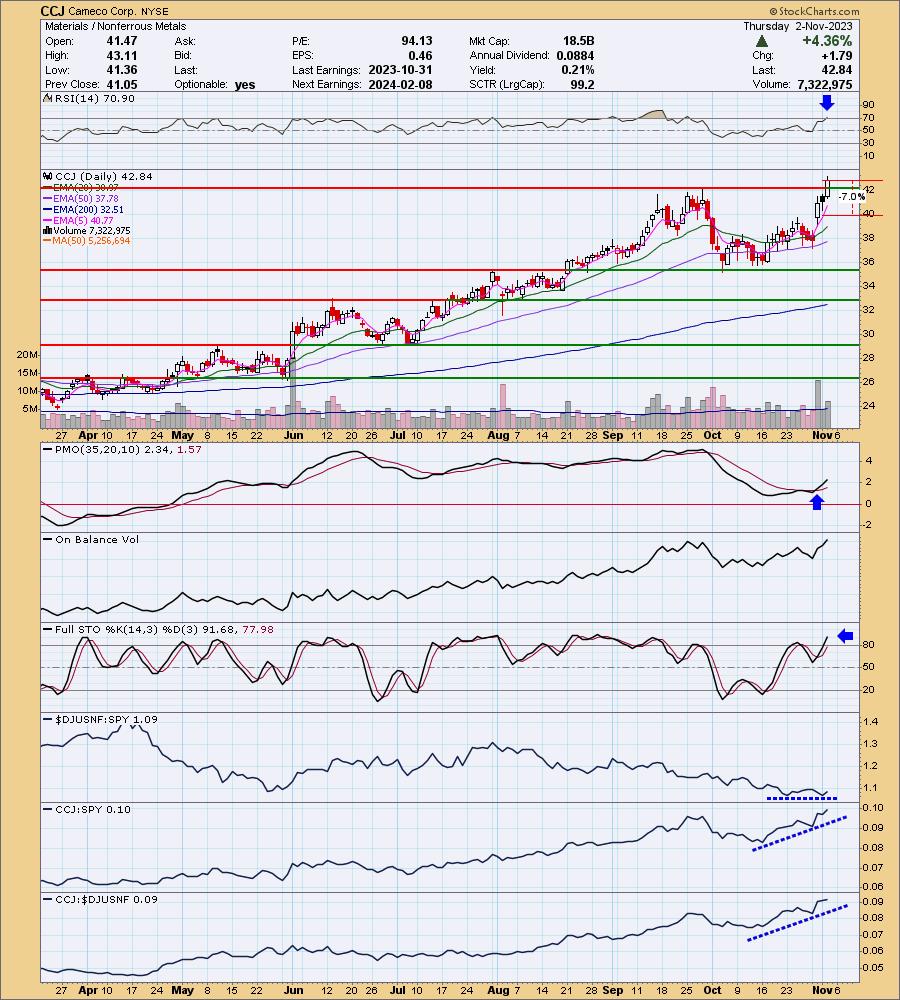
CCJ is up +0.02% in after hours trading. Today saw a strong breakout rally. This did put the RSI into overbought territory so it is vulnerable to a pullback. The technicals suggest that would be temporary. The PMO is rising strongly on a Crossover BUY Signal. Stochastics just moved above 80. While the group is only performing in line with the SPY, CCJ is outperforming both the group and SPY. I set the stop arbitrarily at 7% around $39.84.
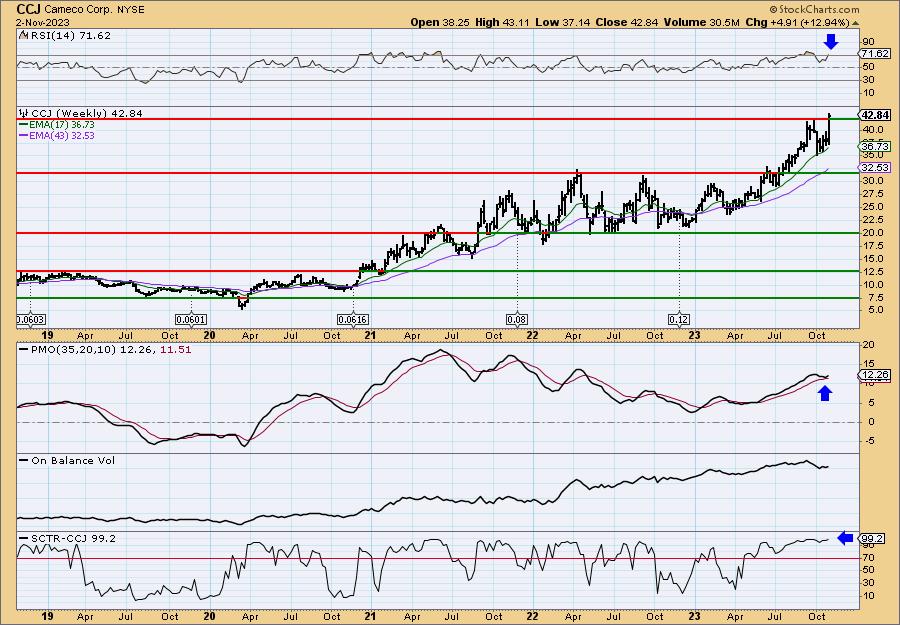
This is a great breakout to new 52-week highs. The weekly RSI is slightly overbought, but it can hold that if the rally continues as I believe it will. The best sign is the weekly PMO surging above the signal line. The StockCharts Technical Rank (SCTR) is at the top of the hot zone* above 70. Consider an upside target of about 17% to $50.12.
*If a stock is in the "hot zone" above 70, it implies that it is stronger than 70% of its universe (large-, mid-, small-caps and ETFs) primarily in the intermediate to long terms.
SoFi Technologies, Inc. (SOFI)
EARNINGS: 01/29/2024 (BMO)
SoFi Technologies, Inc. is a financial service platform, which engages in the provision of student loan refinancing options to the private student loan market. It offers home loans, personal loans, and credit cards. It operates through the following segments: Lending, Technology Platform, and Financial Services. The Lending segment includes personal loan, student loan, home loan products, and related servicing activities. The Technology Platform segment focuses on technology products and solutions revenue. The Financial Services segment includes the SoFi Money product, SoFi Invest product, SoFi Credit Card product, SoFi Relay personal finance management product, and other financial services such as lead generation and content for other financial services institutions. The company was founded in 2011 and is headquartered in San Francisco, CA.
Predefined Scans Triggered: P&F Double Bottom Breakdown, P&F Bullish Signal Reversal, Bullish MACD Crossovers and Parabolic SAR Buy Signals.
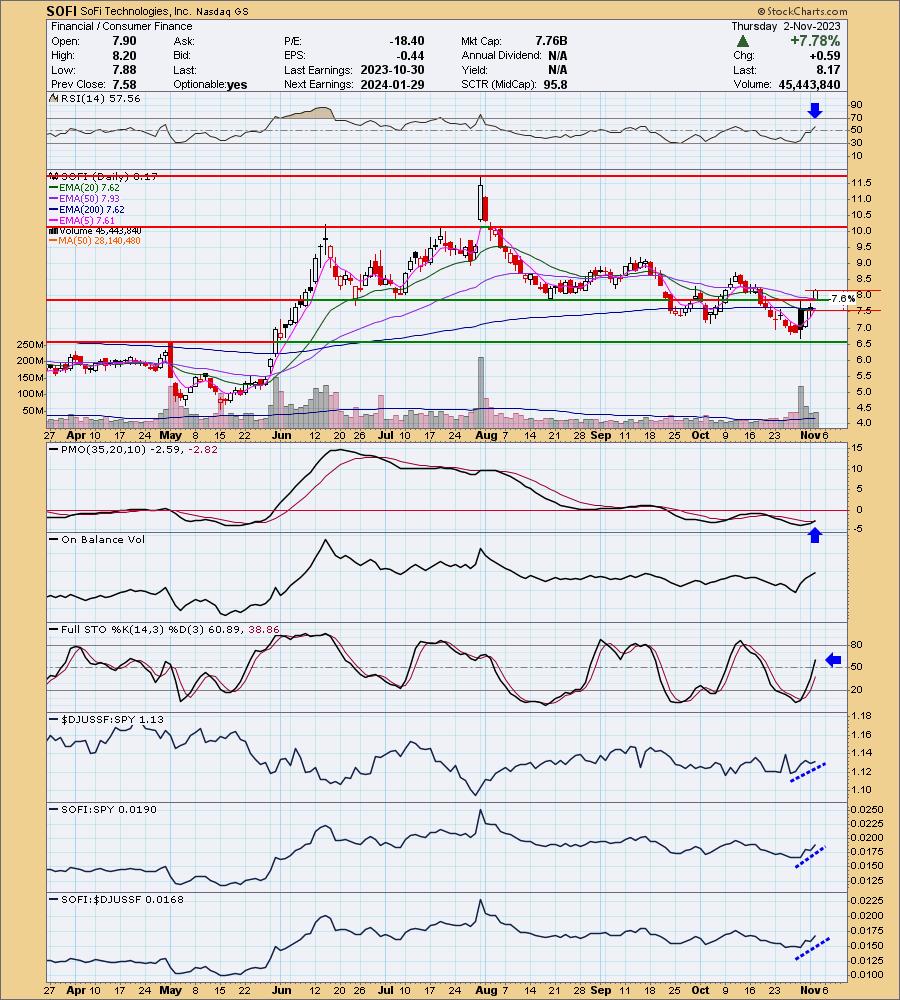
SOFI is down -0.73% in after hours trading. Today saw a gap up rally that pushed price above resistance at the June/July/August lows as well as the 50-day EMA. The RSI is now in positive territory and there is a new PMO Crossover BUY Signal. Volume is coming in. Stochastics are rising in positive territory which implies more upside ahead. Relative strength is rising for the group and SOFI. SOFI is beginning to show leadership amongst its group. The stop is set at 7.6% or $7.54. It was a big day today so I do think we will see a pullback tomorrow. We just want it to stay above support.
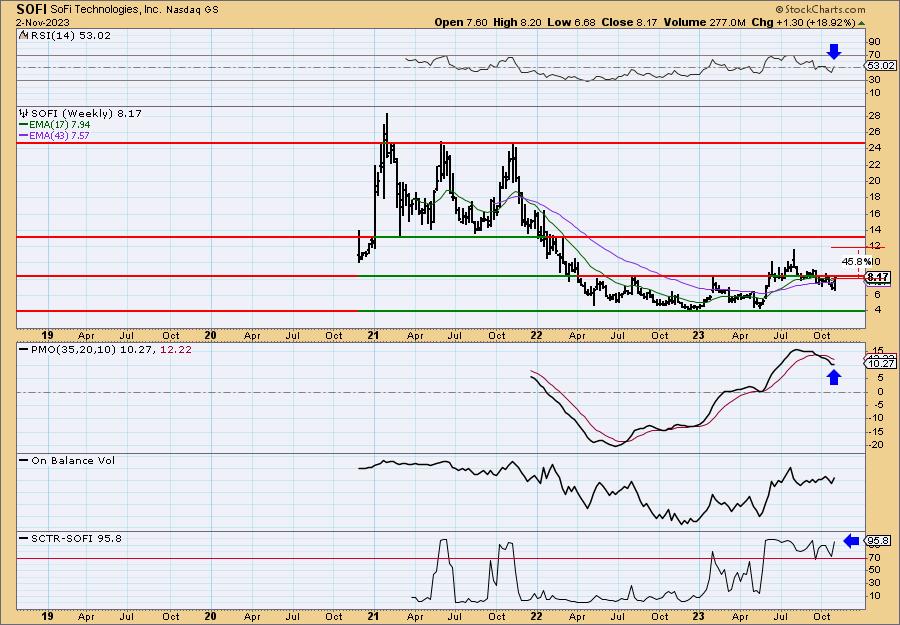
The weekly chart is favorable. The price pattern, a declining trend, is the only thing that keeps it in the short-term timeframe. Other than that, the weekly RSI has moved back above net neutral (50). The weekly PMO is turning back up and the SCTR is at the top of the hot zone. If it can recapture its 2023 high, it would be quite lucrative.
Spotify Technology S.A. (SPOT)
EARNINGS: 01/30/2024 (BMO)
Spotify Technology SA is a digital music service offering music fans instant access to a world of music. It operates through the Premium and Ad-Supported segments. The Premium segment provides subscribers with unlimited online and offline high-quality streaming access of music and podcasts on computers, tablets, and mobile devices. Users can connect through speakers, receivers, televisions, cars, game consoles, and smart watches. It also offers a music listening experience without commercial breaks. The Ad-Supported segment provides users with limited on-demand online access of music and unlimited online access of podcasts on their computers, tablets, and compatible mobile devices. It also serves both a premium subscriber acquisition channel and a robust option for users who are unable or unwilling to pay a monthly subscription fee but still want to enjoy access to a wide variety of high-quality audio content. The company was founded by Daniel Ek and Martin Lorentzon in April 2006 and is headquartered in Luxembourg.
Predefined Scans Triggered: None.
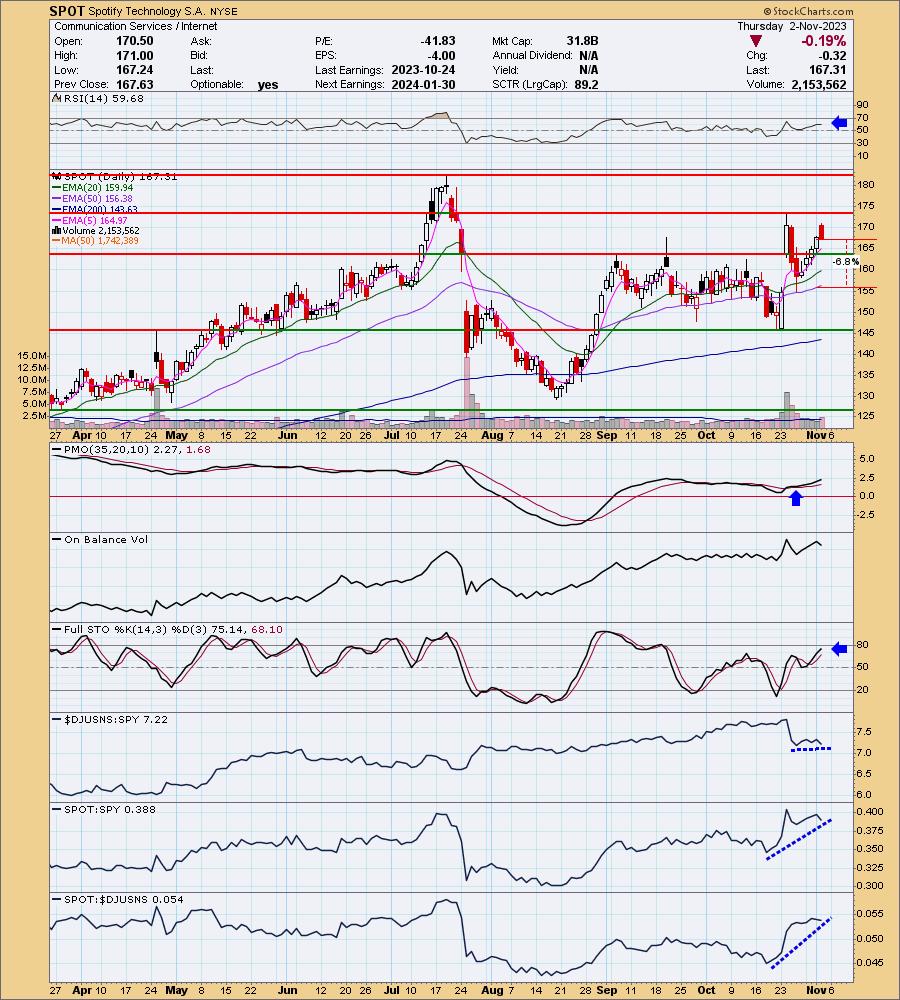
SPOT is down -0.19% in after hours trading. Today's candlestick is bearish, but price did set a higher low and higher high. It is getting up toward overhead resistance so this isn't the strongest of the three. It still has merit given the positive indicators. The RSI is in positive territory and the PMO is rising on a BUY Signal. Stochastics are still rising despite today's decline. The group is performing in line with the SPY which is acceptable. Strength has cooled a bit, but SPOT is still traveling in line with both the group and SPY. The stop is set below the 50-day EMA at 6.8% or $155.93.
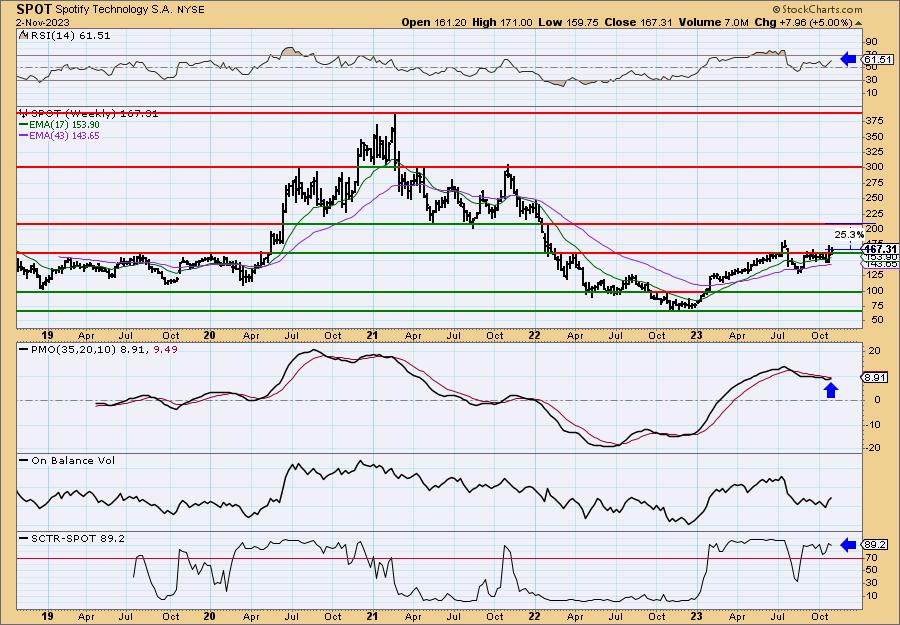
The weekly chart suggests this one could be considered for the intermediate term given the rising trend, price above support, the positive and rising RSI as well as a weekly PMO that has turned back up. The SCTR is also near the top of the hot zone. In any case, I would continue to keep all of your trades short-term.
Don't forget, on Thursdays I look at reader-requested symbols, click HERE to send me an email. I read every email I receive and try to answer them all!
Current Market Outlook:
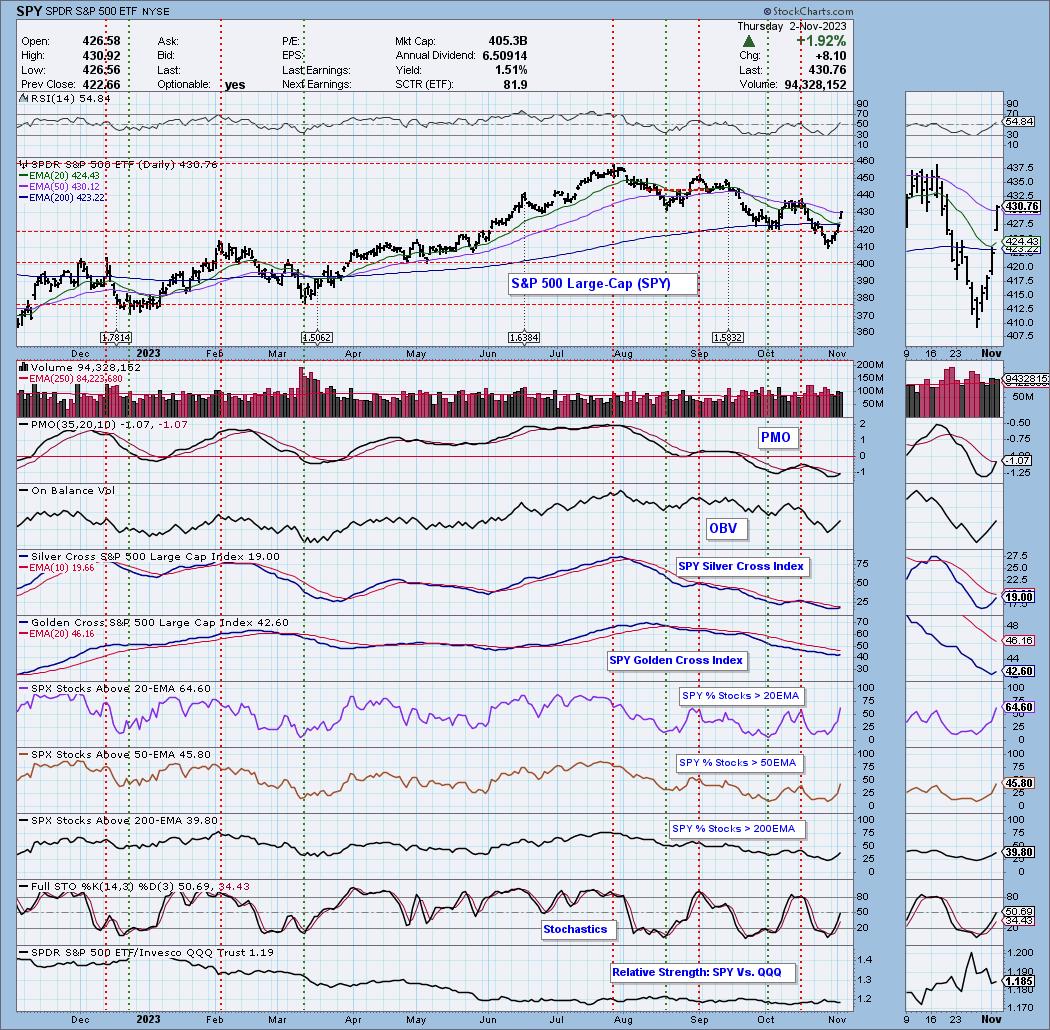
Market Environment: It is important to consider the odds for success by assessing the market tides. The following chart uses different methodologies for objectively showing the depth and trend of participation for intermediate- and long-term time frames.
- The Silver Cross Index (SCI) shows the percentage of SPX stocks on IT Trend Model BUY signals (20-EMA > 50-EMA)
- The Golden Cross Index (GCI) shows the percentage of SPX stocks on LT Trend Model BUY signals (50-EMA > 200-EMA)
Don't forget that as a "Diamonds" member, you have access to our GCI/SCI curated ChartList on DecisionPoint.com. You'll find it under "Members Only" links on the left side on the Blogs and Links Page.
Here is the current chart:
Full Disclosure: I am 30% long, 5% short.
I'm required to disclose if I currently own a stock I mention and/or may buy/short it within the next 72 hours.
"Technical Analysis is a windsock, not a crystal ball." - Carl Swenlin
(c) Copyright 2023 DecisionPoint.com
Watch the latest episode of DecisionPoint Trading Room with Carl & Erin Swenlin on Mondays 3:00p EST or on the DecisionPoint playlist on the StockCharts TV YouTube channel here!
NOTE: The stocks reported herein are from mechanical trading model scans that are based upon moving average relationships, momentum and volume. DecisionPoint analysis is then applied to get five selections from the scans. The selections given should prompt readers to do a chart review using their own analysis process. This letter is not a call for a specific action to buy, sell or short any of the stocks provided. There are NO sure things or guaranteed returns on the daily selection of "Diamonds in the Rough."
Regarding BUY/SELL Signals: The signal status reported herein is based upon mechanical trading model signals and crossovers. They define the implied bias of the price index/stock based upon moving average relationships and momentum, but they do not necessarily call for a specific action. They are information flags that should prompt chart review. Further, they do not call for continuous buying or selling during the life of the signal. For example, a BUY signal will probably (but not necessarily) return the best results if action is taken soon after the signal is generated. Additional opportunities for buying may be found as price zigzags higher, but the trader must look for optimum entry points. Conversely, exit points to preserve gains (or minimize losses) may be evident before the model mechanically closes the signal.
Helpful DecisionPoint Links:
Price Momentum Oscillator (PMO)
Swenlin Trading Oscillators (STO-B and STO-V)
For more links, go to DecisionPoint.com