
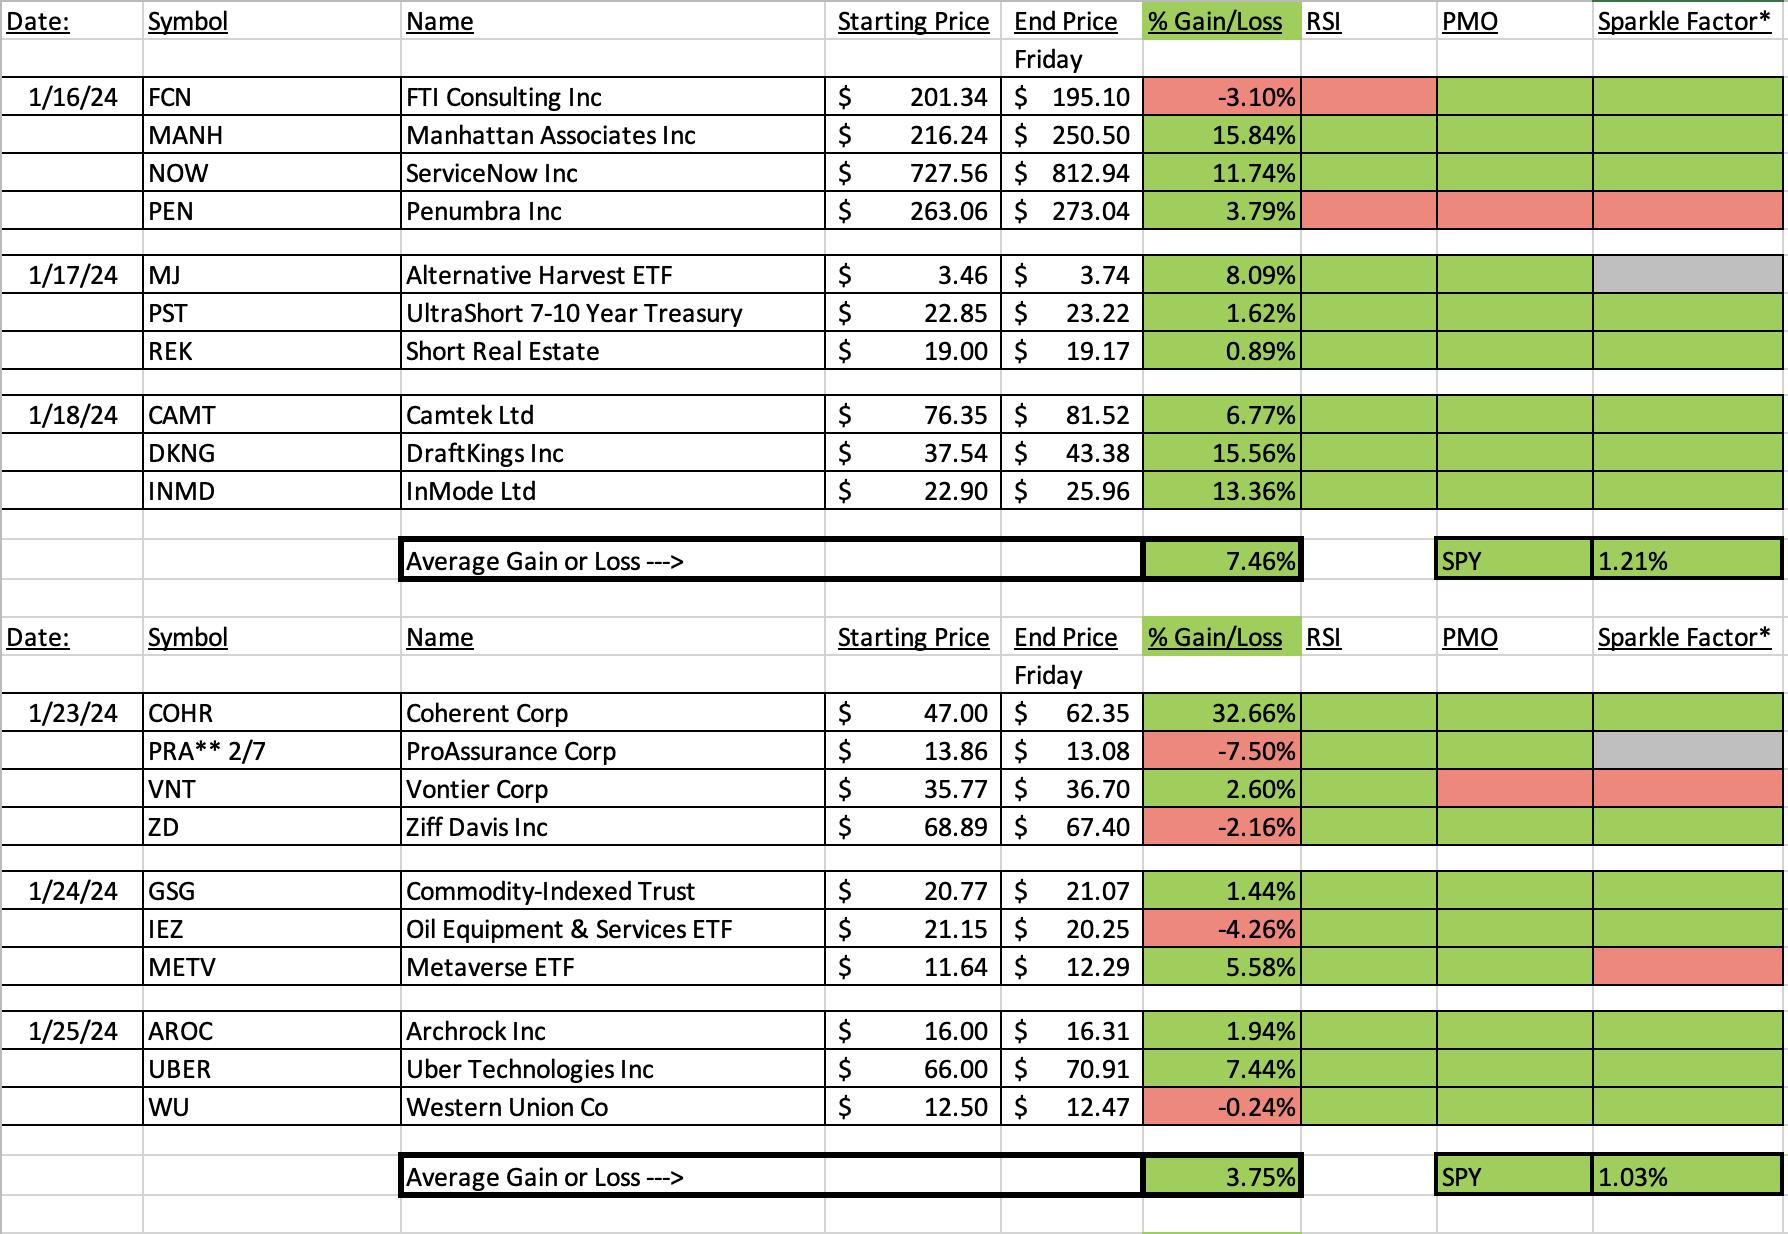
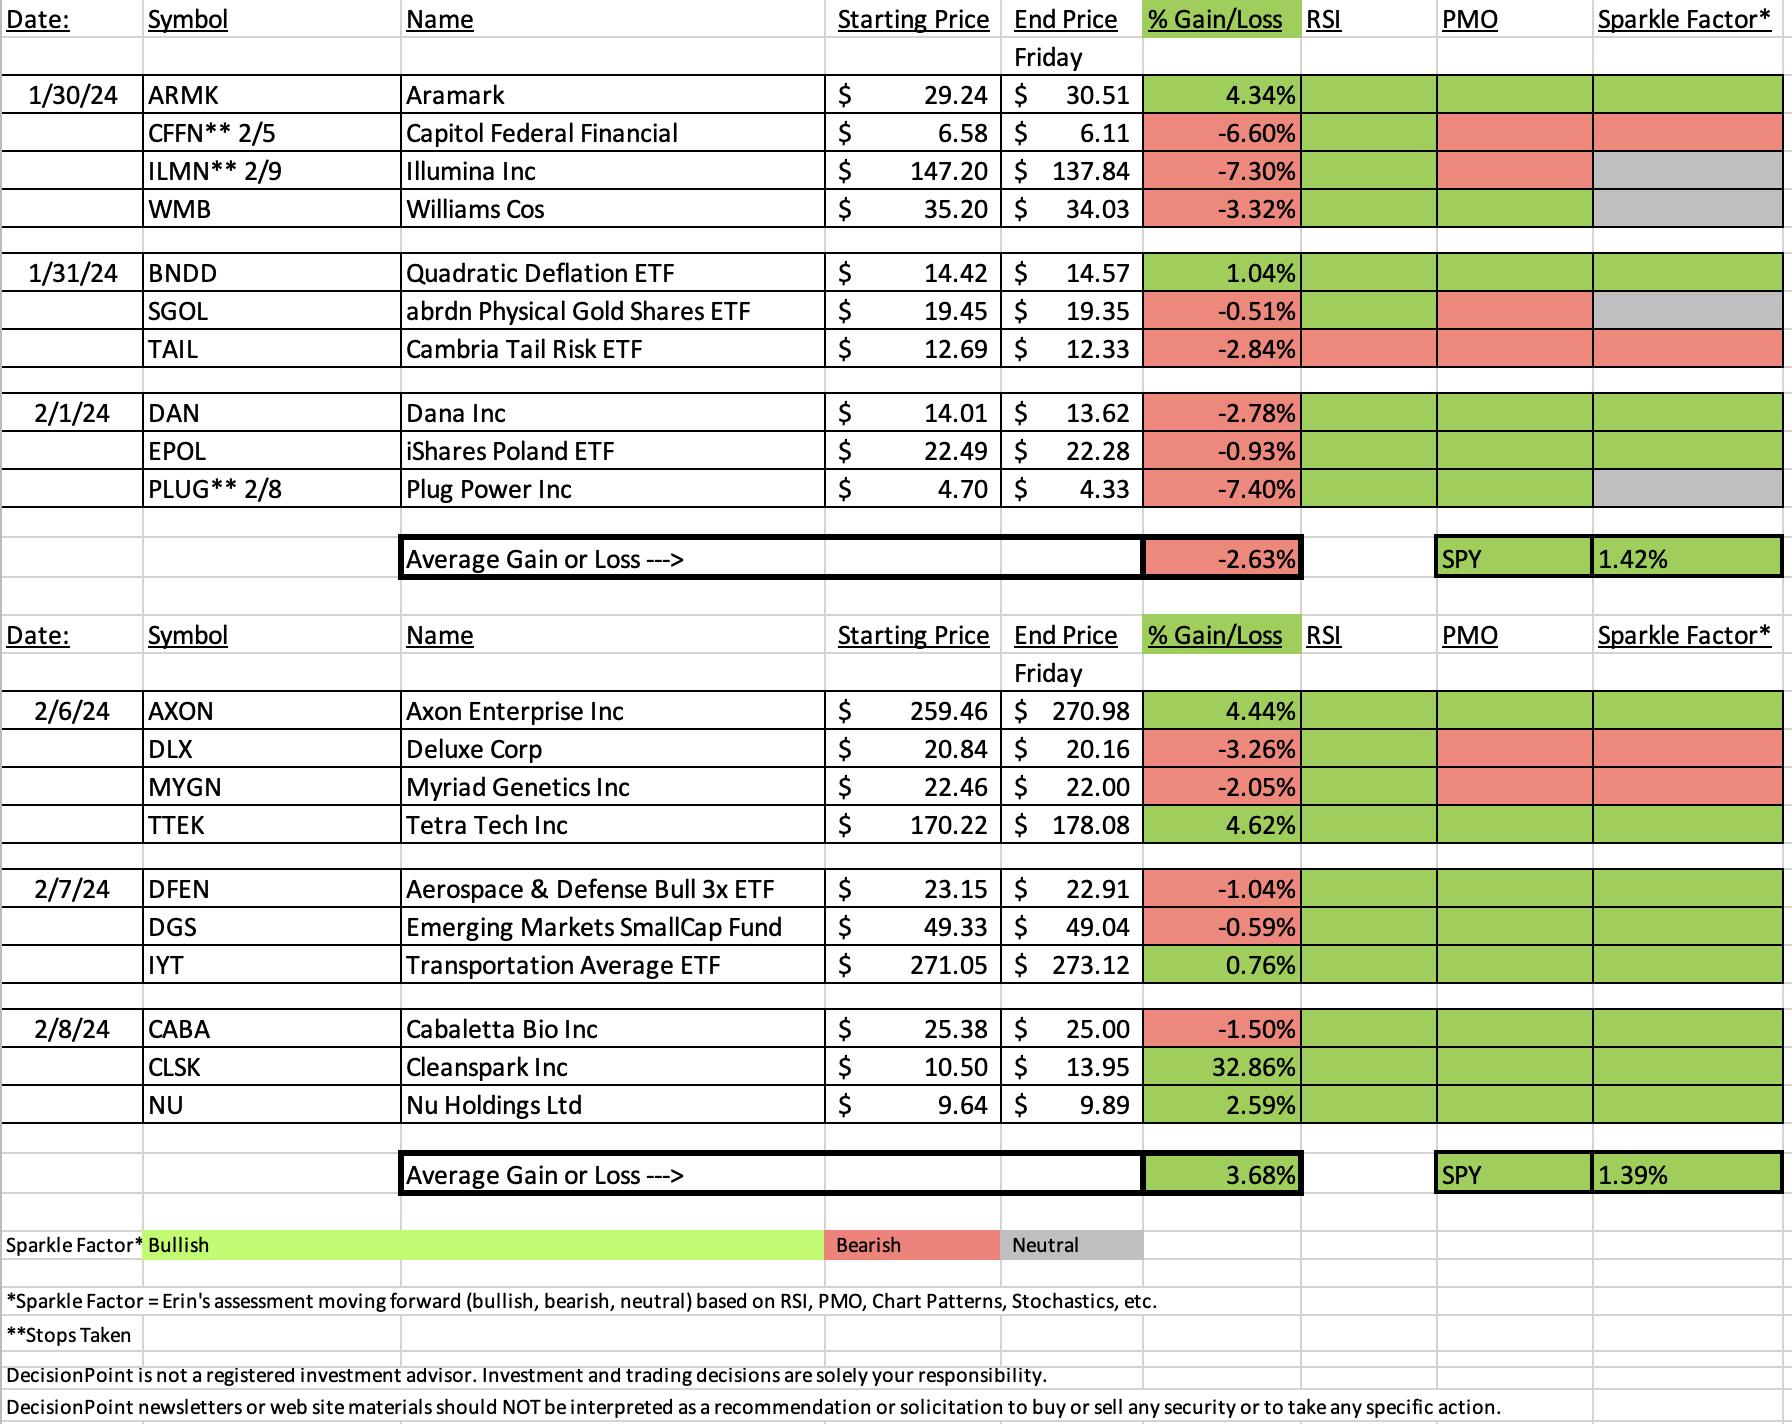
With the exception of two stocks, I like what "Diamonds in the Rough" did this week. All but those two have green Sparkle Factors moving forward which means they are still considered buying opportunities.
One that may be hard to buy into is this week's "Darling" which was up 32.86% today. We'll dive in to the chart later to determine whether it is ripe for entry still.
The "Dud" this week was from the Financial Administration industry group and I believe that may've worked against it this week. The other Dud this week was a Biotech. That group appeared to be getting better, but relative strength failed.
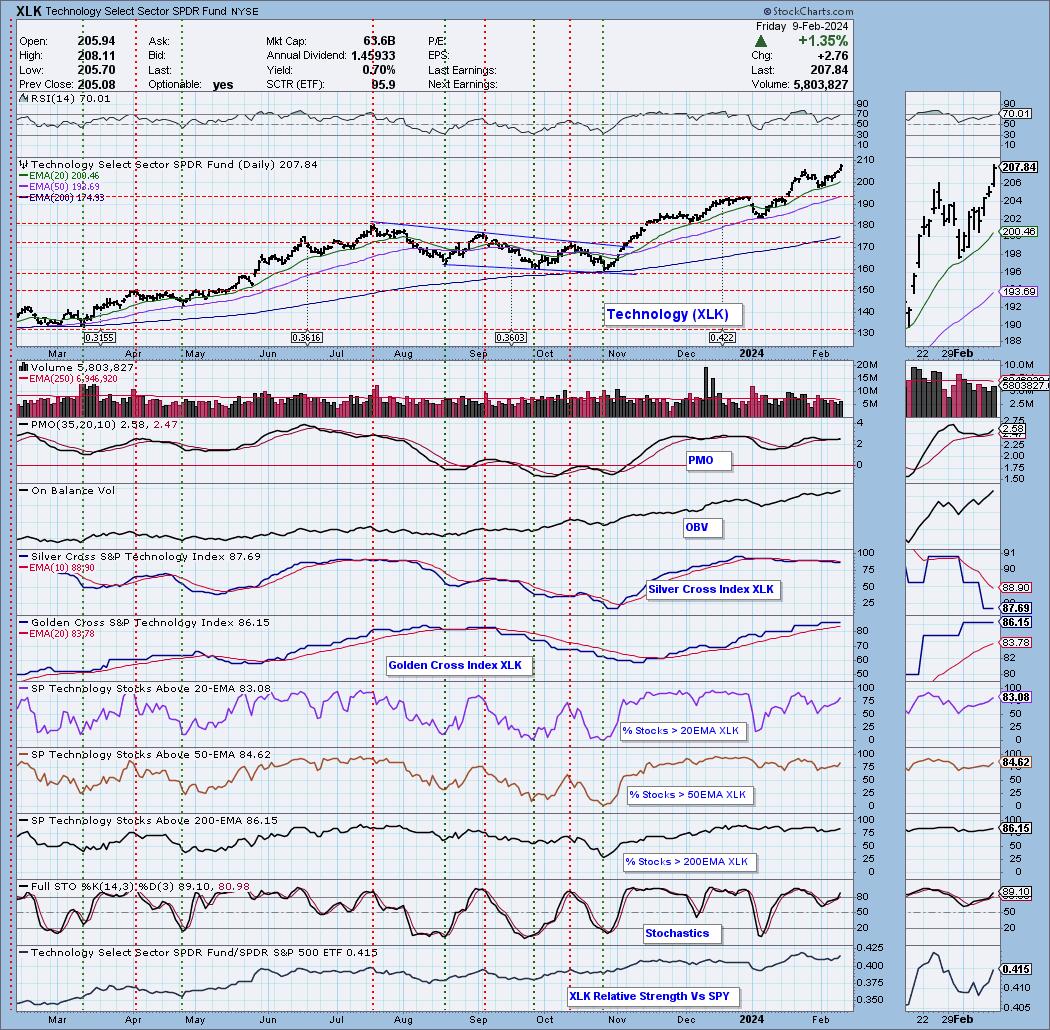
I decided to change the Sector to Watch from Consumer Discretionary (XLY), which I picked this morning, to Technology (XLK). XLY's Silver Cross Index dropped beneath its signal line and I didn't see the expansion in participation that I wanted after the close.
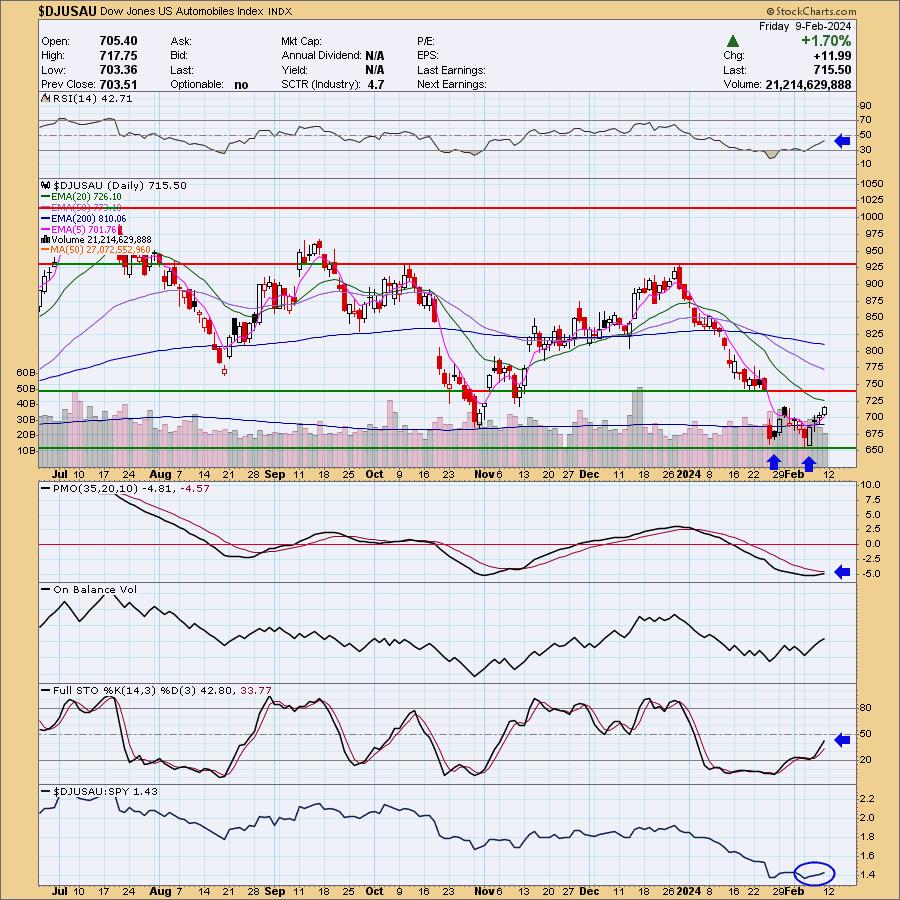
I am keeping the Industry Group to Watch as Autos which is part of XLY. That was selected this morning and I liked the stocks that came from the group.
I ran the Momentum Sleepers Scan this morning and found some interesting symbols within: AMPH (I own it), COHU (I own it), REX and YETI.
You'll notice that I own a few of the symbols. I had divested in preparation for earnings and was able to expand my portfolio today using symbols we uncovered this morning among others. Now let's hope the market continues along its rally path longer.
Have a great weekend!
Good Luck & Good Trading,
Erin

RECORDING & DOWNLOAD LINK (2/9/2024):
Topic: DecisionPoint Diamond Mine (2/9/2024) LIVE Trading Room
Recording & Download Link HERE
Passcode: February#9
REGISTRATION for 2/16/2024:
When: Feb 16, 2024 09:00 AM Pacific Time (US and Canada)
Topic: DecisionPoint Diamond Mine (2/16/2024) LIVE Trading Room
Register in advance for this webinar HERE
After registering, you will receive a confirmation email containing information about joining the webinar.

Below is the latest free DecisionPoint Trading Room recording. You'll find these recordings posted on Mondays to our DP YouTube Channel. Be sure and subscribe HERE.
A few items about the spreadsheet: I've put on the spreadsheet whether the RSI is positive (green) or negative (red). The PMO column tells you if it is rising (green) or falling (red). Finally I've added my own "Sparkle Factor" that gives you my assessment going forward, bullish (green), bearish (red) or neutral (gray). The Sparkle Factor is basically my thoughts on whether I expect it to rise or fall. A neutral means it could really go either way so it could be added to a watch list. If you're in a stock I consider "neutral" going forward, the ball is in your court.
Darling:
CleanSpark, Inc. (CLSK)
EARNINGS: 02/08/2024 (AMC) ** Reported Yesterday **
CleanSpark, Inc. is a bitcoin mining technology company, which engages in the management of data centers. Its operations include College Park, Norcross, Washington, Sandersville, Dalton, and Massena. The company was founded by S. Matthew Schultz and Bryan Huber on October 15, 1987 and is headquartered in Henderson, NV.
Predefined Scans Triggered: New CCI Buy Signals, Moved Above Upper Bollinger Band and P&F Low Pole.
Below are the commentary and chart from yesterday, 2/8/2024:
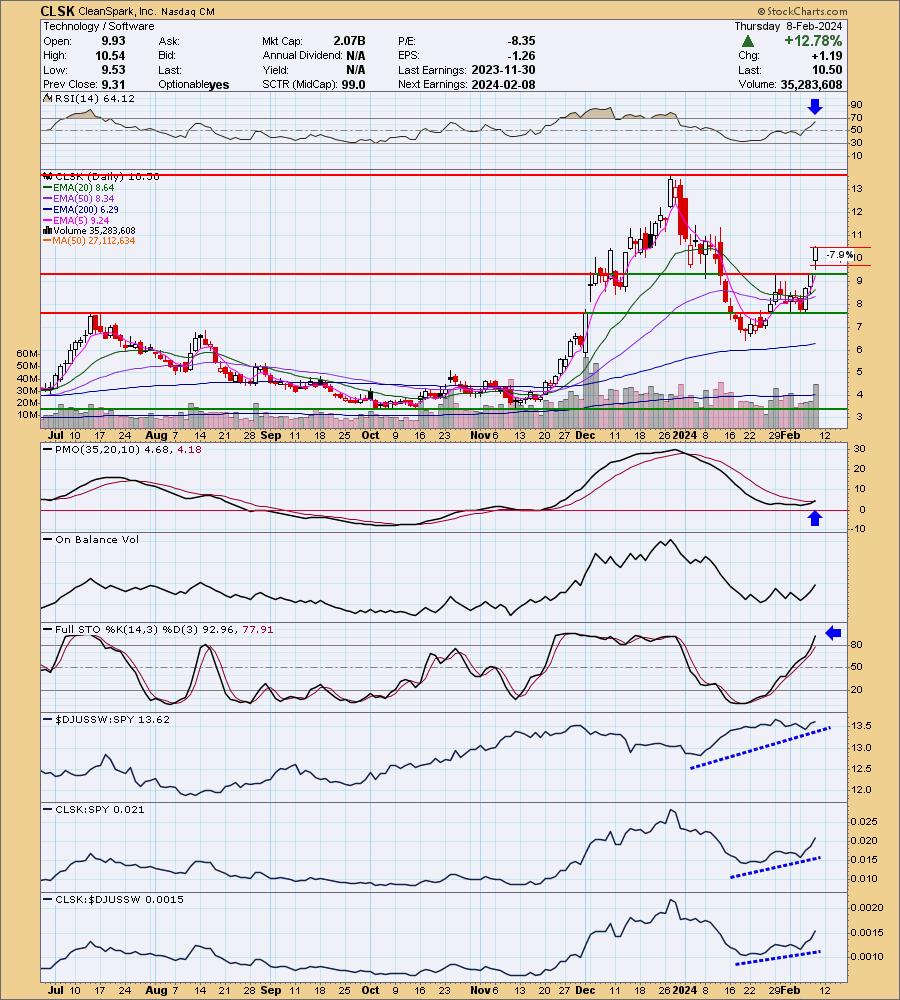
"CLSK is up +8.76% in after hours trading so I suspect it will gap up again tomorrow after reporting earnings after the close today. It had an incredible push above overhead resistance and seems ready to go test the prior top. This is clearly a "Boom or Bust" stock. That next level of overhead resistance is over 30% away. The RSI is amazingly not overbought right now. Today saw a new PMO Crossover BUY Signal. Stochastics are well above 80 and still rising. The industry group is doing well as is the stock against the SPY and the group. The stop is set as deeply as I was able at 7.9% or $9.67. Position size wisely on this low-priced stock." (I own CLSK)
Here is today's chart:
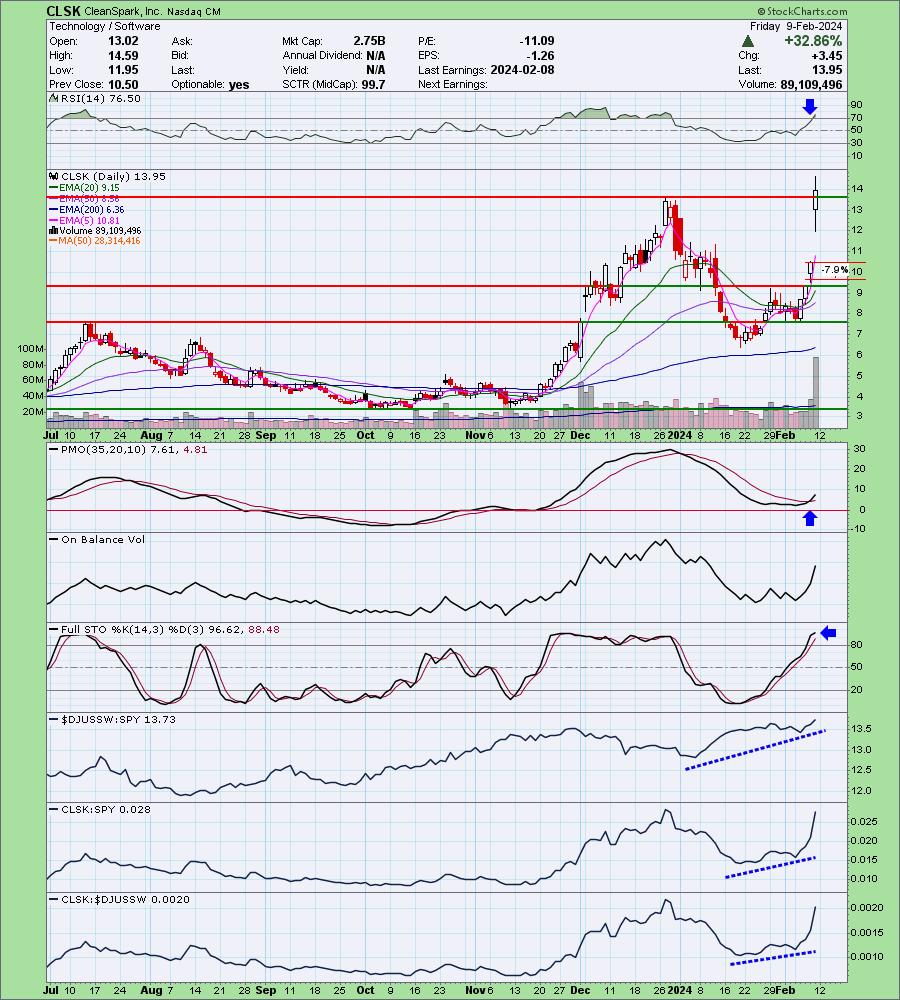
I knew things were looking interesting when I saw the max trading going on after the close. I expected this one to make its way to overhead resistance, not overcome it particularly in one day. This was a great big boom and I expect we will continue to see some upside on this one. It is clearly parabolic so consider a trailing stop of about 8% to protect any gains you have or might get.
Don't forget, on Thursdays I look at reader-requested symbols, so shoot me an email at erin@decisionpoint.com. I read every email I receive and try to answer them all!
Dud:
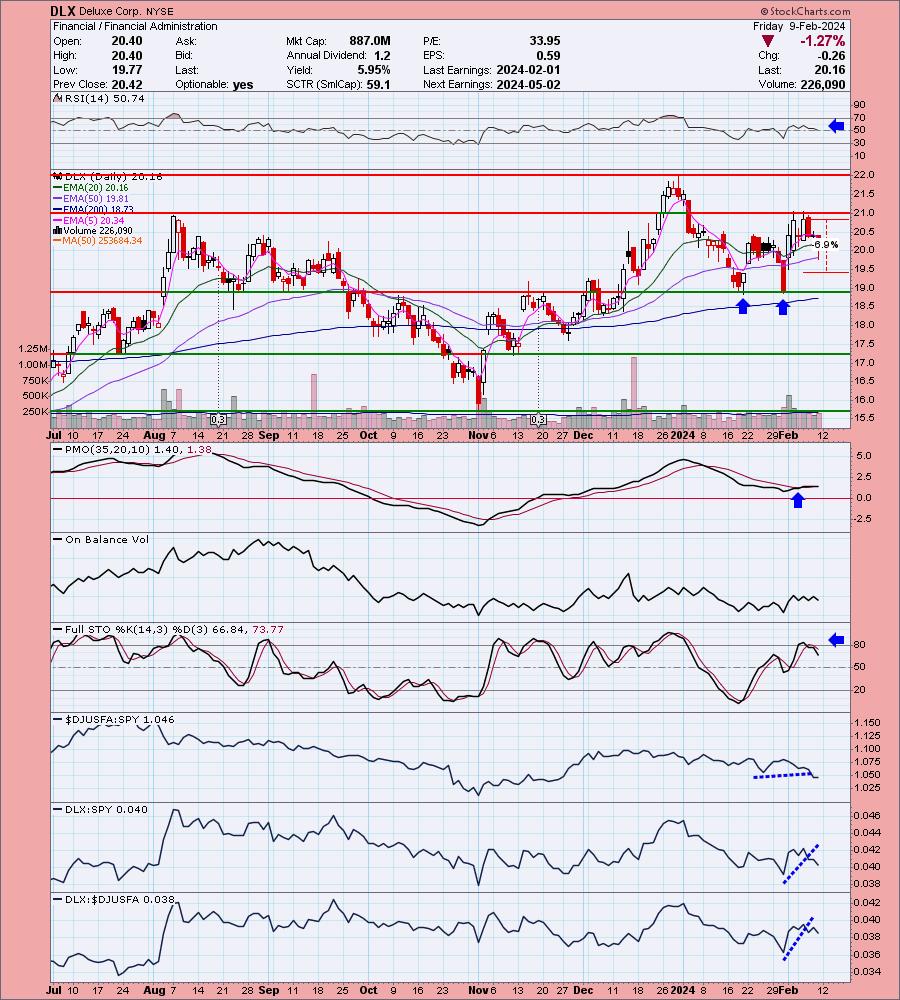
Deluxe Corp. (DLX)
EARNINGS: 05/02/2024 (BMO)
Deluxe Corp. engages in the provision of marketing products and services. It operates through the following segments: Payments, Cloud Solutions, Promotional Solutions, and Checks. The Payments segment includes treasury management solutions, including remittance and lockbox processing, remote deposit capture, receivables management, payment processing and paperless treasury management. The Cloud Solutions segment is composed of web hosting and design services, data-driven marketing solutions and hosted solutions, including digital engagement, logo design, financial institution profitability reporting and business incorporation services. The Promotional Solutions segment offers business forms, accessories, advertising specialties, promotional apparel, retail packaging and strategic sourcing services. The Checks segment consists of printed personal and business checks. The company was founded by W. R. Hotchkiss in 1915 and is headquartered in Minneapolis, MN.
Predefined Scans Triggered: None.
"DLX is unchanged in after hours trading. I believe the reason I kept coming back to this chart is the double bottom pattern. These patterns suggest you will see a rally the height of the pattern when the confirmation line is overcome. That line is at $20.50 and it has been overcome. The RSI is positive and not overbought. The PMO has given us a Crossover BUY Signal above the zero line. Stochastics are rising and are now above 80. Relative strength for the group could be better, but DLX is outperforming the group and the SPY. If the group gets going this could be a very nice stock to own. I've set the stop beneath the 50-day EMA at 6.9% or $19.40."
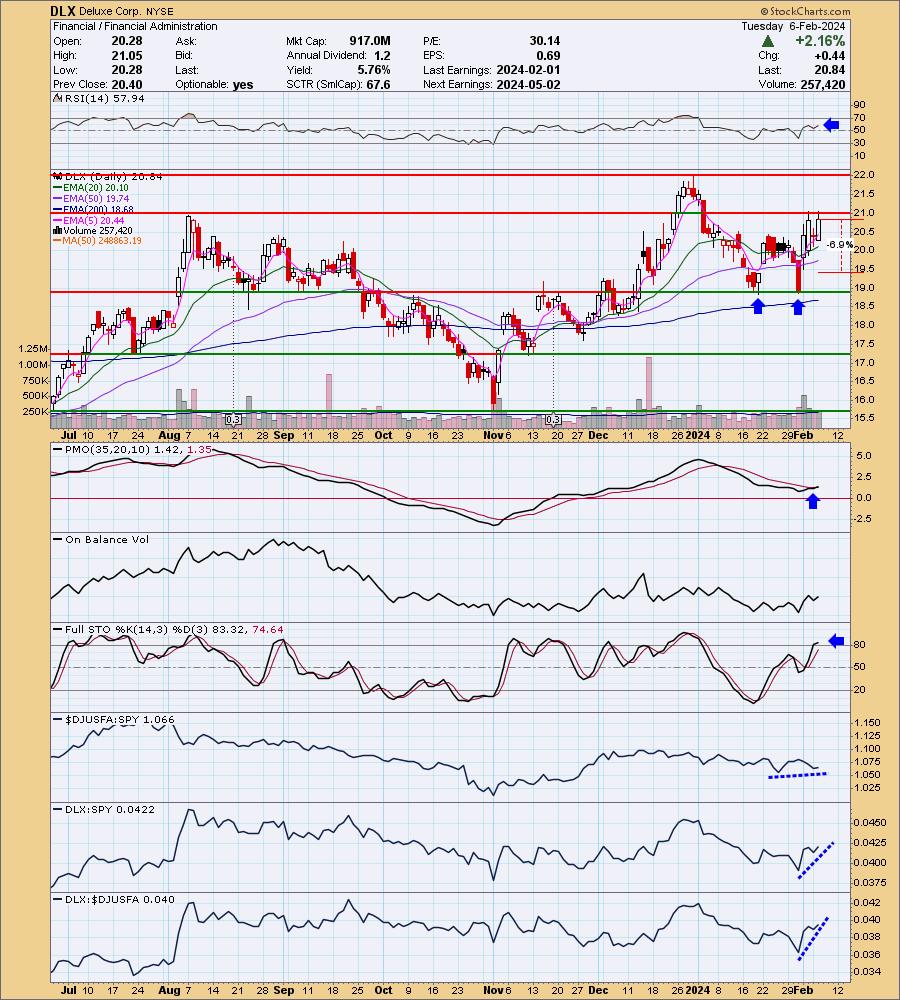
Here is today's chart:
This one went south in a hurry so let's contemplate what may've gone wrong here. Overhead resistance had not been overcome yet so we were vulnerable to a pullback. Unfortunately this pullback got out of hand quickly and turned this one into a bad investment. No need to wait this one out to get to the stop level.
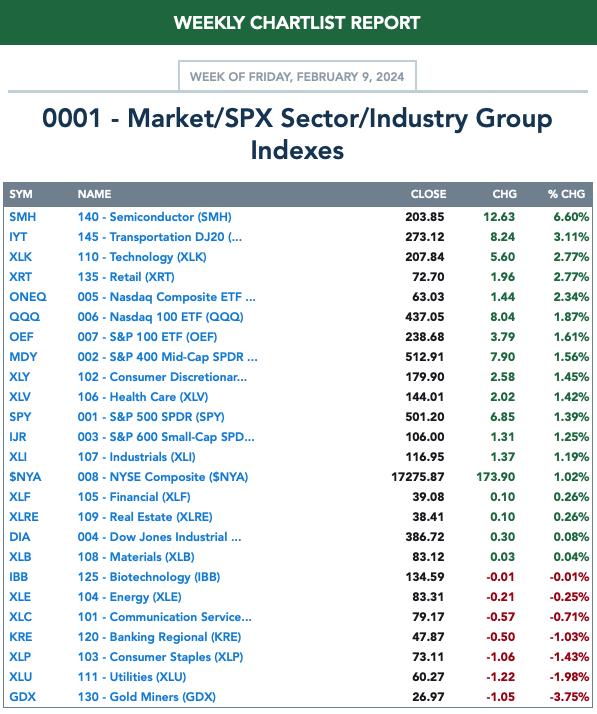
THIS WEEK's Performance:
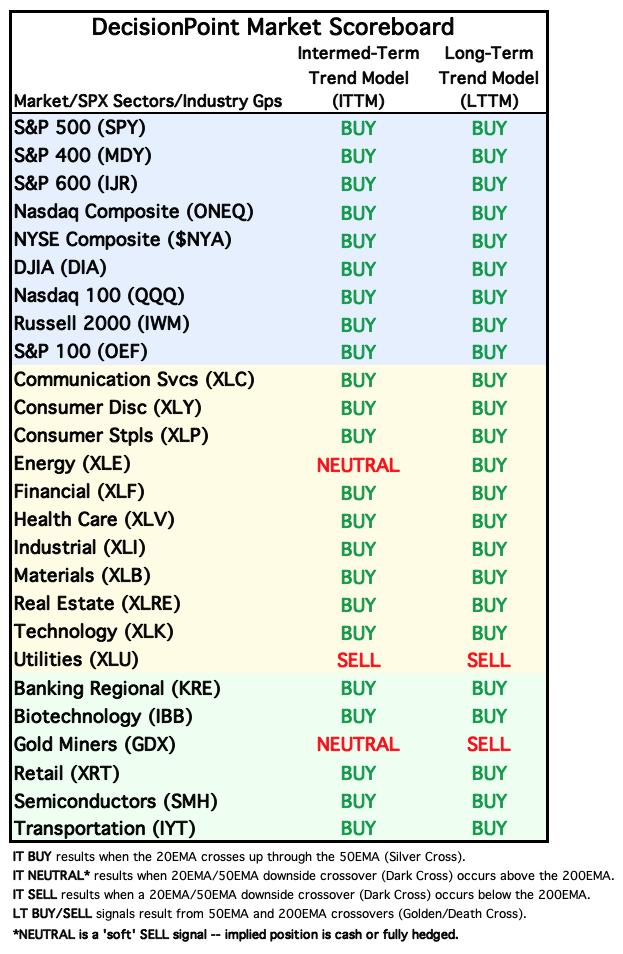
DecisionPoint Market Scoreboard (Mechanical Trend Model Signals):
Click Here to view Carl's annotated "Under the Hood" ChartList!
Sector to Watch: Technology (XLK)
Technology is showing a tremendous amount of leadership and is beginning to outperform the market. What got me to pick this chart over XLY was primarily due to %Stocks > 20EMA which is expanding nicely. It is getting overbought on that participation reading, but there is still room to move higher nonetheless. The RSI is now overbought, but this is a condition that is all too familiar for XLK and one that we may not need to worry about just yet. Stochastics are above 80 and the PMO has surged above the signal line. I like XLK moving into next week. However, this could be where the worst will be felt should the market turn over so remember to keep all investments with a short-term horizon. Stops are a very good idea.
Industry Group to Watch: Autos ($DJUSAU)
This is an early detection on this chart, it isn't as ripe as the charts I normally present, but it is shaping up for a reversal. The double bottom is what originally caught my eye followed by the PMO which is rising toward a Crossover BUY Signal. We do need to be careful as this signal will arrive well below the zero line and could signal diminishing weakness not new strength. Still I found some symbols I liked within the group: HOG (I own it), F and LI.
Go to our Under the Hood ChartList on DecisionPoint.com to get an in-depth view of all the sectors. On StockCharts.com you can find the Industry Summary.
Good Luck & Good Trading!
- Erin
erin@decisionpoint.com
Full Disclosure: I'm 70% long, 0% short. I own HOG, COHU and AMPH.
Watch the latest episode of the DecisionPoint Trading Room with Carl & Erin Swenlin on Mondays 3:00p EST!
Technical Analysis is a windsock, not a crystal ball. --Carl Swenlin
NOTE: The stocks reported herein are from mechanical trading model scans that are based upon moving average relationships, momentum and volume. DecisionPoint analysis is then applied to get selections from the scans. The selections given should prompt readers to do a chart review using their own analysis process. This letter is not a call for a specific action to buy, sell or short any of the stocks provided. There are NO sure things or guaranteed returns on the selection of "diamonds in the rough."
Helpful DecisionPoint Links:
DecisionPoint Shared ChartList and DecisionPoint Chart Gallery
Price Momentum Oscillator (PMO)
Swenlin Trading Oscillators (STO-B and STO-V)
(c) Copyright 2024 DecisionPoint.com