
I was mildly surprised today when many of the selections came from the Healthcare sector. This hasn't been a healthy area of the market to invest in (pun intended) and internals still aren't as favorable as I'd like but the stocks selected do look like leaders. I included two Healthcare stocks today that came from the two industry groups most prevalent in the scans, Healthcare Providers and Medical Equipment.
Paper had a good showing, but I believe that is temporary. I've included a Reinsurance stock from Financials and an Industrial Supplier. Interestingly I only saw one Communications Services stock and one from Energy which was our Sector to Watch.
Good Luck & Good Trading,
Erin
Today's "Diamonds in the Rough": AIT, ELV, SPNT and SWAV.
Runner-ups: MTCH, AORT, EPAC and SEM.

RECORDING & DOWNLOAD LINK (3/15/2024):
Topic: DecisionPoint Diamond Mine (3/15/2024) LIVE Trading Room
Recording & Download Link HERE.
Passcode: March#15th
REGISTRATION for 3/22/2024:
When: Mar 22, 2024 09:00 AM Pacific Time (US and Canada)
Topic: DecisionPoint Diamond Mine (3/22/2024) LIVE Trading Room
Register in advance for this webinar HERE.
After registering, you will receive a confirmation email containing information about joining the webinar.

Here is the latest recording from 3/18. Click HERE to subscribe to the DecisionPoint YouTube Channel to be notified when new content is available.
Welcome to DecisionPoint Diamonds, wherein I highlight ten "Diamonds in the Rough" per week. These are selected from the results of my DecisionPoint Scans which search for stocks that could benefit from the trend and condition of the market. Remember, these are not recommendations to buy or sell, but are the most interesting of the stocks that surfaced in my scans. My objective is to save you the work of the initial, tedious culling process, but you need to apply your own analysis to see if these stocks pique your interest as well. There are no guaranteed winners here!
"Predefined Scans Triggered" are taken from StockCharts.com using the "Symbol Summary" option instead of a "SharpChart" on the workbench.
Stop levels are all rounded down.
Applied Industrial Technologies Inc. (AIT)
EARNINGS: 04/25/2024 (BMO)
Applied Industrial Technologies, Inc. engages in the manufacture and distribution of industrial parts and products. It operates through the Service Center Based Distribution, and Fluid Power & Flow Control Business segments. The Service Center-Based Distribution segment provides customers with a wide range of industrial products through a network of service centers. The Fluid Power & Flow Control Businesses segment specializes in distributing, engineering, designing, integrating, and repairing hydraulic and pneumatic fluid power technologies, and engineered flow control products and services. The company was founded by Joseph Bruening in January 1923 and is headquartered in Cleveland, OH.
Predefined Scans Triggered: Moved Above Upper Keltner Channel, New 52-week Highs, Moved Above Upper Bollinger Band, Moved Above Upper Price Channel and P&F Double Top Breakout.
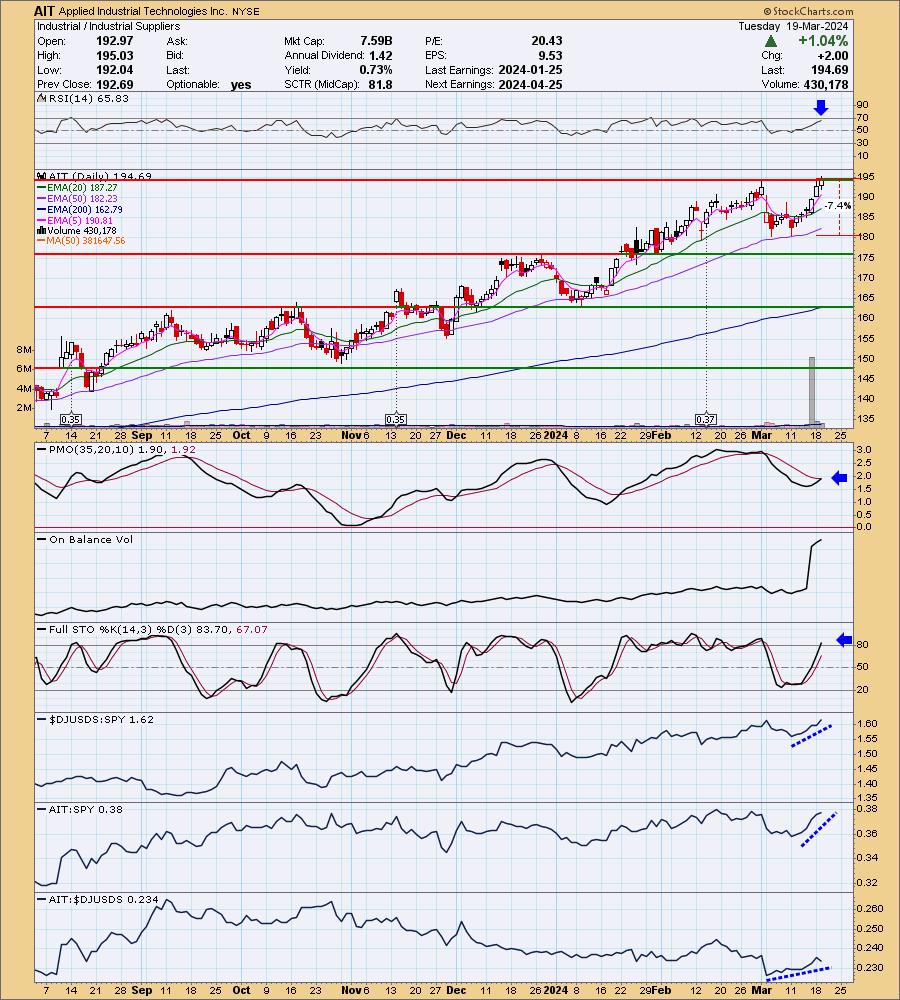
AIT is unchanged in after hours trading. This was the first chart I looked at today and it was a winner from the Diamond PMO Scan. We have a new breakout in the works. The RSI is positive and not overbought. The PMO is about to give us a Crossover BUY Signal. It is also well above the zero line on this nearing crossover. Stochastics just moved above 80 and relative strength is rising across the board. I've set the stop beneath support at 7.4% or $180.28.
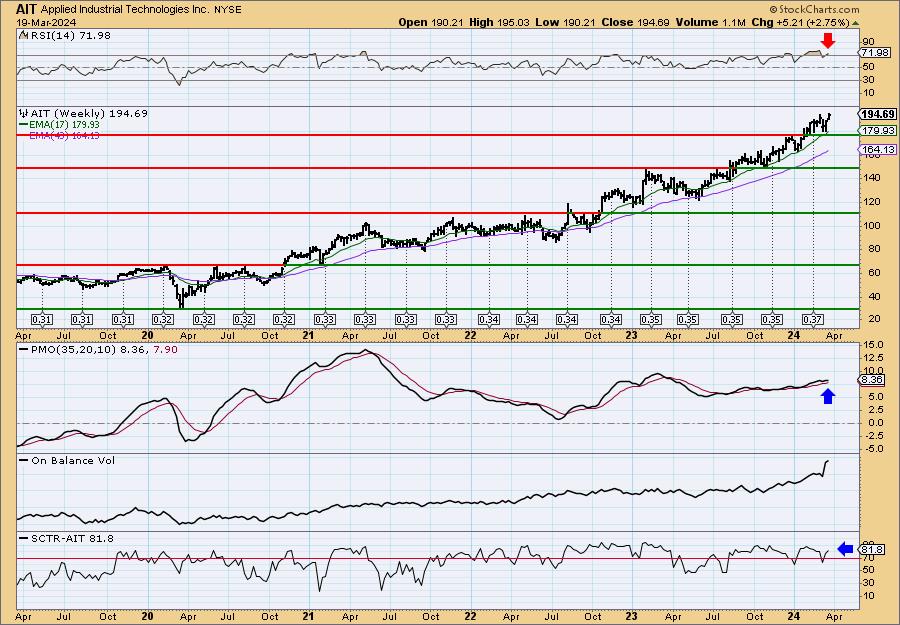
This is a solid rising trend as exemplified by the flat PMO above the zero line. The weekly RSI is overbought, but it has been. Volume popped in based on the jump in the OBV. The StockCharts Technical Rank (SCTR) is in the hot zone* above 70. Consider a 17% upside target to about $227.79.
*If a stock is in the "hot zone" above 70, it implies that it is stronger than 70% of its universe (large-, mid-, small-caps and ETFs) primarily in the intermediate to long terms.
Elevance Health, Inc. (ELV)
EARNINGS: 04/17/2024 (BMO)
Elevance Health, Inc. operates as a health company, which engages in improving lives and communities, and making healthcare simpler. It operates through the following segments: Commercial and Specialty Business, Government Business, CarelonRx, and Other. The Commercial and Specialty Business segment provides insurance products and services such as stop loss, dental, vision, life, disability and supplemental health insurance. The Government Business segment includes medicare and medicaid businesses, national government services, and services provided to the federal government. The CerelonRx segment offers formulary management, pharmacy networks, prescription drug database, member services, and mail order capabilities. The Other segment is involved in health services business focused on quality of healthcare by enabling and creating new care delivery and payment models. The company was founded in 1944 and is headquartered in Indianapolis, IN.
Predefined Scans Triggered: New 52-week Highs, Moved Above Upper Price Channel, P&F Double Top Breakout and P&F Triple Top Breakout.
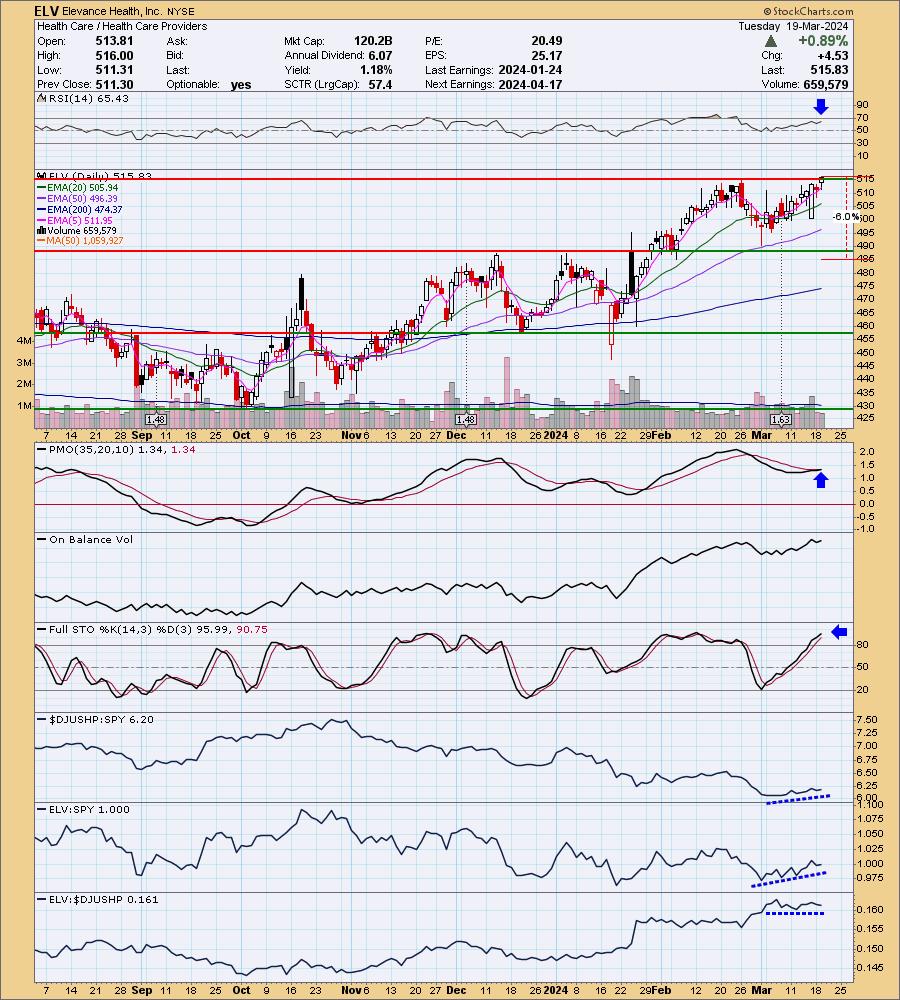
ELV is unchanged in after hours trading. Here is another tiny breakout chart. The indicators are lined up well for follow through on the breakout. The RSI is not overbought and is positive. I like the PMO in particular. It has generated a Crossover BUY Signal well above the zero line. Stochastics are rising above 80. It is performing in line with its industry group and that is working to its advantage against the SPY given the group is outperforming. The stop is set below support at 6% or $484.88.
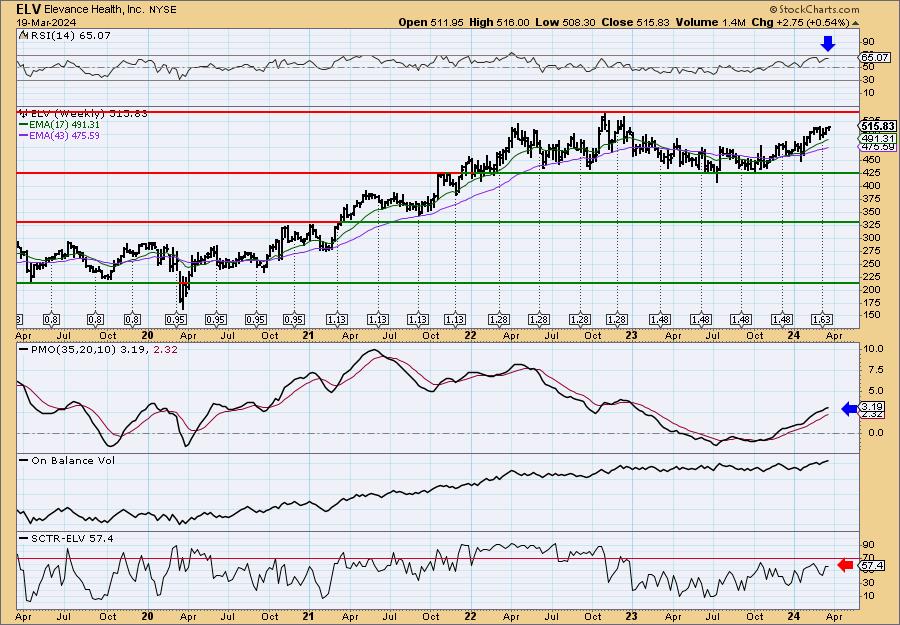
The weekly chart does show us that it is getting near overhead resistance at all-time highs. The indicators are favorable for a breakout there. The weekly RSI is positive and not overbought and the weekly PMO is rising above the zero line on a Crossover BUY Signal. It isn't a terrible SCTR reading, but I would like to see it move higher. Consider an upside target of about 17% to $603.52.
SiriusPoint Ltd. (SPNT)
EARNINGS: 05/02/2024 (AMC)
SiriusPoint Ltd. engages in the provision of insurance and reinsurance services. It operates through the Reinsurance, and Insurance and Services segments. The Reinsurance segment covers aviation and space, casualty, contingency, credit and bond, marine and energy, mortgage, and property. The Insurance and Services segment involves accident and health, environmental, worker's compensation, and others. The company was founded in 1945 and is headquartered in Pembroke, Bermuda.
Predefined Scans Triggered: New CCI Buy Signals, New 52-week Highs, P&F Spread Triple Top Breakout, Stocks in a New Uptrend (Aroon), Moved Above Upper Price Channel and P&F Double Top Breakout.
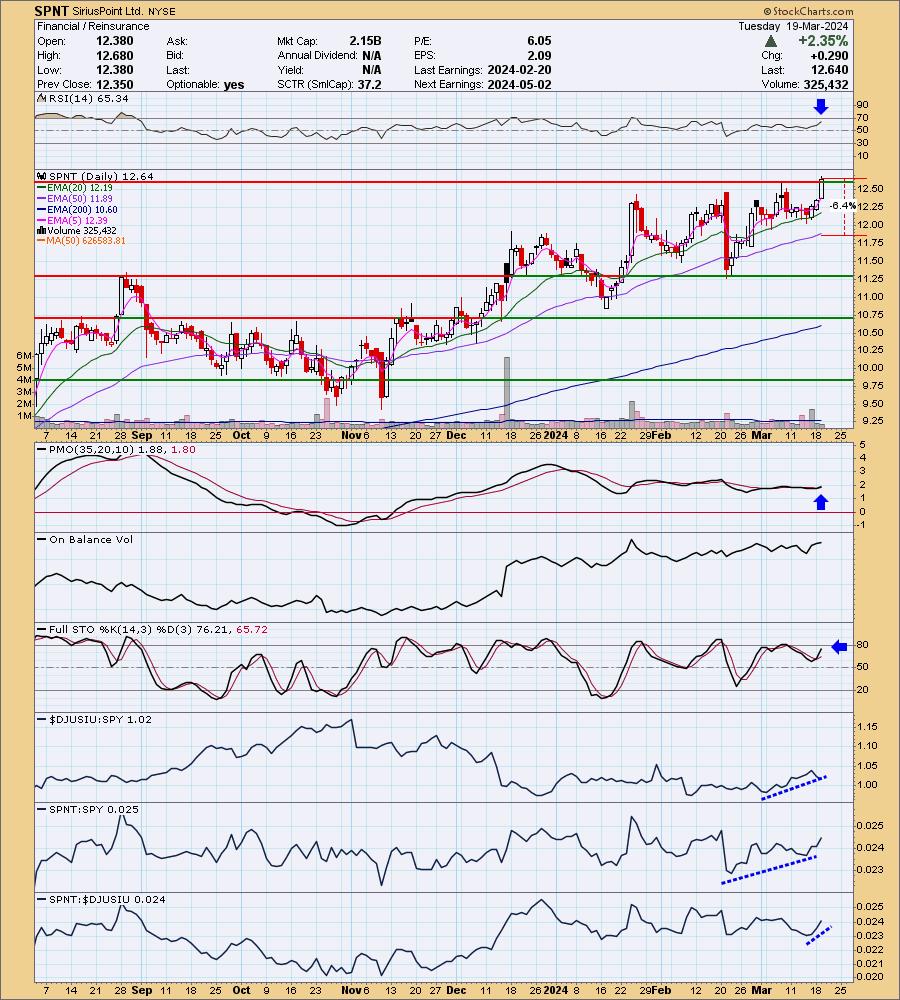
SPNT is unchanged in after hours trading. As with the other two charts, we have a nice breakout above resistance. The RSI is positive and not overbought yet. The PMO is flat above the zero line and today saw a Crossover BUY Signal. Stochastics are rising in positive territory. Relative strength studies are bullish with all relative strength lines rising. SPNT is just now beginning to outperform its successful industry group. The stop is set at the 50-day EMA around 6.4% or $11.83.
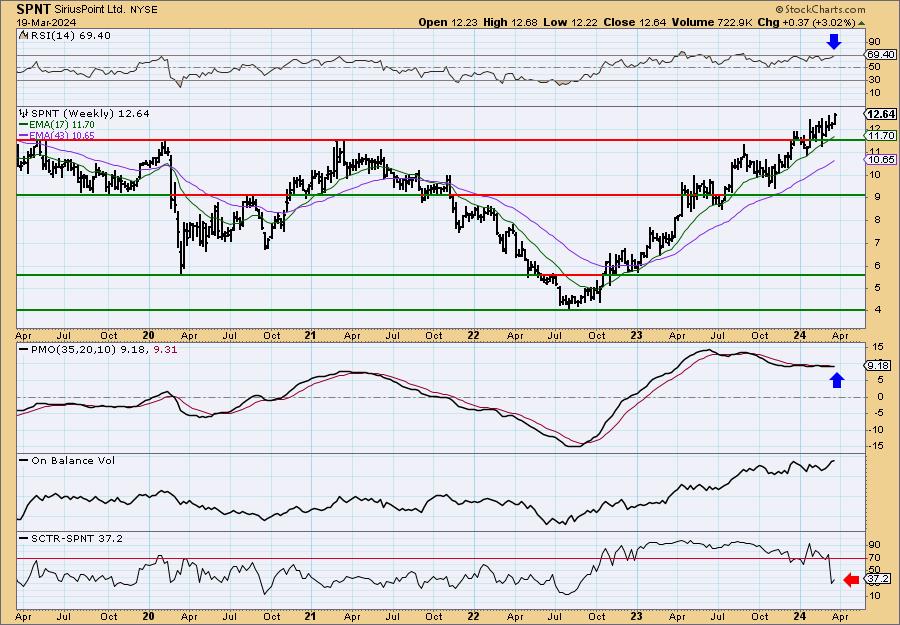
The weekly chart looks good minus the low SCTR value so keep this one in the short-term timeframe for now. The weekly RSI is positive but is getting a tad overbought. The weekly PMO is showing pure strength as it is flat above the zero line. Consider an upside target around 17% or $17.79.
ShockWave Medical Inc. (SWAV)
EARNINGS: 05/06/2024 (AMC)
Shockwave Medical, Inc. operates as a medical device company, which concentrates on developing and commercializing products intended to transform the way classified cardiovascular disease is treated. The firm offers M5 catheters for treating above-the-knee peripheral artery disease, C2 catheters for treating coronary artery disease, and S4 catheters or treating below-the-knee peripheral artery disease. The company was founded by Daniel Hawkins, John M. Adams, and Todd J. Brinton in 2009 and is headquartered in Santa Clara, CA.
Predefined Scans Triggered: P&F Double Top Breakout and P&F Triple Top Breakout.
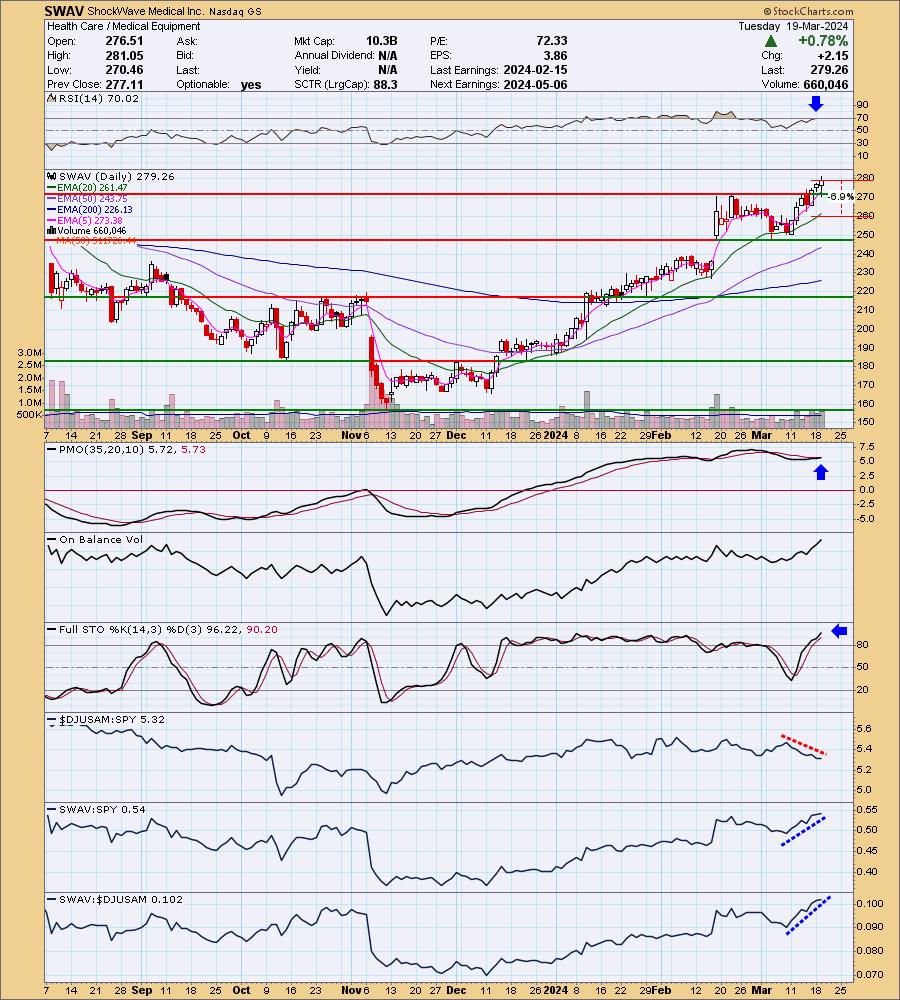
SWAV is up +0.74% in after hours trading. Here is our fourth chart with a nice breakout. This one has already seen follow through, but I expect more. I didn't annotate it, but you can see a bull flag with the pole starting at the November/December lows. The RSI is overbought right now but that hasn't been fatal previously. The PMO is triggering a Crossover BUY Signal well above the zero line. We also see internal price strength as measured by Stochastics being above 80. I don't like that the industry group is failing, but SWAV is performing well enough to outperform the SPY so it was acceptable. The stop is set beneath the 20-day EMA at 6.9% or $259.99.
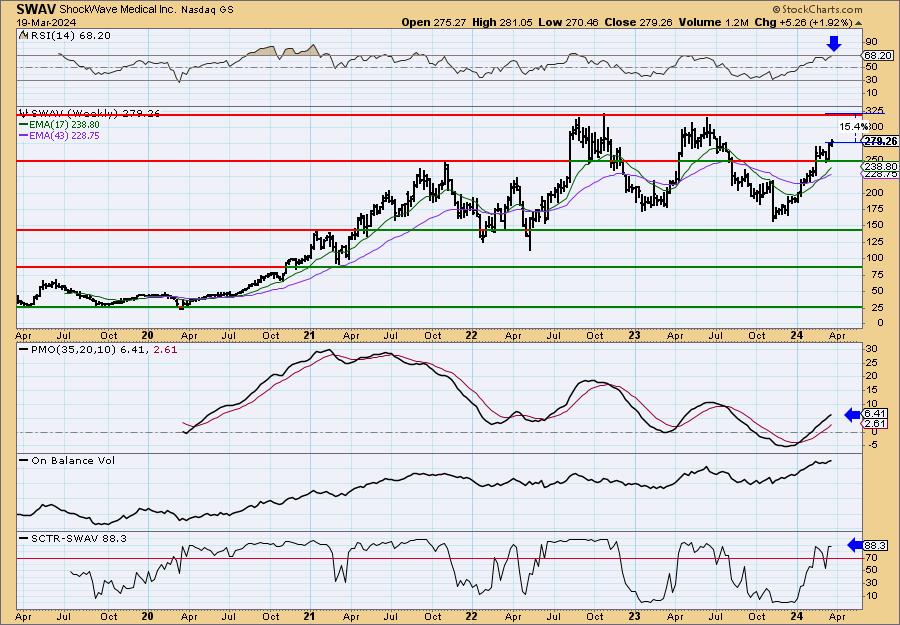
There's still plenty of upside potential before it reaches all-time highs again. The weekly chart is very favorable and suggests this one could be held into the intermediate term. The weekly RSI is positive and not yet overbought. The PMO is rising strongly above the zero line and the SCTR is in the hot zone.
Don't forget, on Thursdays I look at reader-requested symbols, click HERE to send me an email. I read every email I receive and try to answer them all!
Current Market Outlook:
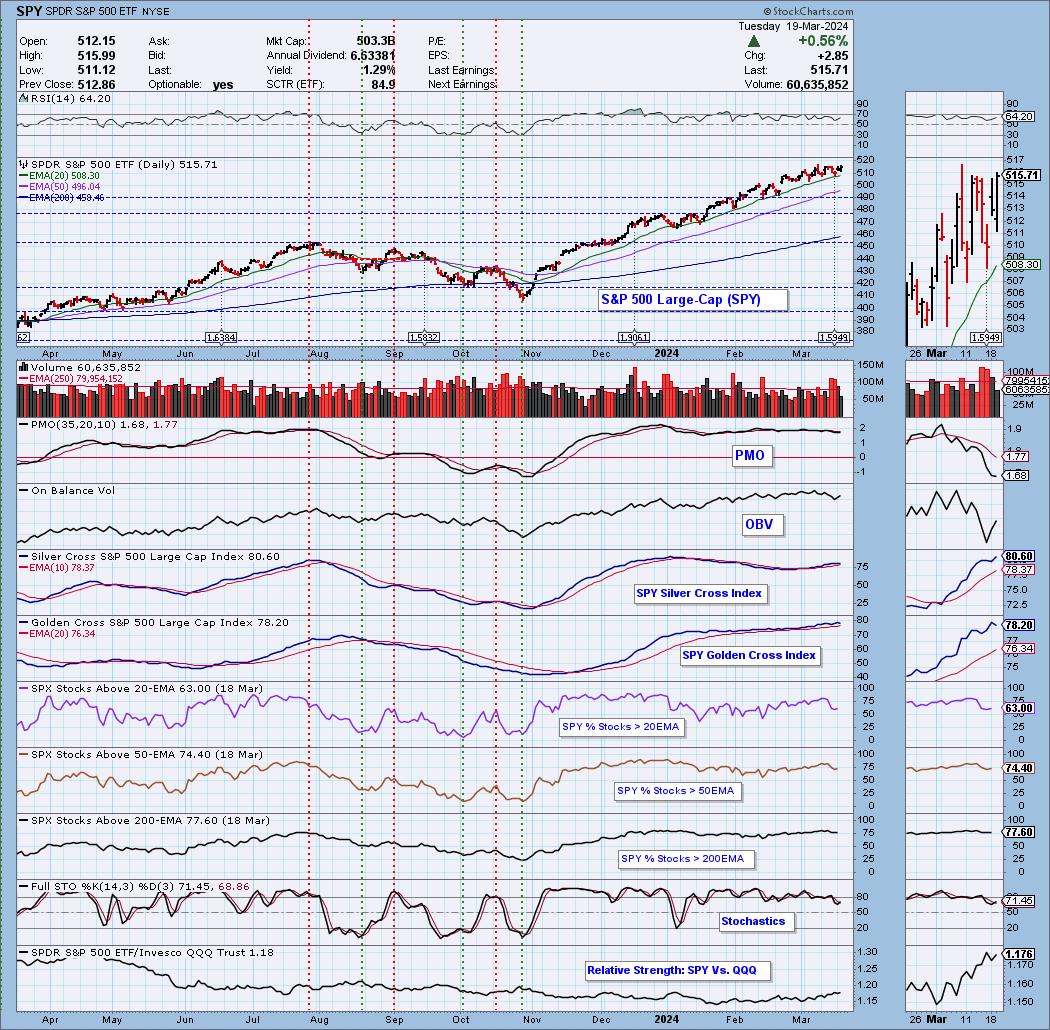
Market Environment: It is important to consider the odds for success by assessing the market tides. The following chart uses different methodologies for objectively showing the depth and trend of participation for intermediate- and long-term time frames.
- The Silver Cross Index (SCI) shows the percentage of SPX stocks on IT Trend Model BUY signals (20-EMA > 50-EMA)
- The Golden Cross Index (GCI) shows the percentage of SPX stocks on LT Trend Model BUY signals (50-EMA > 200-EMA)
Don't forget that as a "Diamonds" member, you have access to our GCI/SCI curated ChartList on DecisionPoint.com. You'll find it under "Members Only" links on the left side on the Blogs and Links Page.
Here is the current chart:
Full Disclosure: I am 55% long, 0% short.
I'm required to disclose if I currently own a stock I mention and/or may buy/short it within the next 72 hours.
"Technical Analysis is a windsock, not a crystal ball." - Carl Swenlin
(c) Copyright 2024 DecisionPoint.com
Watch the latest episode of DecisionPoint Trading Room with Carl & Erin Swenlin Mondays on the DecisionPoint YouTube channel here!
NOTE: The stocks reported herein are from mechanical trading model scans that are based upon moving average relationships, momentum and volume. DecisionPoint analysis is then applied to get five selections from the scans. The selections given should prompt readers to do a chart review using their own analysis process. This letter is not a call for a specific action to buy, sell or short any of the stocks provided. There are NO sure things or guaranteed returns on the daily selection of "Diamonds in the Rough."
Regarding BUY/SELL Signals: The signal status reported herein is based upon mechanical trading model signals and crossovers. They define the implied bias of the price index/stock based upon moving average relationships and momentum, but they do not necessarily call for a specific action. They are information flags that should prompt chart review. Further, they do not call for continuous buying or selling during the life of the signal. For example, a BUY signal will probably (but not necessarily) return the best results if action is taken soon after the signal is generated. Additional opportunities for buying may be found as price zigzags higher, but the trader must look for optimum entry points. Conversely, exit points to preserve gains (or minimize losses) may be evident before the model mechanically closes the signal.
Helpful DecisionPoint Links:
Price Momentum Oscillator (PMO)
Swenlin Trading Oscillators (STO-B and STO-V)
For more links, go to DecisionPoint.com