
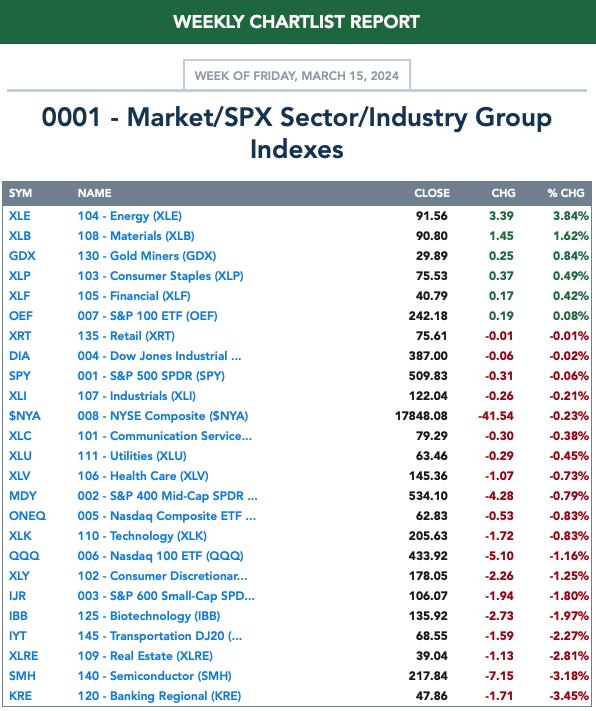
It wasn't a good week for "Diamonds in the Rough", but this week's "Darling" was up 5.76% since it was picked on Tuesday. The market was down on the week, but not quite as much as "Diamonds in the Rough". Three of the "Diamonds in the Rough" were up, seven were down on the week.
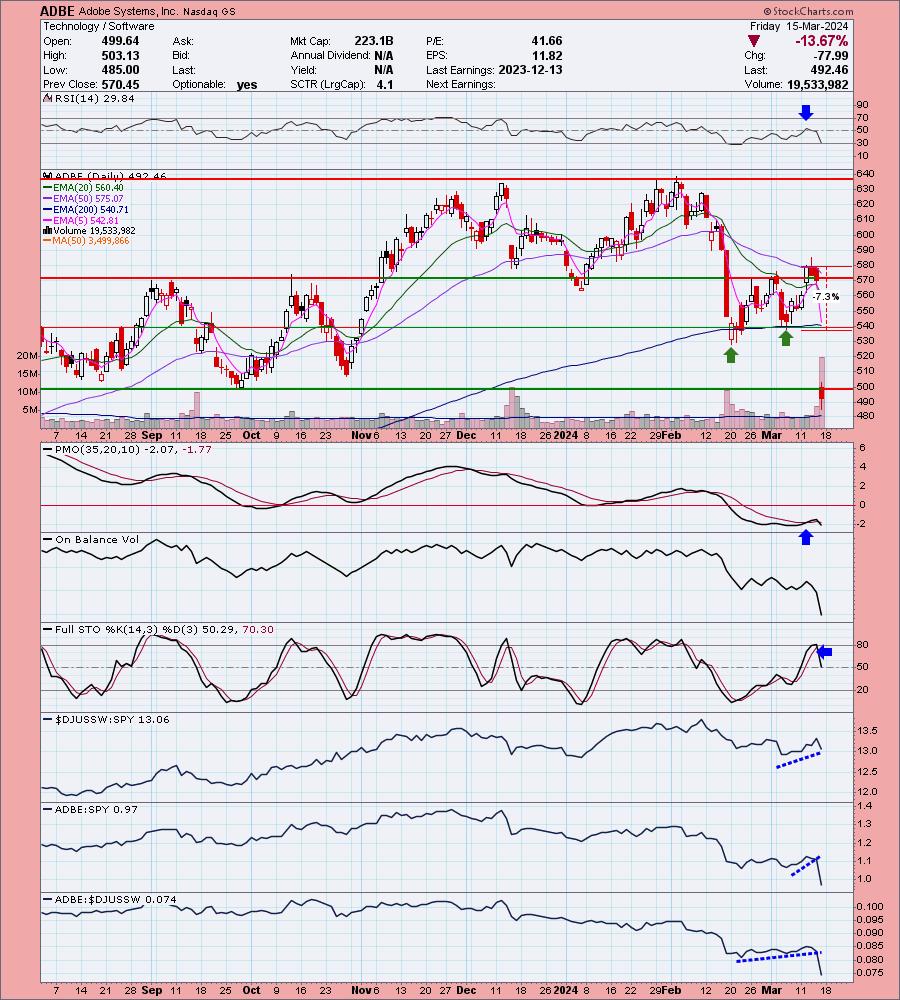
The biggest stinker would be Adobe (ADBE) which I took a chance on personally. It reported earnings this week, but the setup looked so good, I bit. Lesson learned on trading stocks going into earnings, ADBE was down over 13% today. I will always tell you if a stock is going to report earnings to leave the decision up to you, but from now on I'm going to avoid presenting stocks that are going into earnings.
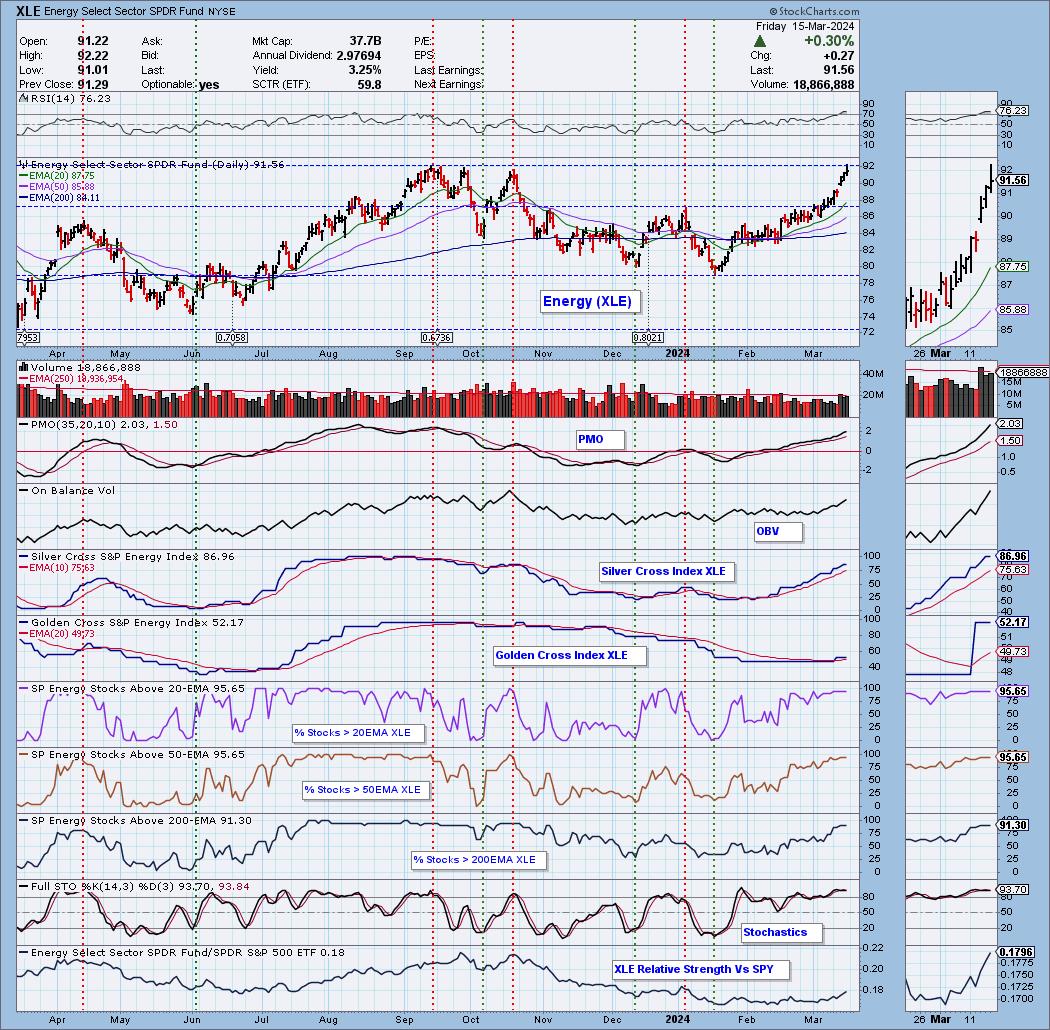
The Sector to Watch was a piece of cake this morning. Consumer Staples (XLP) looked somewhat promising until we looked under the hood. Energy (XLE) was the clear winner and with the market weakening, I think money will rotate that direction.
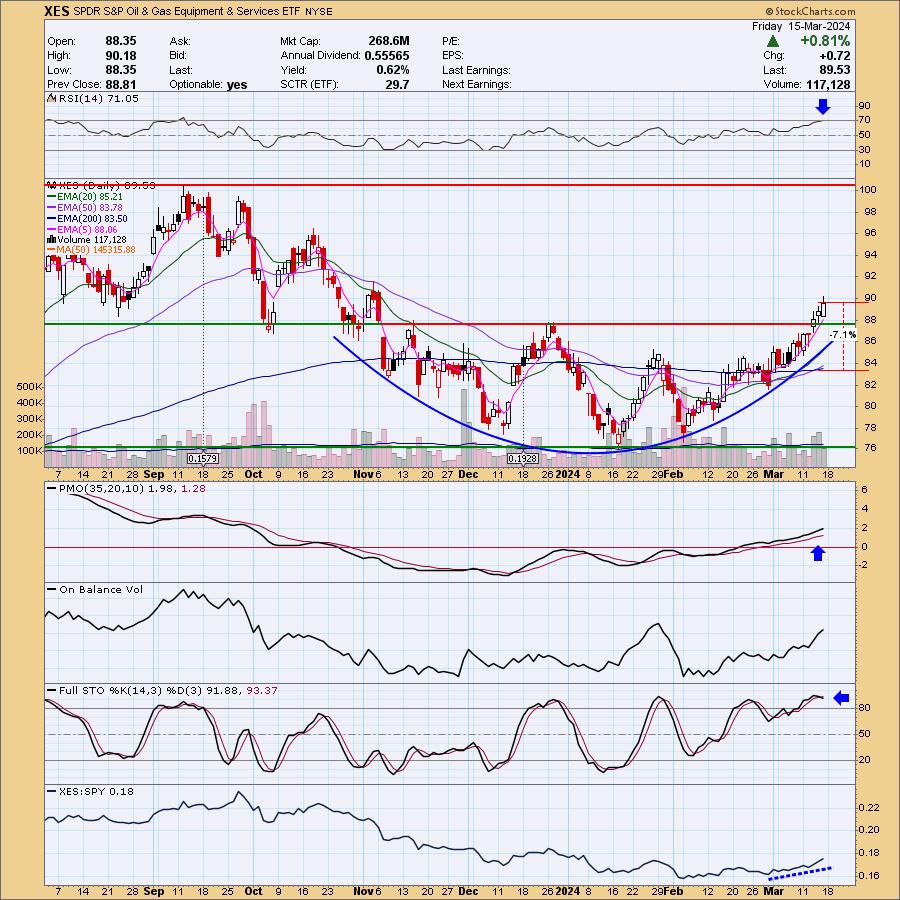
We could've picked any of the industry groups within with the exception of Coal. I opted to go with Oil Equipment & Services. From this group we picked out NBR, AESI and RIG.
I ran a number of scans to finish the trading room and was able to extract CI, CVI, PLMR and CNM as watch list symbols going into next week.
Have a great weekend! See you in the free DecisionPoint Trading Room on Monday at Noon ET!
Good Luck & Good Trading,
Erin

RECORDING & DOWNLOAD LINK (3/15/2024):
Topic: DecisionPoint Diamond Mine (3/15/2024) LIVE Trading Room
Recording & Download Link HERE.
Passcode: March#15th
REGISTRATION for 3/22/2024:
When: Mar 22, 2024 09:00 AM Pacific Time (US and Canada)
Topic: DecisionPoint Diamond Mine (3/22/2024) LIVE Trading Room
Register in advance for this webinar HERE.
After registering, you will receive a confirmation email containing information about joining the webinar.

Below is the latest free DecisionPoint Trading Room recording from 3/11. You'll find these recordings posted on Mondays to our DP YouTube Channel. Be sure and subscribe HERE.
A few items about the spreadsheet: I've put on the spreadsheet whether the RSI is positive (green) or negative (red). The PMO column tells you if it is rising (green) or falling (red). Finally I've added my own "Sparkle Factor" that gives you my assessment going forward, bullish (green), bearish (red) or neutral (gray). The Sparkle Factor is basically my thoughts on whether I expect it to rise or fall. A neutral means it could really go either way so it could be added to a watch list. If you're in a stock I consider "neutral" going forward, the ball is in your court.
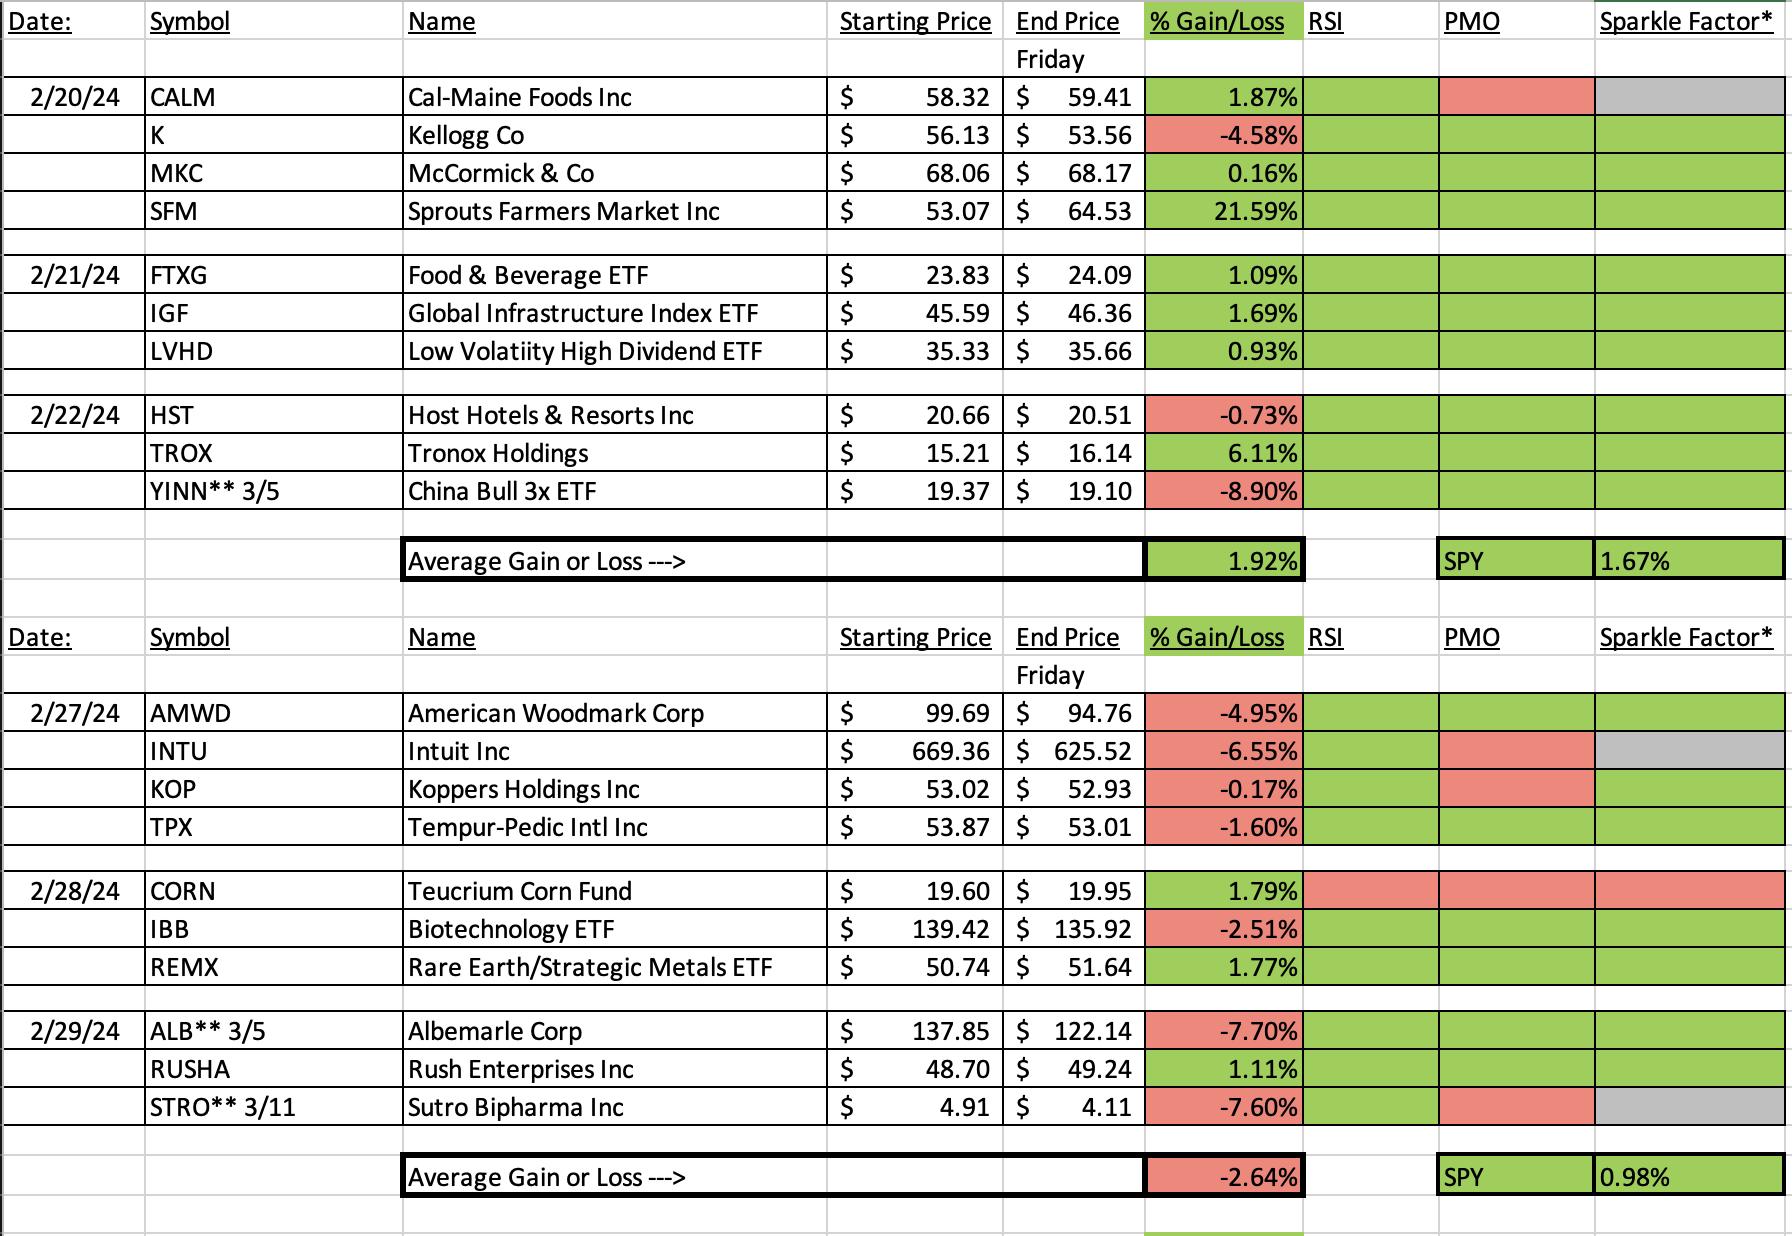
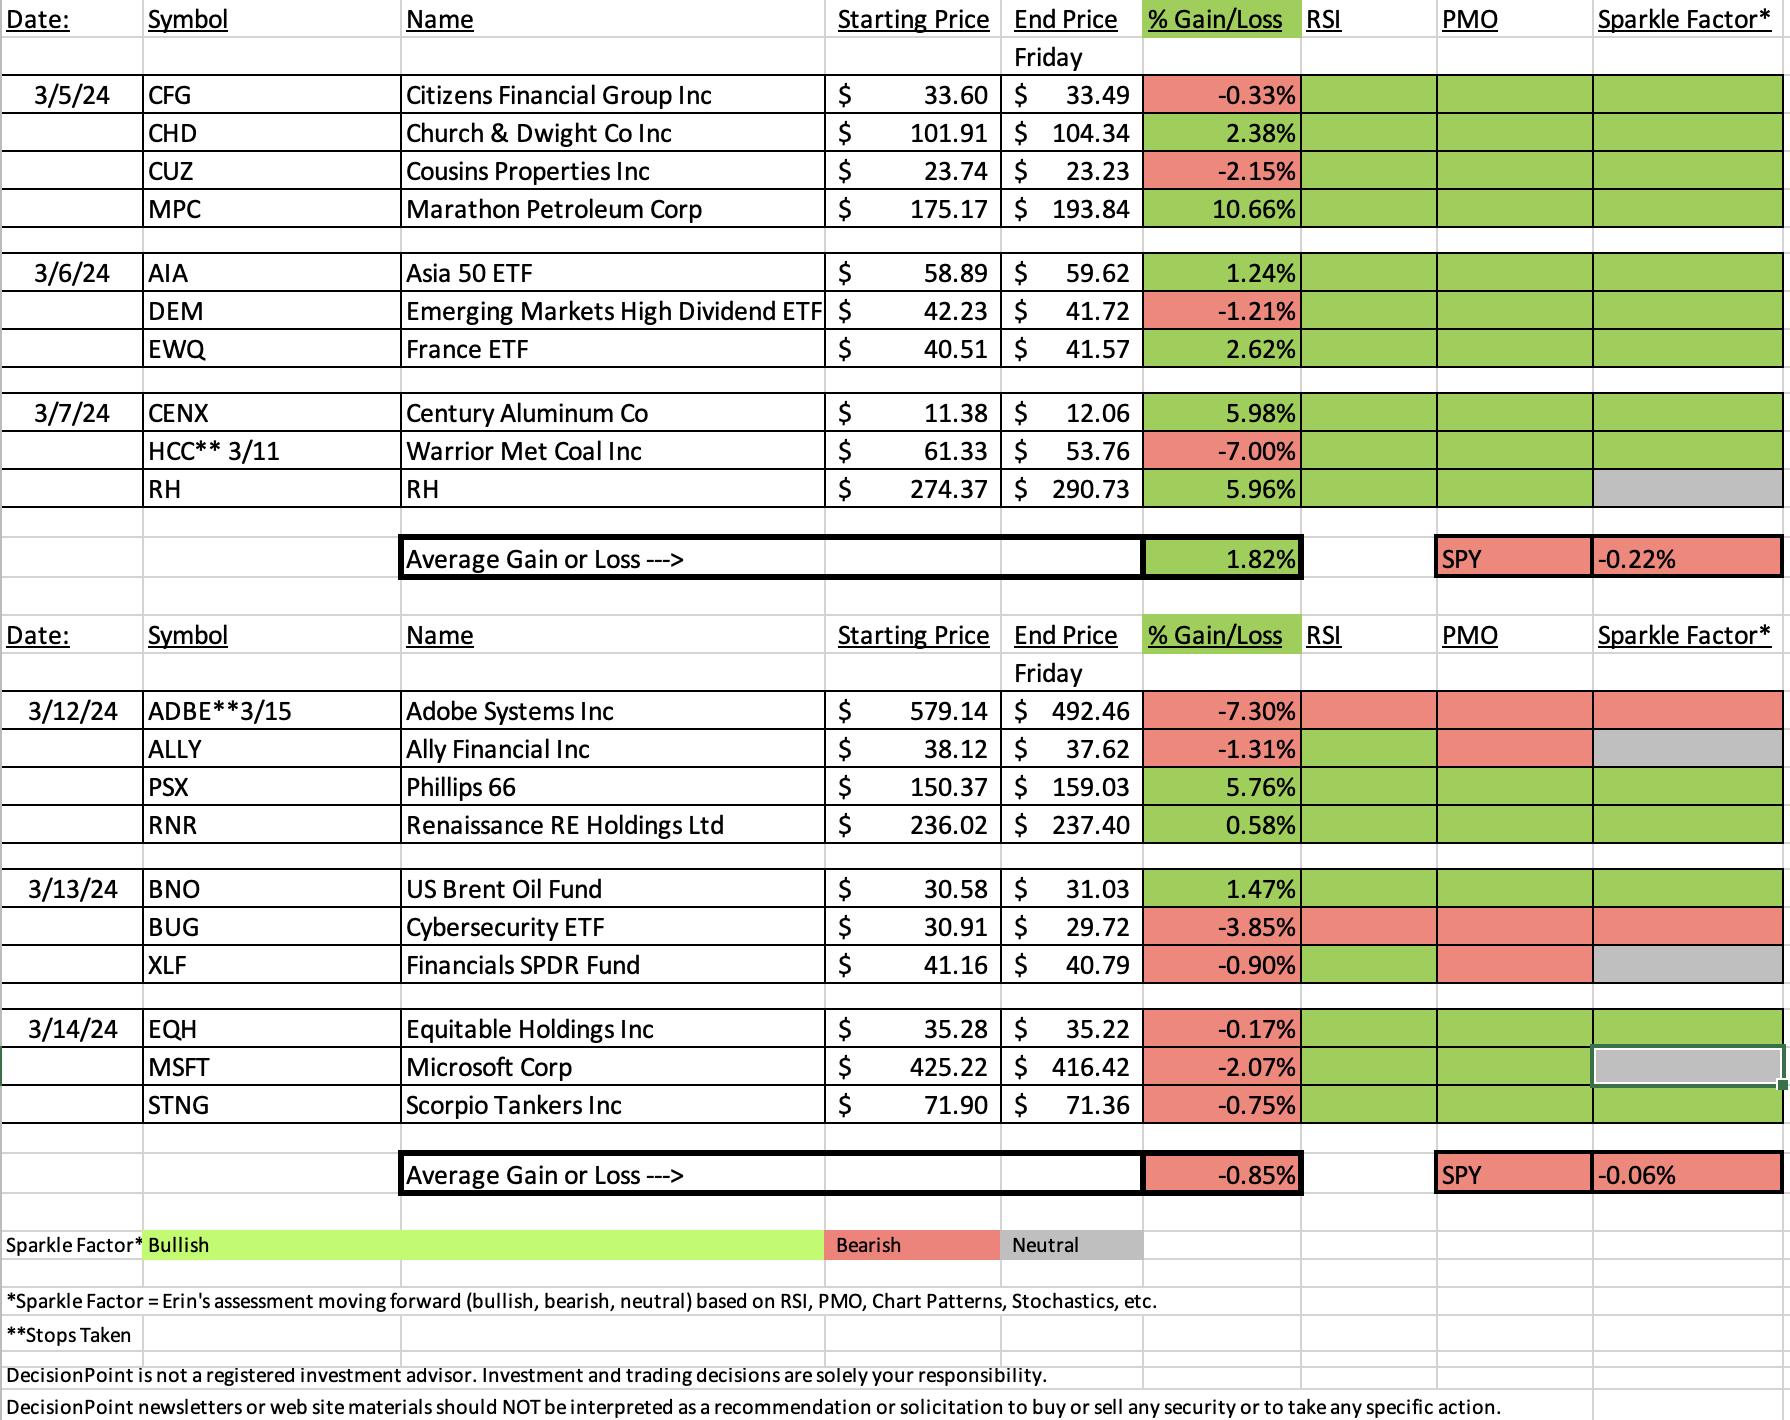
Darling:
Phillips 66 (PSX)
EARNINGS: 05/01/2024 (BMO)
Phillips 66 engages in the processing, transportation, storage, and marketing of fuels and other related products. The company operates through the following segments: Midstream, Chemicals, Refining and Marketing & Specialties. The Midstream segment provides crude oil and refined products transportation, terminaling and processing services, as well as natural gas, natural gas liquids and liquefied petroleum gas transportation, storage, processing and marketing services. The Chemicals segment produces and markets petrochemicals and plastics on a worldwide basis. The Refining segment Refines crude oil and other feedstocks into petroleum products such as gasoline, distillates and aviation fuels. The Marketing and Specialties segment purchases for resale and markets refined petroleum products such as base oils and lubricants, as well as power generation operations. The company was founded in 1875 and is headquartered in Houston, TX.
Predefined Scans Triggered: New 52-week Highs.
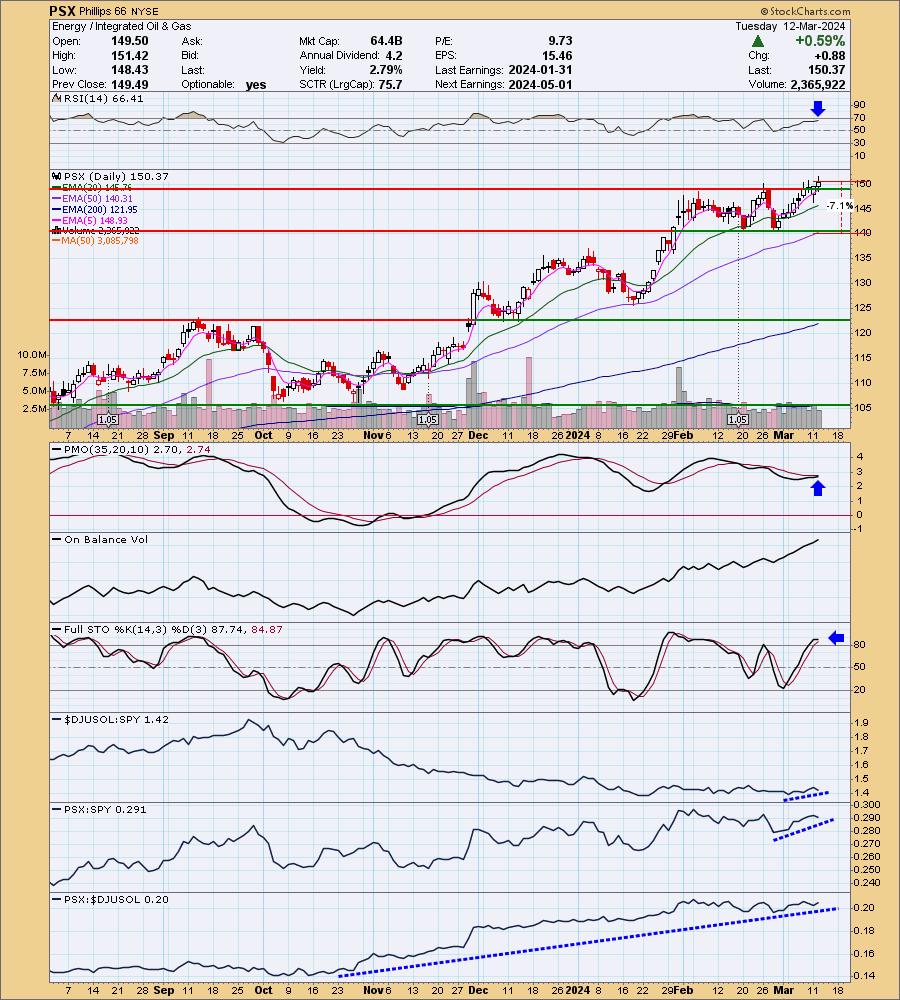
Below are the commentary and chart from Tuesday, 3/12:
"PSX is unchanged in after hours trading. I like the breakout from the previous trading range. Crude isn't doing much right now, but that hasn't stopped PSX from rallying consistently all month. The RSI is not overbought and there is a pending PMO Crossover BUY Signal. Stochastics have moved above 80 and relative strength is picking up for the group and PSX. The stop is set beneath support at 7.1% or $139.69."
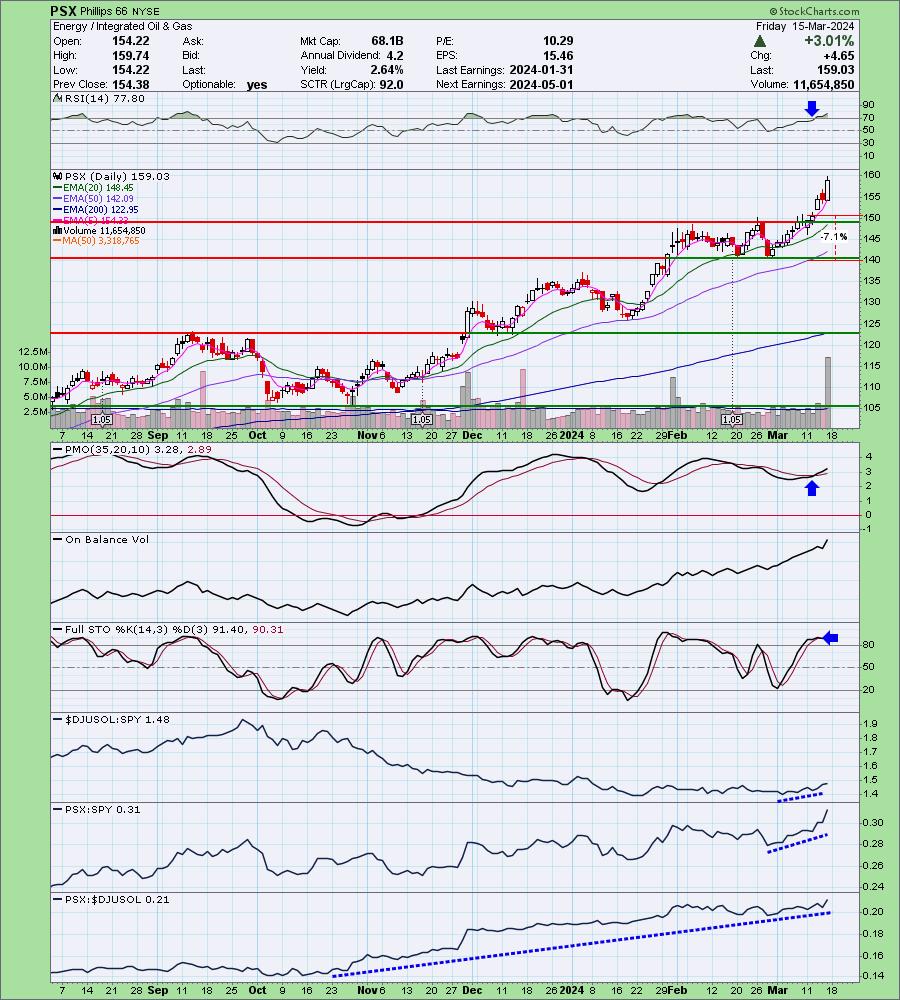
Here is today's chart:
Today saw a big bullish engulfing candlestick that suggests price will rise even further. One issue is that the RSI is overbought, but given the setup in the Energy sector, I don't think it will have a problem with that condition yet. The breakout was solid on Tuesday so it was a rather easy selection to make.
Don't forget, on Thursdays I look at reader-requested symbols, so shoot me an email at erin@decisionpoint.com. I read every email I receive and try to answer them all!
Dud:
Adobe Systems, Inc. (ADBE)
EARNINGS: 03/14/2024 (AMC) ** Reports on Thursday! **
Adobe, Inc. engages in the provision of digital marketing and media solutions. It operates through the following segments: Digital Media, Digital Experience, and Publishing and Advertising. The Digital Media segment offers creative cloud services, which allow members to download and install the latest versions of products, such as Adobe Photoshop, Adobe Illustrator, Adobe Premiere Pro, Adobe Photoshop Lightroom and Adobe InDesign, as well as utilize other tools, such as Adobe Acrobat. The Digital Experience segment provides solutions, including analytics, social marketing, targeting, media optimization, digital experience management, and cross-channel campaign management, as well as premium video delivery and monetization. The Publishing and Advertising segment includes legacy products and services for eLearning solutions, technical document publishing, web application development, and high-end printing. The company was founded by Charles M. Geschke and John E. Warnock in December 1982 and is headquartered in San Jose, CA.
Predefined Scans Triggered: None.
Below are the commentary and chart from Tuesday, 3/12:
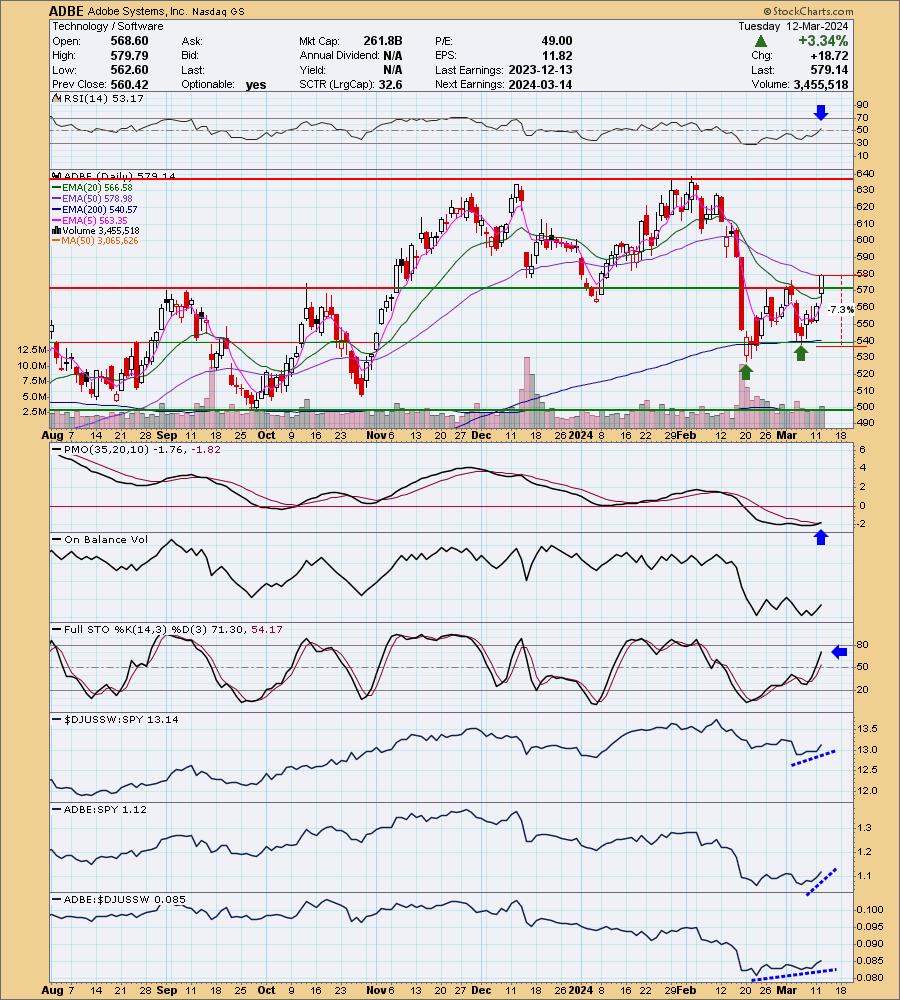
"ADBE is up +0.18% in after hours trading. This is a beautiful double bottom setup. Today's breakout confirmed the pattern. The minimum upside target of the pattern would be around $610. Note it is the "minimum" upside target. They do report on Thursday which is a bother, but this looks pretty good to take the chance. Price also closed above the 50-day EMA. The RSI just moved into positive territory and there is a brand new PMO Crossover BUY Signal. Stochastics are rising toward 80 in positive territory. The group is beginning to outperform again and ADBE is outperforming the group. The stop is set beneath support at 7.3% or $536.86."
Here is today's chart:
I took a chance on this one as I discussed above. There is one reason this stock selection failed and that was earnings. This could have been avoided and I apologize for this pick. I was already having second thoughts during trading yesterday as price was already losing the breakout. I will say that the setup was very good technically on Tuesday; earnings spoiled it.
THIS WEEK's Performance:
DecisionPoint Market Scoreboard (Mechanical Trend Model Signals):
Click Here to view Carl's annotated "Under the Hood" ChartList!
Sector to Watch: Energy (XLE)
Energy was the clear winner today, but I do have some reservations. Participation is about as high as you can get and therefore the only place left for them to go is down. As they say, this get as good as they're going to get before the fall. We could see XLE pull back here at overhead resistance given the RSI is overbought, but I suspect that we are going to see more rotation into this sector given the weakness pervading all other sector charts.
Industry Group to Watch: Oil Equipment & Services (XES)
This chart is following the Crude Oil chart in that it also has a cup shaped basing pattern that is leading into the rally. The RSI is somewhat overbought, but I'm expecting more upside in this sector and particularly this industry group. The PMO is rising above the zero line on a Crossover BUY Signal. Stochastics are above 80 and even the OBV is confirming the rally with its own rising trend. I've set the stop for this ETF at the 200-day EMA. A few symbols of interest: NBR, AESI and RIG.
Go to our Under the Hood ChartList on DecisionPoint.com to get an in-depth view of all the sectors. On StockCharts.com you can find the Industry Summary.
Good Luck & Good Trading!
- Erin
erin@decisionpoint.com
Full Disclosure: I'm 70% long, 0% short.
Watch the latest episode of the DecisionPoint Trading Room with Carl & Erin Swenlin on Mondays 3:00p EST!
Technical Analysis is a windsock, not a crystal ball. --Carl Swenlin
NOTE: The stocks reported herein are from mechanical trading model scans that are based upon moving average relationships, momentum and volume. DecisionPoint analysis is then applied to get selections from the scans. The selections given should prompt readers to do a chart review using their own analysis process. This letter is not a call for a specific action to buy, sell or short any of the stocks provided. There are NO sure things or guaranteed returns on the selection of "diamonds in the rough."
Helpful DecisionPoint Links:
DecisionPoint Shared ChartList and DecisionPoint Chart Gallery
Price Momentum Oscillator (PMO)
Swenlin Trading Oscillators (STO-B and STO-V)
(c) Copyright 2024 DecisionPoint.com