
In an interesting turn of events, I only received requests from one person so I went ahead and ran some of my scans to see if I could find one to add for you.
When I ran my scans, I came up with two Magnificent 7 stocks, one of which was requested, Microsoft (MSFT). The other Mag7 stock of interest was Google (GOOGL). It had been one of the weakest of the bunch, but it has made a nice turn around. I'm going to include MSFT as it has a very nice looking chart right now. My selection today is EQH.
I'm a bit under the weather so I'll close here. See you in the Diamond Mine tomorrow where we will try to suss out more symbols of interest.
Good Luck & Good Trading,
Erin
Today's "Diamonds in the Rough": EQH, MSFT and STNG.
Other requests and symbols I found: WST, CVX, NEM, CNM, GOOGL and MOH.

RECORDING & DOWNLOAD LINK (3/8/2024):
Topic: DecisionPoint Diamond Mine (3/8/2024) LIVE Trading Room
Recording & Download LINK
Passcode: March#8th
REGISTRATION for 3/15/2024:
When: Mar 15, 2024 09:00 AM Pacific Time (US and Canada)
Topic: DecisionPoint Diamond Mine (3/15/2024) LIVE Trading Room
Register in advance for this webinar HERE
After registering, you will receive a confirmation email containing information about joining the webinar.

Here is the latest recording from 3/11. Click HERE to subscribe to the DecisionPoint YouTube Channel to be notified when new content is available.
Welcome to DecisionPoint Diamonds, wherein I highlight ten "Diamonds in the Rough" per week. These are selected from the results of my DecisionPoint Scans which search for stocks that could benefit from the trend and condition of the market. Remember, these are not recommendations to buy or sell, but are the most interesting of the stocks that surfaced in my scans. My objective is to save you the work of the initial, tedious culling process, but you need to apply your own analysis to see if these stocks pique your interest as well. There are no guaranteed winners here!
"Predefined Scans Triggered" are taken from StockCharts.com using the "Symbol Summary" option instead of a "SharpChart" on the workbench.
Stop levels are all rounded down.
Equitable Holdings, Inc. (EQH)
EARNINGS: 05/01/2024 (AMC)
Equitable Holdings, Inc. engages in the provision of financial services. It operates through the following segments: Individual Retirement, Group Retirement, Investment Management and Research, Protection Solutions, Wealth Management, Legacy, and Corporate and Other. The Individual Retirement segment includes annuity products, which primarily meet the needs of individuals saving for retirement or seeking retirement income. The Group Retirement segment offers tax-deferred investment and retirement services or products to plans sponsored by educational entities, municipalities and not-for-profit entities, as well as small and medium-sized businesses. The Investment Management and Research segment provides investment management, research and related services. The Protection Solutions segment focuses on life insurance products on attractive protection segments such as VUL insurance and IUL insurance and employee benefits business on small and medium-sized businesses. The Wealth Management segment refers to the discretionary and non-discretionary investment advisory accounts, financial planning and advice, insurance, and annuity products. The Legacy segment consists of capital intensive fixed-rate GMxB business written in the Individual Retirement market prior to 2011. The company was founded by Henry B. Hyde in 1859 and is headquartered in New York, NY.
Predefined Scans Triggered: New 52-week Highs, P&F Ascending Triple Top Breakout and P&F Double Top Breakout.
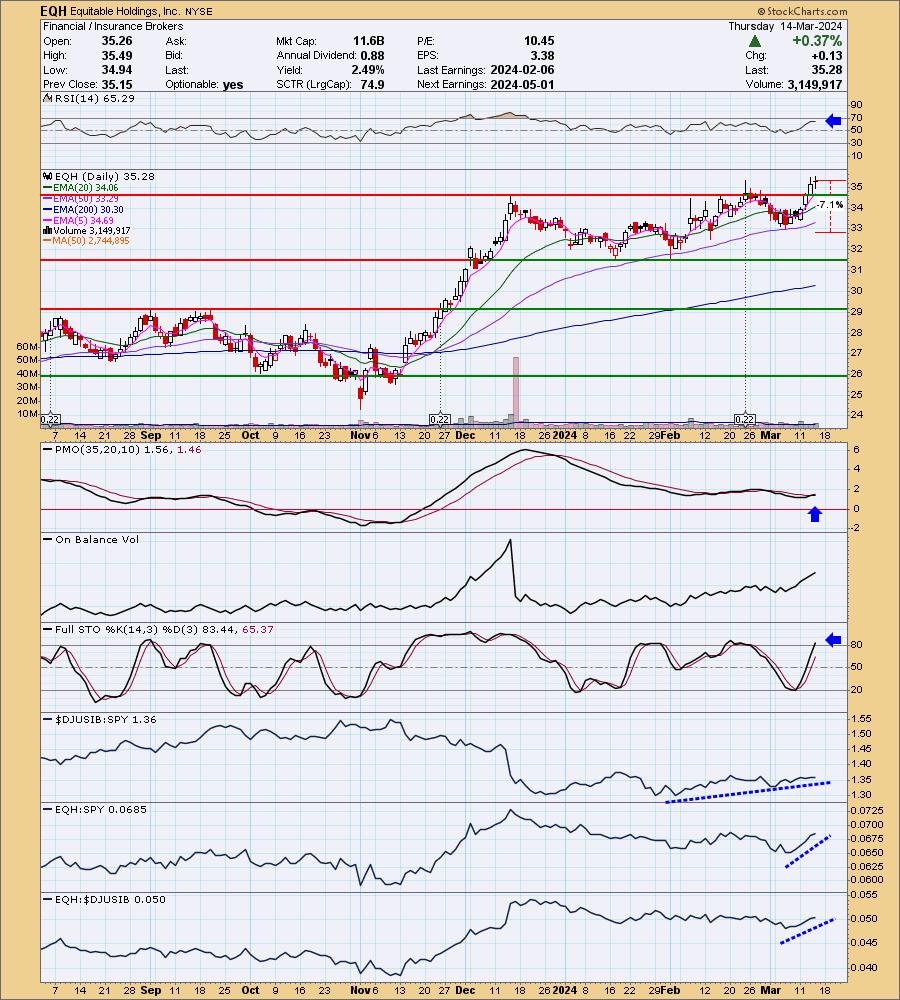
EQH is unchanged in after hours trading. I like the recent breakout that saw follow through today. The RSI is positive and not overbought. I like that the PMO is flat above the zero line and has just given us a Crossover BUY Signal. Stochastics have just moved above 80 and relative strength is rising for the group and EQH. I've set the stop beneath support at 7.1% or $32.77.
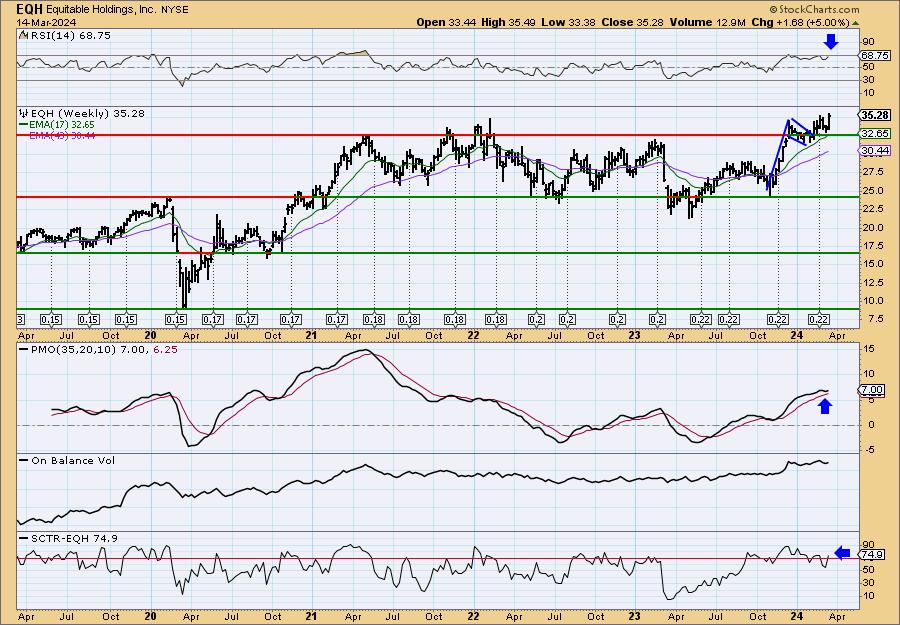
Price is rising out of a bull flag that suggests an upside target around $45. The RSI is not overbought yet and the weekly PMO has surged above the signal line well above the zero line. The StockCharts Technical Rank (SCTR) is inside the hot zone* above 70. Based on the flag formation the upside potential is around 27%.
*If a stock is in the "hot zone" above 70, it implies that it is stronger than 70% of its universe (large-, mid-, small-caps and ETFs) primarily in the intermediate to long terms.
Microsoft Corp. (MSFT)
EARNINGS: 04/30/2024 (AMC)
Microsoft Corp. engages in the development and support of software, services, devices, and solutions. It operates through the following business segments: Productivity and Business Processes, Intelligent Cloud, and More Personal Computing. The Productivity and Business Processes segment consists of Office Commercial (Office 365 subscriptions, the Office 365 portion of Microsoft 365 Commercial subscriptions, and Office licensed on-premises), Exchange, SharePoint, Microsoft Teams, Office 365 Security and Compliance, and Skype for Business, Office Consumer, including Microsoft 365 Consumer subscriptions, Office licensed on-premises, and other Office services, LinkedIn, including Talent Solutions, Marketing Solutions, Premium Subscriptions, Sales Solutions, and Learning Solutions, Dynamics business solutions, including Dynamics 365, comprising a set of intelligent, cloud-based applications across ERP, CRM, Customer Insights, Power Apps, and Power Automate, and on-premises ERP and CRM applications. The Intelligent Cloud segment consists of Server products and cloud services, including Azure and other cloud services, SQL Server, Windows Server, Visual Studio, System Center, and related Client Access Licenses (CALs), and Nuance and GitHub, Enterprise Services, including Enterprise Support Services, Microsoft Consulting Services, and Nuance professional services. The More Personal Computing segment consists of Windows, including Windows OEM licensing and other non-volume licensing of the Windows operating system, Windows Commercial, comprising volume licensing of the Windows operating system, Windows cloud services, and other Windows commercial offerings, patent licensing, and Windows Internet of Things, Devices, including Surface and PC accessories, Gaming, including Xbox hardware and Xbox content and services, comprising digital transactions, Xbox Game Pass and other subscriptions, video games, third-party video game royalties, cloud services, and advertising, Search and news advertising. The company was founded by Paul Gardner Allen and William Henry Gates, III in 1975 and is headquartered in Redmond, WA.
Predefined Scans Triggered: New 52-week Highs, Stocks in a New Uptrend (ADX), Moved Above Upper Bollinger Band, Stocks in a New Uptrend (Aroon), Moved Above Upper Price Channel and P&F Double Top Breakout.
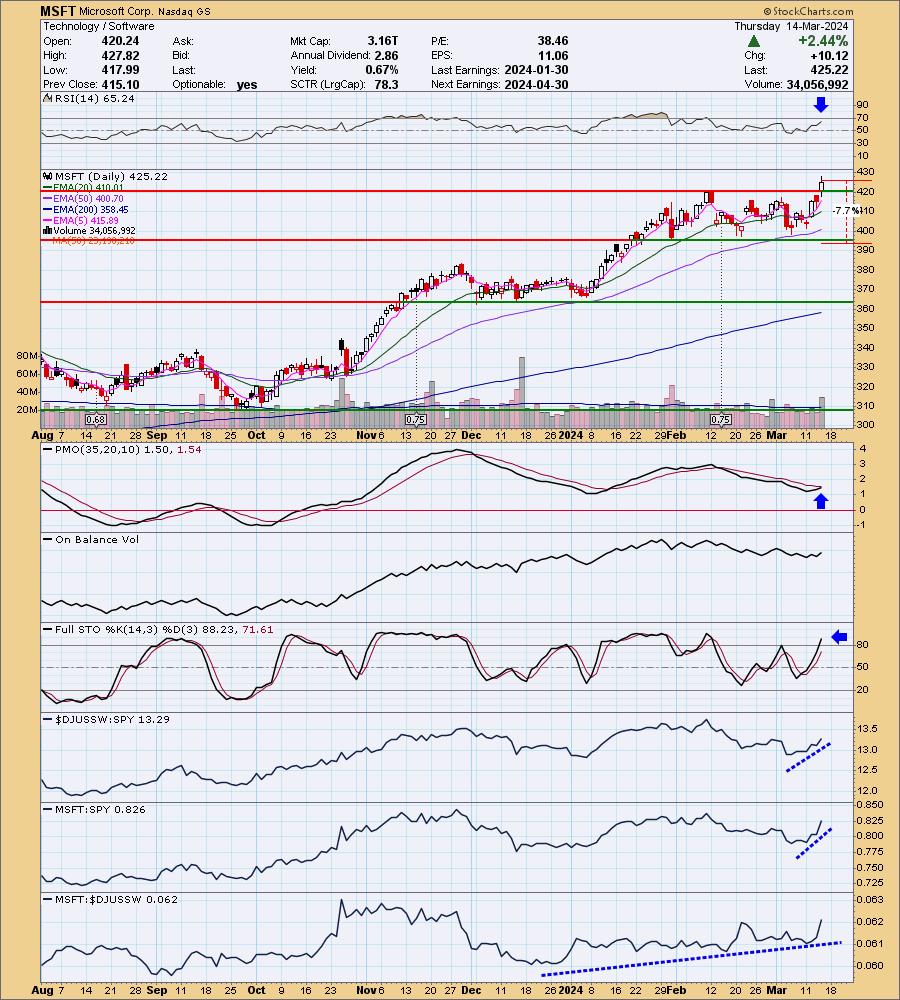
MSFT is up +0.23% in after hours trading. This breakout from the trading range looks very good and is really one of the main reasons I selected this reader request. It helped that it came up in my own scans as well. The RSI is rising and is not overbought. The PMO is nearing a Crossover BUY Signal. Stochastics are above 80. The Software group is beginning to outperform and MSFT is a clear leader (no surprise here) within the group so look for it to continue to do well. The stop is set beneath support at 7.7% or $392.47.
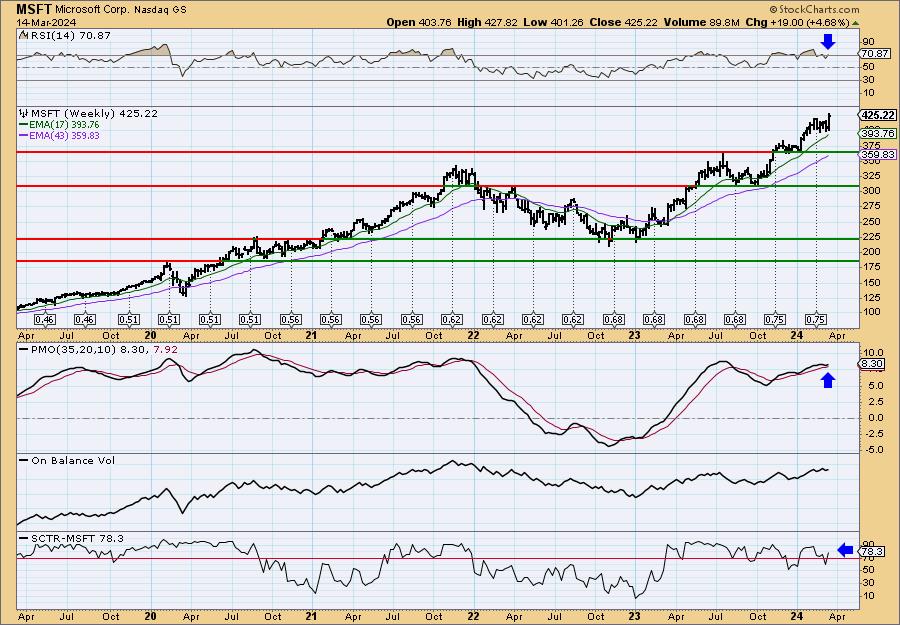
We an excellent weekly chart. I'm not happy with the weekly RSI entering overbought territory, but it has been there for months. The weekly PMO looks great. It is well above the zero line and has just surged above the signal line. The SCTR is in the hot zone. You could consider MSFT for an intermediate-term hold. Consider an upside target of about 19% or $506.01.
Scorpio Tankers Inc. (STNG)
EARNINGS: 04/30/2024 (BMO)
Scorpio Tankers, Inc. engages in the provision of marine transportation of petroleum products. Its consists of wholly owned, finance leased, and bareboat chartered-in tankers. It operates through the following segments: MR, LR2, Handymax, and LR1. The company was founded by Emanuele A. Lauro on July 1, 2009 and is headquartered in Monaco.
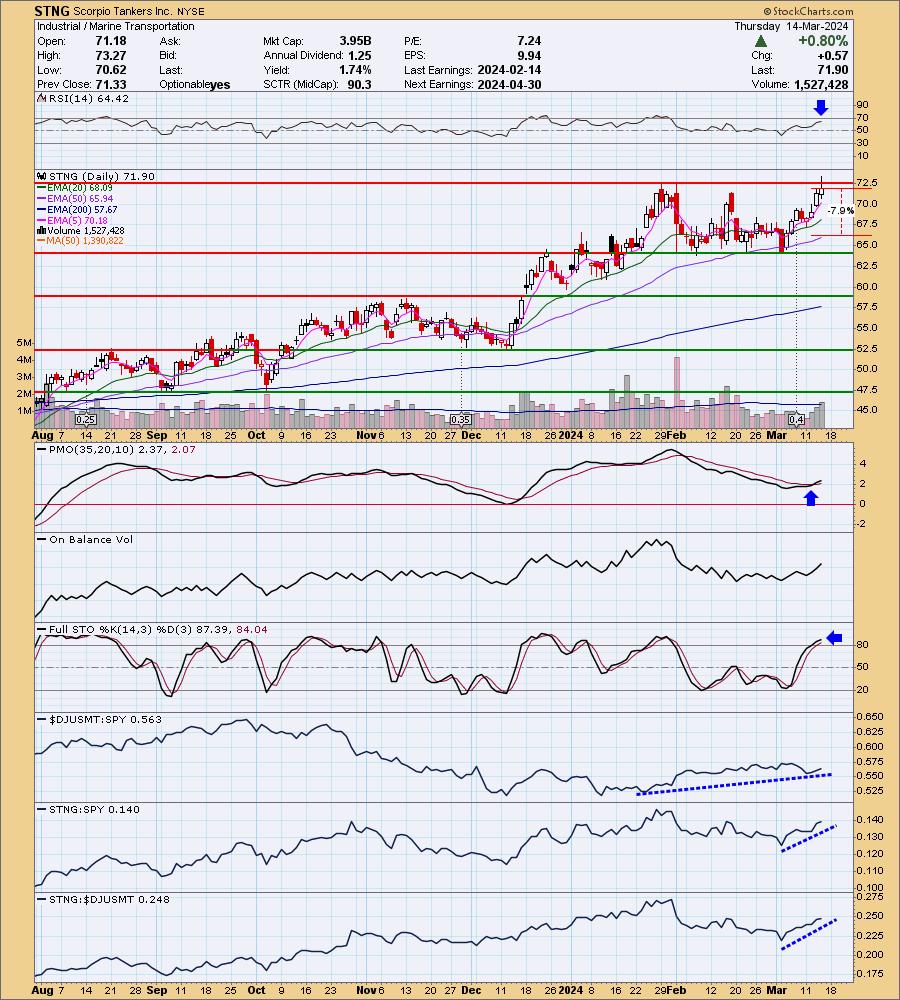
Predefined Scans Triggered: New 52-week Highs, Moved Above Upper Price Channel and P&F Double Top Breakout.
STNG is unchanged in after hours trading. It hasn't broken out yet, but the stage has been set. The RSI is positive and not overbought. There is a fairly new PMO Crossover BUY Signal above the zero line and Stochastics are above 80. The group is showing relative strength and STNG is showing strength against both the SPY and the group. I've set the stop near the 50-day EMA at 7.9% or $66.21.
As with the other two, the weekly PMO has surged above the signal line. It is above the zero line and is not overbought. The weekly RSI is rising and is not overbought. The SCTR is in the hot zone. I think this one could be considered for the intermediate term.
Don't forget, on Thursdays I look at reader-requested symbols, click HERE to send me an email. I read every email I receive and try to answer them all!
Current Market Outlook:
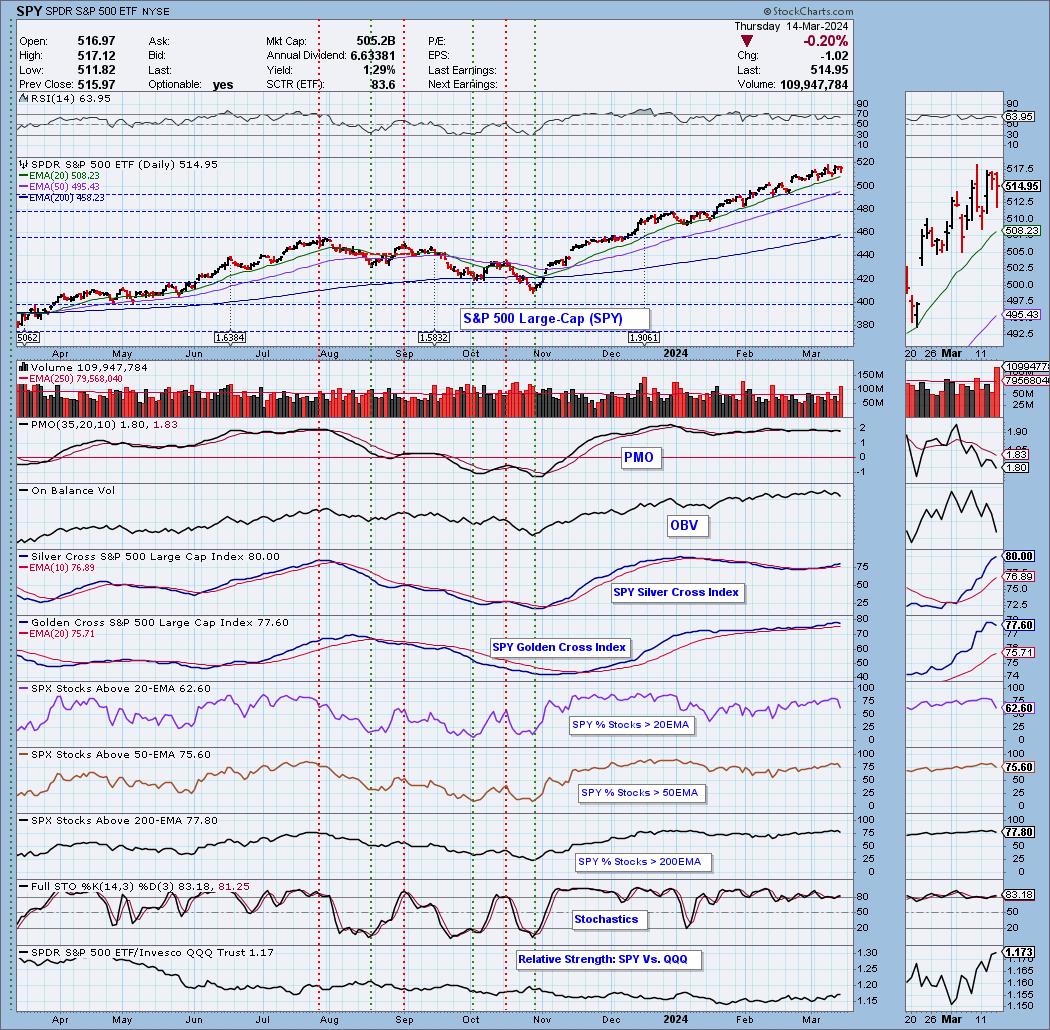
Market Environment: It is important to consider the odds for success by assessing the market tides. The following chart uses different methodologies for objectively showing the depth and trend of participation for intermediate- and long-term time frames.
- The Silver Cross Index (SCI) shows the percentage of SPX stocks on IT Trend Model BUY signals (20-EMA > 50-EMA)
- The Golden Cross Index (GCI) shows the percentage of SPX stocks on LT Trend Model BUY signals (50-EMA > 200-EMA)
Don't forget that as a "Diamonds" member, you have access to our GCI/SCI curated ChartList on DecisionPoint.com. You'll find it under "Members Only" links on the left side on the Blogs and Links Page.
Here is the current chart:
Full Disclosure: I am 75% long, 0% short.
I'm required to disclose if I currently own a stock I mention and/or may buy/short it within the next 72 hours.
"Technical Analysis is a windsock, not a crystal ball." - Carl Swenlin
(c) Copyright 2024 DecisionPoint.com
Watch the latest episode of DecisionPoint Trading Room with Carl & Erin Swenlin Mondays on the DecisionPoint YouTube channel here!
NOTE: The stocks reported herein are from mechanical trading model scans that are based upon moving average relationships, momentum and volume. DecisionPoint analysis is then applied to get five selections from the scans. The selections given should prompt readers to do a chart review using their own analysis process. This letter is not a call for a specific action to buy, sell or short any of the stocks provided. There are NO sure things or guaranteed returns on the daily selection of "Diamonds in the Rough."
Regarding BUY/SELL Signals: The signal status reported herein is based upon mechanical trading model signals and crossovers. They define the implied bias of the price index/stock based upon moving average relationships and momentum, but they do not necessarily call for a specific action. They are information flags that should prompt chart review. Further, they do not call for continuous buying or selling during the life of the signal. For example, a BUY signal will probably (but not necessarily) return the best results if action is taken soon after the signal is generated. Additional opportunities for buying may be found as price zigzags higher, but the trader must look for optimum entry points. Conversely, exit points to preserve gains (or minimize losses) may be evident before the model mechanically closes the signal.
Helpful DecisionPoint Links:
Price Momentum Oscillator (PMO)
Swenlin Trading Oscillators (STO-B and STO-V)
For more links, go to DecisionPoint.com