
Here is a quick reminder on the schedule change for this week:
Monday - Four picks
Tuesday - Three ETF picks
Wednesday - Reader Request Day (Send them in!)
Thursday - Diamond Mine trading room and Diamonds Recap
There was a clear theme in today's scan results and that was "international". I had numerous ETFs that cover international equities come through today so I decided to go with it. I have a Eurozone ETF and the Germany ETF.
My last pick is taking advantage of new strength in the Defense group. I have a new ETF that hasn't been around that long. It has a good record as far as I can tell and it covers an area of the market that I really like right now.
Good Luck & Good Trading,
Erin
Today's "Diamonds in the Rough": EWG, EZU and SHLD.
Runner-ups: EWU, EWJV and EWD (you can pick almost any international ETF right now and it is bullish).

Diamond Mine Trading Room:
RECORDING & DOWNLOAD LINK (4/11/2025):
Topic: DecisionPoint Diamond Mine (4/11/2025) LIVE Trading Room
Recording & Download Link
Passcode: April#11
REGISTRATION for 4/17/2025:
When: April 17, 2025 09:00 AM Pacific Time (US and Canada)
Topic: DecisionPoint Diamond Mine LIVE Trading Room
Register in advance for this webinar HERE
After registering, you will receive a confirmation email containing information about joining the webinar.

Below is the latest free DecisionPoint Trading Room recording from 4/14. You'll find these recordings posted on Mondays to our DP YouTube Channel. Be sure and subscribe HERE.
Welcome to DecisionPoint Diamonds, wherein I highlight ten "Diamonds in the Rough" per week. These are selected from the results of my DecisionPoint Scans which search for stocks that could benefit from the trend and condition of the market. Remember, these are not recommendations to buy or sell, but are the most interesting of the stocks that surfaced in my scans. My objective is to save you the work of the initial, tedious culling process, but you need to apply your own analysis to see if these stocks pique your interest as well. There are no guaranteed winners here!
"Predefined Scans Triggered" are taken from StockCharts.com using the "Symbol Summary" option instead of a "SharpChart" on the workbench.
Stop levels are all rounded down.
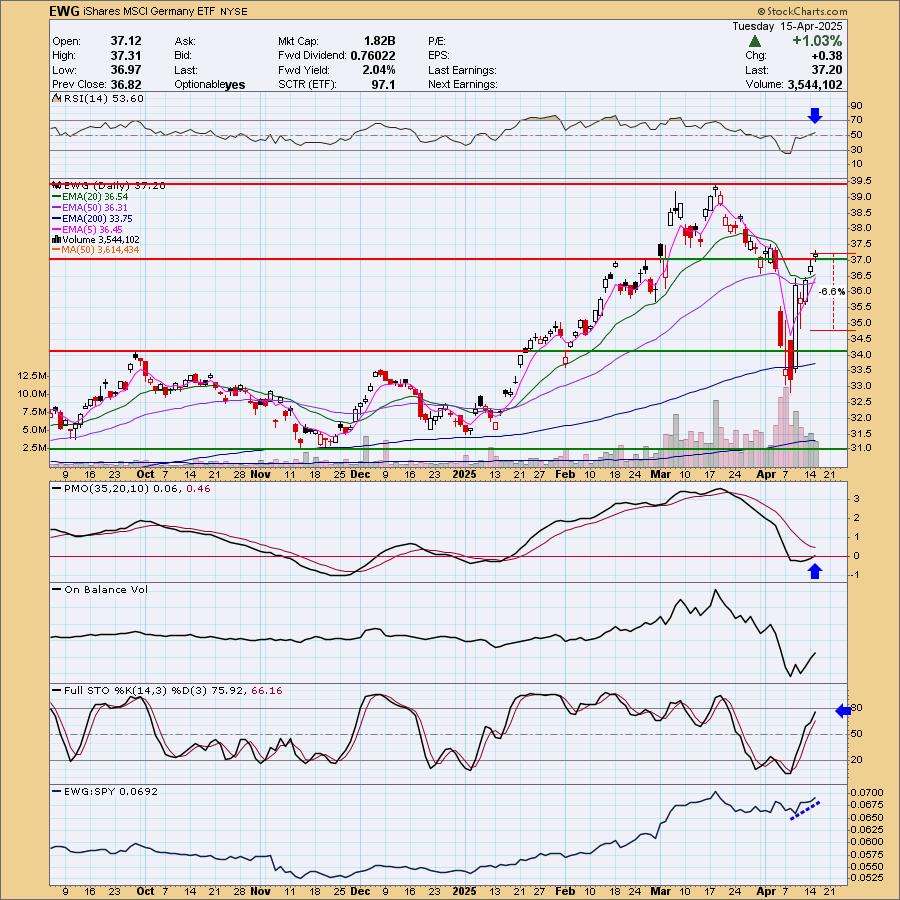
iShares MSCI Germany ETF (EWG)
EARNINGS: N/A
EWG tracks a market cap-weighted index of large- and mid-cap German companies. Click HERE for more information.
Predefined Scans Triggered: Bullish MACD Crossovers and Moved Above Ichimoku Cloud.
EWG is up +0.54% in after hours trading. Price has broken out from near-term resistance at the February high. We have a "V" bottom that has retraced more than a 1/3 of the left side of the pattern so we should expect a breakout above the March high. The RSI just moved into positive territory so it is far from overbought despite this healthy rally. The PMO just moved above the zero line and is headed toward a Crossover BUY Signal. Volume is coming in based on the On Balance Volume (OBV). Stochastics look very strong as they head toward territory above 80. We even have some outperformance happening on this ETF. The stop is set arbitrarily at 6.6% or $34.74.
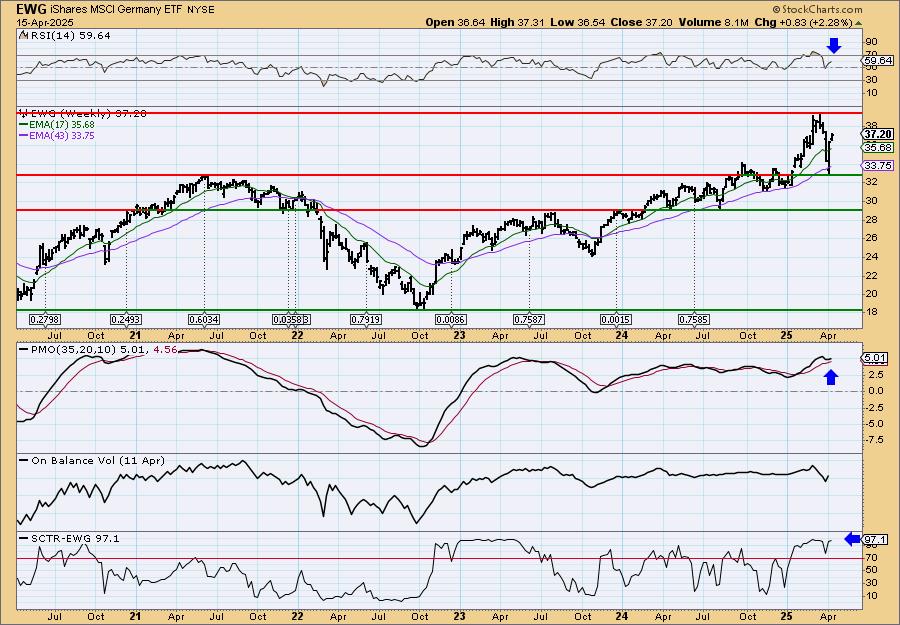
I like this bounce off strong support at the 2021 high. The weekly RSI is positive and not overbought. The weekly PMO is surging (bottoming) above the signal line. The StockCharts Technical Rank (SCTR) is excellent as it is at the top of the hot zone*. Consider a 17% upside target to about $43.52.
*If a stock is in the "hot zone" above 70, it implies that it is stronger than 70% of its universe (large-, mid-, small-caps and ETFs) primarily in the intermediate to long terms.
iShares MSCI Eurozone ETF (EZU)
EARNINGS: N/A
EZU tracks a market cap-weighted index of large- and mid-cap companies from countries that use the euro. Click HERE for more information.
Predefined Scans Triggered: None.
EZU is down -1.45% in after hours trading unfortunately but anything can happen the next day. I like the "V" bottom pattern that implies an upside breakout above the March high. Price has broken above strong resistance at the September top. Price is above all key moving averages. The RSI is barely positive so it has room to run higher before getting overbought. The PMO has turned up. Volume is coming in based on the OBV. Stochastics are almost above 80 and we can see a little outperformance against the SPY. The stop is set beneath the 200-day EMA at 6% or $49.89.

The breakout looks encouraging on the weekly chart. The weekly RSI is positive and not overbought. The weekly PMO is surging above the signal line and zero line. The SCTR is at the top of the hot zone. Consider a 17% upside target to about $62.10.

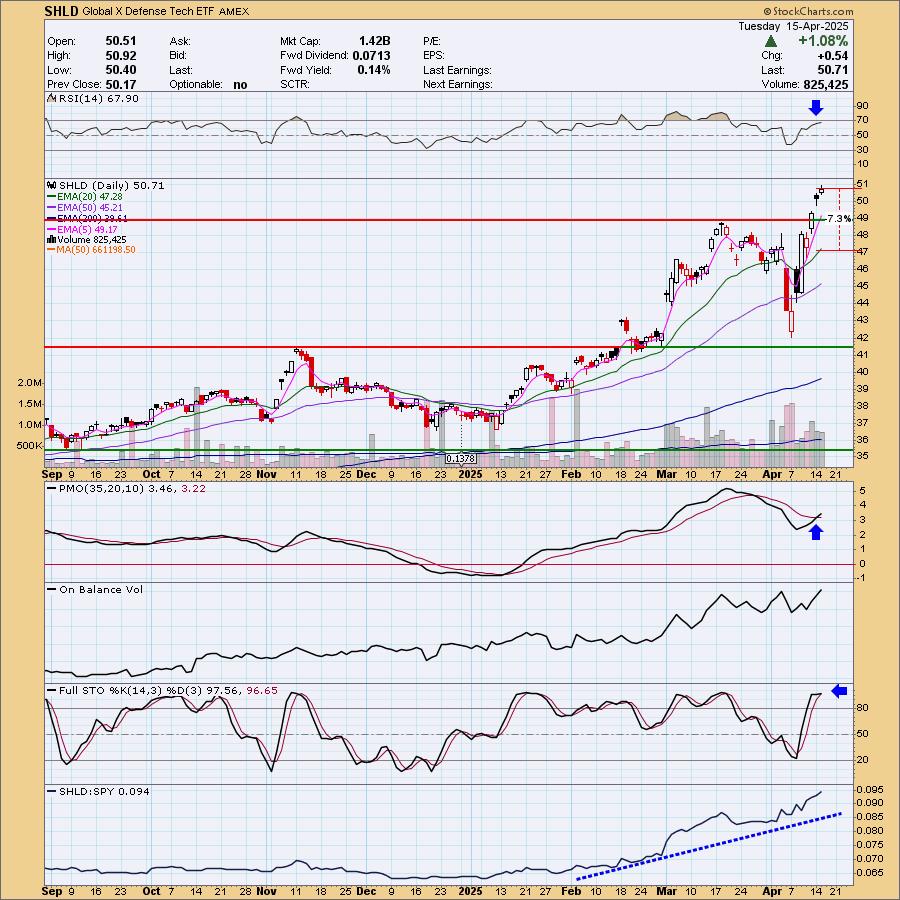
Global X Defense Tech ETF (SHLD)
EARNINGS: N/A
SHLD tracks a modified market-cap weighted index of the top 50 pure-play defense technology companies from around the world. These companies are considered best positioned to benefit from increased governmental defense spending. Click HERE for more information.

Predefined Scans Triggered: New 52-week Highs and P&F Double Top Breakout.
SHLD is up +0.75% in after hours trading. I really liked the breakout move. Would've loved to have seen this one two days ago. The RSI is not yet overbought so this rally should have legs for awhile longer. The PMO is on a new Crossover BUY Signal. Stochastics are hovering above 80 and we can see incredible relative strength. I set the stop beneath the 20-day EMA at 7.3% or $47.01.
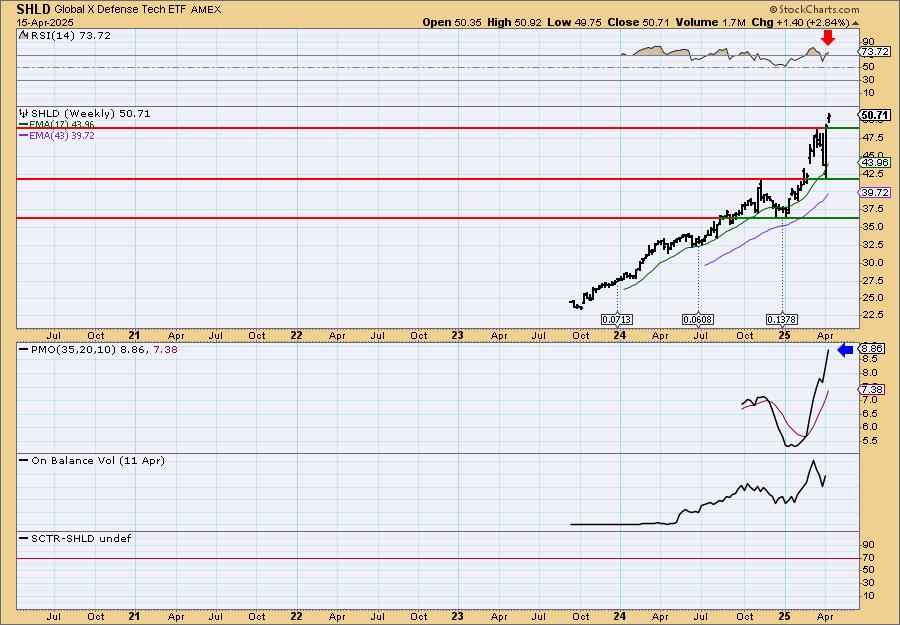
The weekly chart is strong given the steady rising trend. The weekly RSI is a little overbought, but this one spends a lot of time in overbought territory so I'm okay with that. The weekly PMO is rising strongly well above the zero line. Consider a 17% upside target to about $59.33.
Don't forget, on Thursdays I look at reader-requested symbols, click HERE to send me an email. I read every email I receive and try to answer them all!
Current Market Outlook:
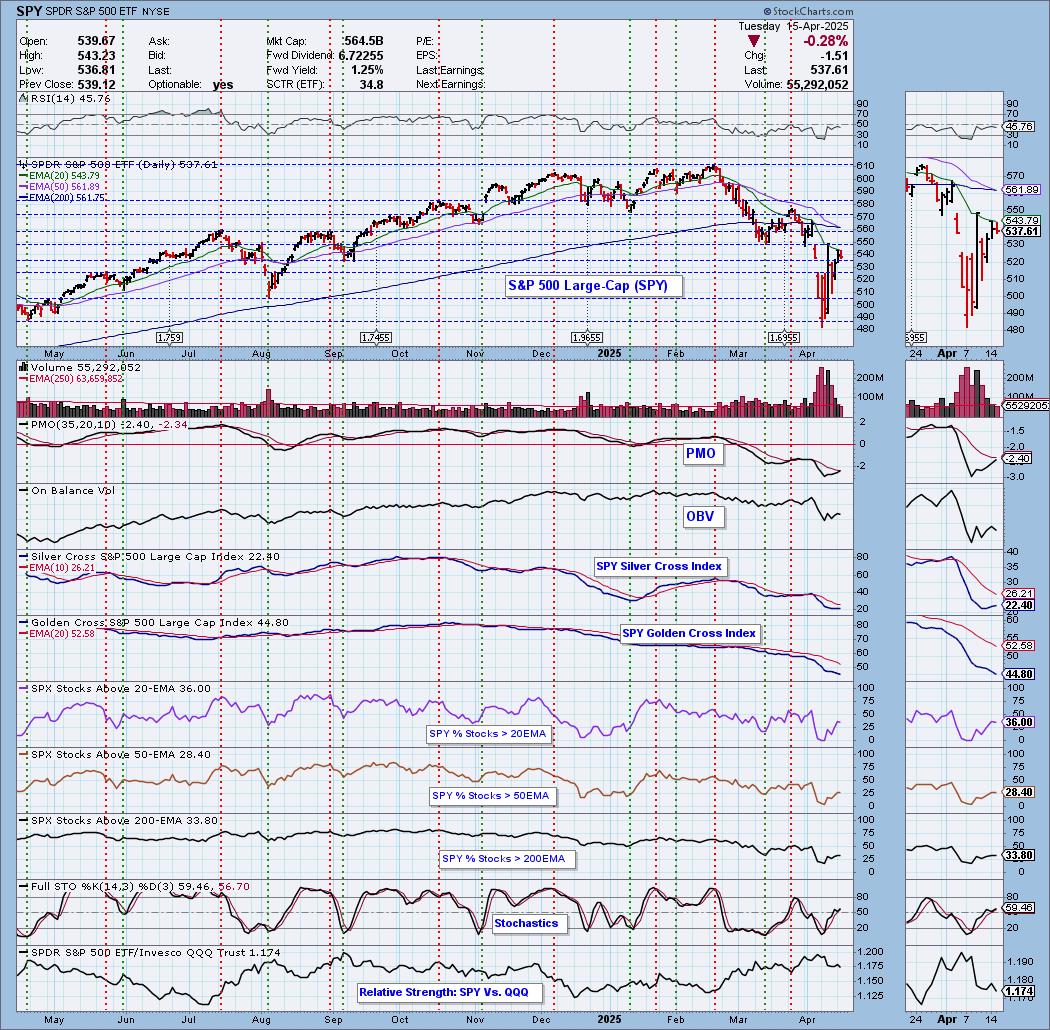
Market Environment: It is important to consider the odds for success by assessing the market tides. The following chart uses different methodologies for objectively showing the depth and trend of participation for intermediate- and long-term time frames.
- The Silver Cross Index (SCI) shows the percentage of SPX stocks on IT Trend Model BUY signals (20-EMA > 50-EMA)
- The Golden Cross Index (GCI) shows the percentage of SPX stocks on LT Trend Model BUY signals (50-EMA > 200-EMA)
Don't forget that as a "Diamonds" member, you have access to our "Under the Hood" curated ChartList on DecisionPoint.com. You'll find it under "Members Only" links on the left side on the Blogs and Links Page.
Here is the current chart:
Full Disclosure: I am 10% long, 0% short.
I'm required to disclose if I currently own a stock I mention and/or may buy/short it within the next 72 hours.
"Technical Analysis is a windsock, not a crystal ball." - Carl Swenlin
(c) Copyright 2025 DecisionPoint.com
Watch the latest episode of DecisionPoint Trading Room with Carl Swenlin & Erin Swenlin Mondays on the DecisionPoint YouTube channel here!
NOTE: The stocks reported herein are from mechanical trading model scans that are based upon moving average relationships, momentum and volume. DecisionPoint analysis is then applied to get five selections from the scans. The selections given should prompt readers to do a chart review using their own analysis process. This letter is not a call for a specific action to buy, sell or short any of the stocks provided. There are NO sure things or guaranteed returns on the daily selection of "Diamonds in the Rough."
Regarding BUY/SELL Signals: The signal status reported herein is based upon mechanical trading model signals and crossovers. They define the implied bias of the price index/stock based upon moving average relationships and momentum, but they do not necessarily call for a specific action. They are information flags that should prompt chart review. Further, they do not call for continuous buying or selling during the life of the signal. For example, a BUY signal will probably (but not necessarily) return the best results if action is taken soon after the signal is generated. Additional opportunities for buying may be found as price zigzags higher, but the trader must look for optimum entry points. Conversely, exit points to preserve gains (or minimize losses) may be evident before the model mechanically closes the signal.
Helpful DecisionPoint Links:
Price Momentum Oscillator (PMO)
Swenlin Trading Oscillators (STO-B and STO-V)
For more links, go to DecisionPoint.com