
As you probably noticed, since I'm sending out a report today, this week's schedule has been changed to accommodate the holiday on Friday. Here's what to expect:
Monday - Four picks
Tuesday - Three ETF picks
Wednesday - Reader Request Day
Thursday - Diamond Mine trading room and Diamonds Recap
It is rough to make stock picks right now so I appreciate your patience as we've been jerked around by this volatile market. I noticed today that I only had two shorts come through on the Diamond Dog Scan so I decided to go long today as there were a good amount of results for my other scans.
I did take two selections from the strong Consumer Staples sector and the other two are from Health Care and an Industrial. I opted to pass on the Consumer Discretionary and Technology stocks that came up as I'm not that confident about this current rally yet.
I like the Defense group right now and was pleased to have found one in the scans that looked bullish.
Good Luck & Good Trading,
Erin
Today's "Diamonds in the Rough": HII, HSY, KR and LNTH.
Runner-ups: PLNT, YOU, AWR, NRG and RBC.

Diamond Mine Trading Room:
RECORDING & DOWNLOAD LINK (4/11/2025):
Topic: DecisionPoint Diamond Mine (4/11/2025) LIVE Trading Room
Recording & Download Link
Passcode: April#11
REGISTRATION for 4/17/2025:
When: April 17, 2025 09:00 AM Pacific Time (US and Canada)
Topic: DecisionPoint Diamond Mine LIVE Trading Room
Register in advance for this webinar HERE
After registering, you will receive a confirmation email containing information about joining the webinar.

Below is the latest free DecisionPoint Trading Room recording from 4/14. You'll find these recordings posted on Mondays to our DP YouTube Channel. Be sure and subscribe HERE.
Welcome to DecisionPoint Diamonds, wherein I highlight ten "Diamonds in the Rough" per week. These are selected from the results of my DecisionPoint Scans which search for stocks that could benefit from the trend and condition of the market. Remember, these are not recommendations to buy or sell, but are the most interesting of the stocks that surfaced in my scans. My objective is to save you the work of the initial, tedious culling process, but you need to apply your own analysis to see if these stocks pique your interest as well. There are no guaranteed winners here!
"Predefined Scans Triggered" are taken from StockCharts.com using the "Symbol Summary" option instead of a "SharpChart" on the workbench.
Stop levels are all rounded down.
Huntington Ingalls Industries Inc. (HII)
EARNINGS: 2025-05-01 (BMO)
Huntington Ingalls Industries, Inc. engages in the shipbuilding business. It operates through the following business segments: Ingalls, Newport News, and Mission Technologies. The Ingalls segment designs and constructs non-nuclear ships, including amphibious assault ships, expeditionary warfare ships, surface combatants, and national security cutters (NSC). The Newport News segment designs and builds nuclear-powered aircraft carriers and submarines, and the refueling and overhaul and the inactivation of nuclear-powered aircraft carriers. The Mission Technologies segment includes business groups focused on high-end information technology (IT) and mission-based solutions for DoD, intelligence, and federal civilian customers, life-cycle sustainment services to the U.S. Navy fleet and other maritime customers, unmanned, autonomous systems, and nuclear management and operations and environmental management services for the Department of Energy (DoE), DoD, state and local governments, and private sector companies. The company was founded on August 4, 2010 and is headquartered in Newport News, VA.
Predefined Scans Triggered: Moved Above Upper Bollinger Band and P&F Double Top Breakout.
HII is down -1.11% in after hours trading so it is taking back some of today's gain. It's a nice breakout from a trading range and a move above the 200-day EMA. We have a rising trend on the chart which is very hard to find right now. The RSI is not yet overbought. There is a new PMO Crossover BUY Signal. It held the highest PMO value today in the scans. Volume is definitely coming in based on the OBV. Stochastics are very bullish above 80. Relative strength is excellent across the board for the group and HII. The stop is rather deep, but I wanted to get it to the bottom of gap support. I chose 7.9% or $202.57.
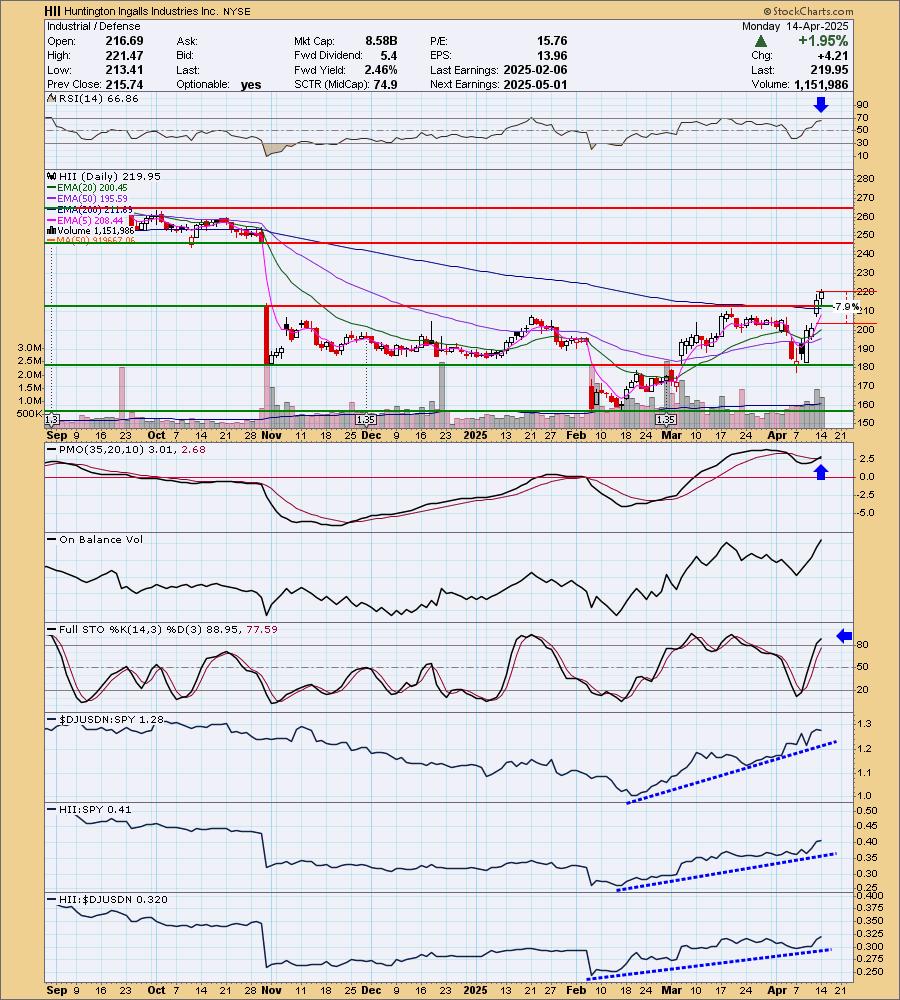
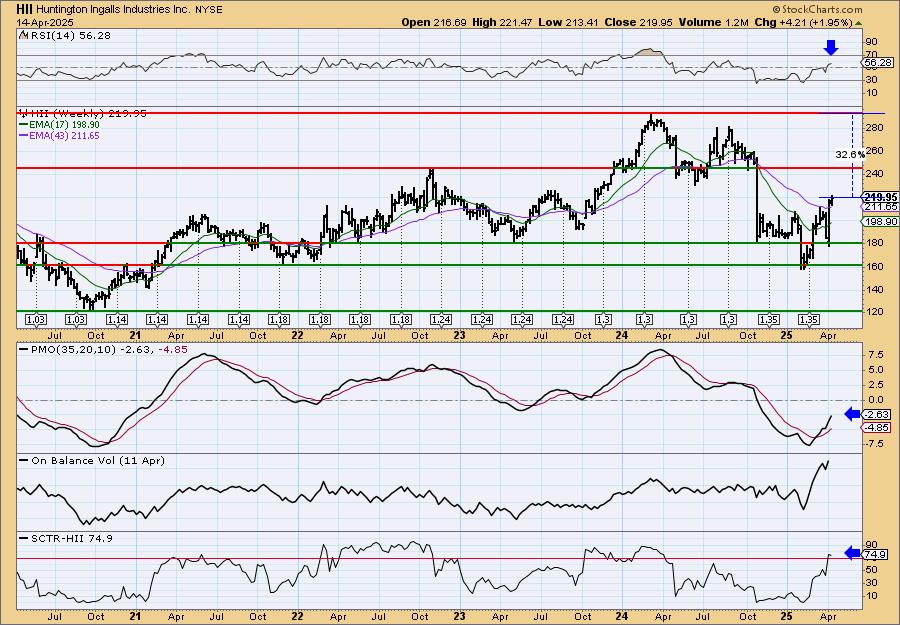
We're seeing a bounce off the bottom of a long-term trading range. The weekly RSI is positive and not overbought and the weekly PMO looks especially bullish as it rises toward the zero line on a Crossover BUY Signal. The StockCharts Technical Rank (SCTR) is in the hot zone* above 70. If we get the breakout it would be a 11% gain, but I think it could move higher than that.
*If a stock is in the "hot zone" above 70, it implies that it is stronger than 70% of its universe (large-, mid-, small-caps and ETFs) primarily in the intermediate to long terms.
Hershey Foods Corp. (HSY)
EARNINGS: 2025-05-01 (BMO)
The Hershey Co. engages in the manufacture and marketing of chocolate, sweets, mints and confectionery products. The firm operates through the following segments: North America Confectionery, North America Salty Snacks and International. The North America Confectionery segment is responsible for the traditional chocolate and non-chocolate confectionery market position of the company, as well as its grocery and snacks market positions, in the United States and Canada. The North America Salty Snacks segment is responsible for the salty snack products in the United States. The International segment includes the combination of all other operating segments, including those geographic regions where the company operates outside of North America. Its brands include Hershey's, Reese's, and Kisses. The company was founded by Milton S. Hershey in 1894 and is headquartered in Hershey, PA.
Predefined Scans Triggered: Bullish MACD Crossovers, Parabolic SAR Buy Signals and P&F Double Top Breakout.
HSY is down -0.01% in after hours trading so it isn't taking much back from today's strong rally. Price has rallied out of a bullish falling wedge. The RSI only just hit positive territory. The PMO has turned up toward a Crossover BUY Signal. There is a very positive OBV divergence with price lows falling and OBV lows rising. Stochastics are now in positive territory and we see rising relative strength across the board. This is definitely one of my favorites today primarily due to that positive OBV divergence. The stop is set below support at 8% or $156.67.
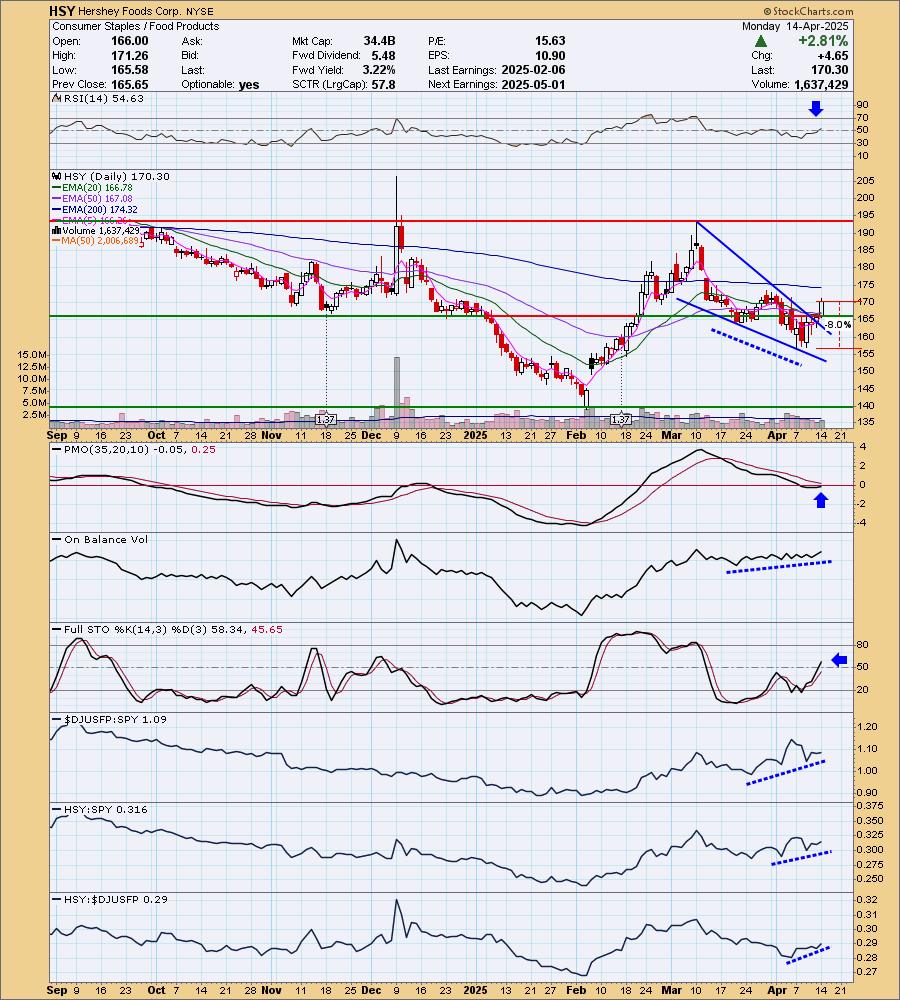
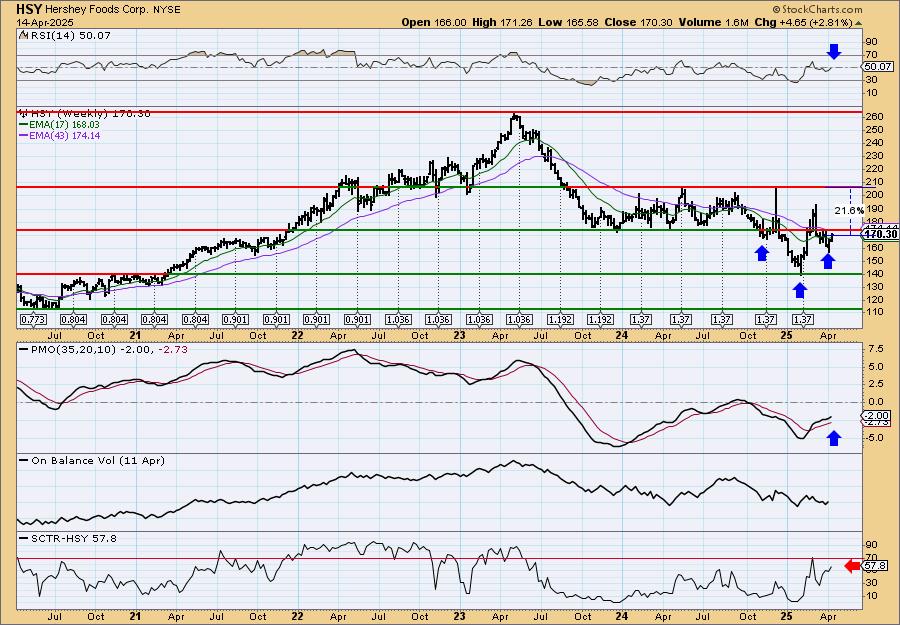
Mixed bag on the weekly chart. I don't like that price hasn't overcome resistance, but there is a bullish reverse head and shoulders working for it. The weekly RSI just entered positive territory and the weekly PMO looks quite bullish as it rises toward the zero line on a Crossover BUY Signal. One negative is that the SCTR is not in the hot zone. I'll accept it as it is rising and looks ready to get back into the zone.
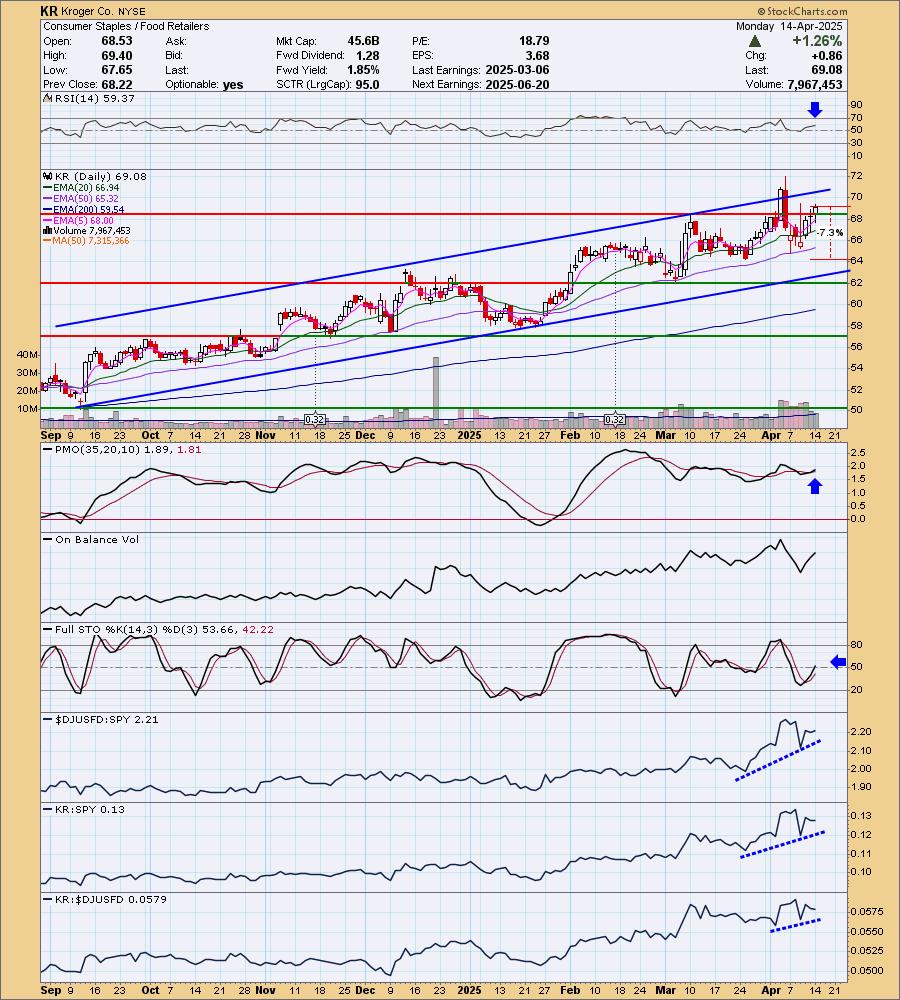
Kroger Co. (KR)
EARNINGS: 2025-06-20 (BMO)
The Kroger Co. engages in the retail grocery business with added convenience to retail pharmacies and fuel centers. Its main focus is on growing households and increasing customer loyalty by delivering great value and convenience, and investing in four strategic pillars: Fresh, Brands, Data & Personalization and Seamless. Its brands include Big K, Smart Way, Heritage Farm, Simple Truth, and Simple Truth Organic. The company was founded by Barney Kroger in 1883 and is headquartered in Cincinnati, OH.
Predefined Scans Triggered: New CCI Buy Signals.
KR is up +0.07% in after hours trading. I really liked the intermediate-term rising trend channel on the daily chart. Notice that price hasn't even had to test the bottom of the channel of late. The RSI is not at all overbought yet. The PMO is rising on a Crossover BUY Signal well above the zero line. The OBV shows volume coming in on the rally. Stochastics have just entered positive territory. Relative strength is good for the group and KR as all relative strength lines are trending upward. The stop is set beneath support at 7.3% or $64.03.
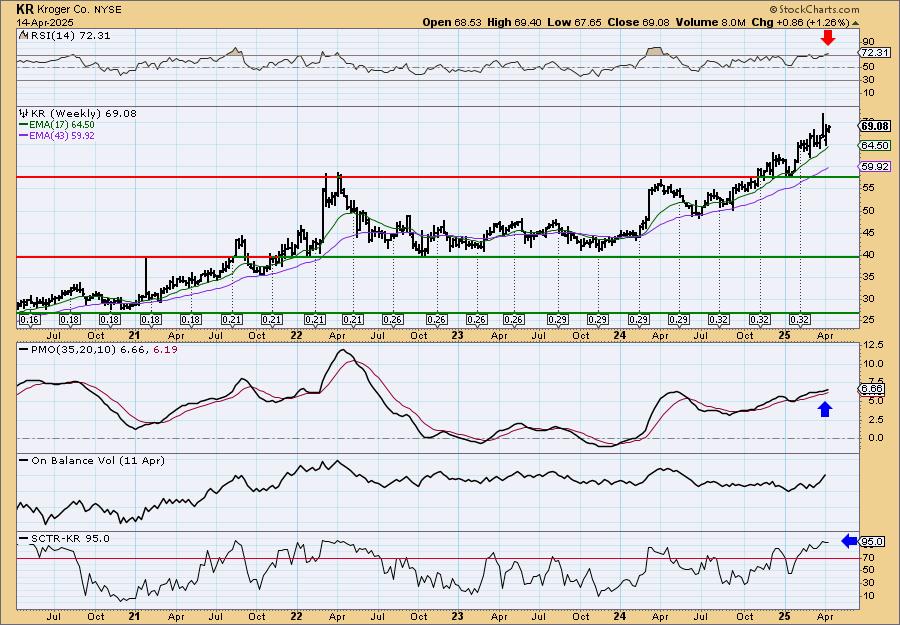
We can see a strong rally that brought price out of the previous trading range. The weekly RSI is overbought now, but it can handle these readings and could see even more overbought territory before it's all over with. The weekly PMO is rising well above the zero line on a Crossover BUY Signal. The SCTR is at the top of the hot zone. Consider a 17% upside target to about 80.82.
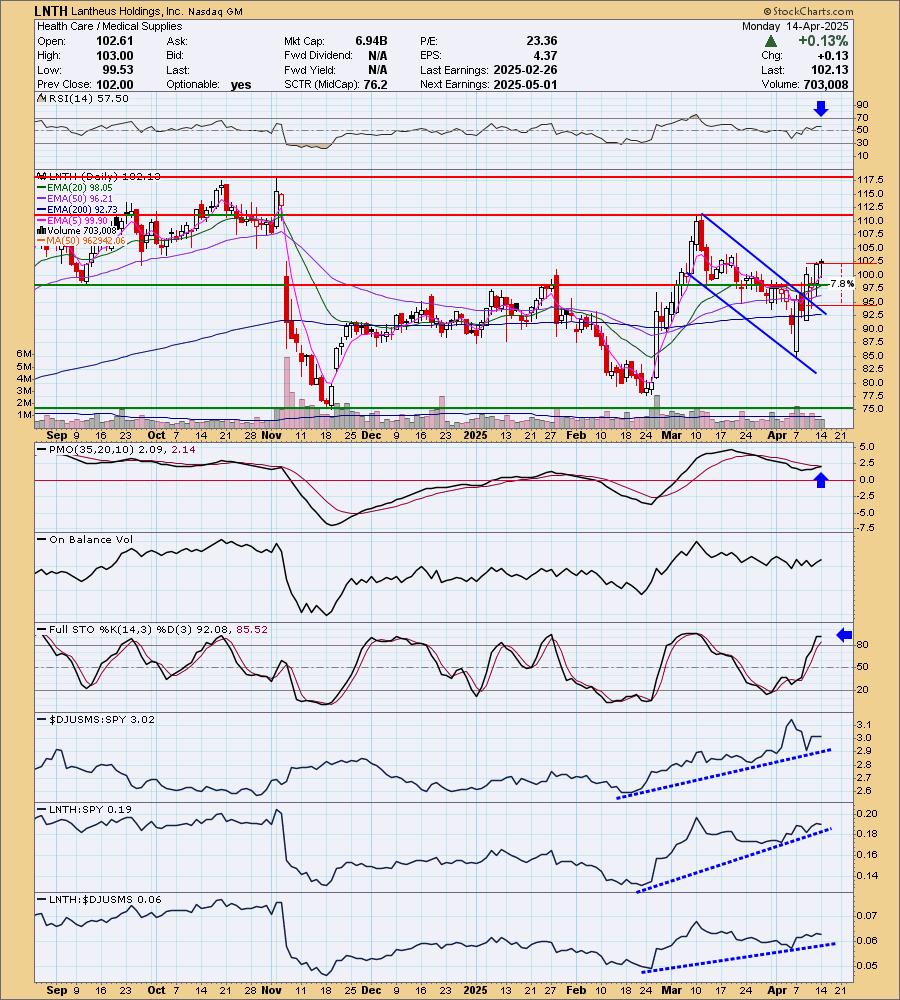
Lantheus Holdings, Inc. (LNTH)
EARNINGS: 2025-05-01 (BMO)
Lantheus Holdings, Inc. engages in the provision of diagnostic imaging and nuclear medicine products. The firm develops products that help healthcare professionals in patient management and outcomes and assists clinicians with the detection of cardiovascular disease. It operates through the U.S. and International geographical segments. The U.S. segment produces and markets products, radiopharmacies, PMFs, integrated delivery networks, hospitals, clinics, and group practices throughout the United States. The International segment offers direct distribution in Canada and third-party distribution relationships in Europe, Canada, Australia, Asia-Pacific, Central America, and South America. The company was founded in 1956 and is headquartered in Bedford, MA.
Predefined Scans Triggered: Filled Black Candles, New CCI Buy Signals, P&F Double Top Breakout and Ichimoku Cloud Turned Green.
LNTH is down -0.19% in after hours trading. Price has broken out of a declining trend channel and looks ready to go after the next area of resistance. The RSI is positive and not overbought. The PMO is nearing a Crossover BUY Signal above the zero line. I'd like to see the OBV responding more to the rally. Stochastics are holding above 80 but have ticked slightly lower. Relative strength lines are all rising strongly for the group and LNTH against the group and the SPY. The stop is set between the 50/200-day EMAs at 7.8% or $94.16.
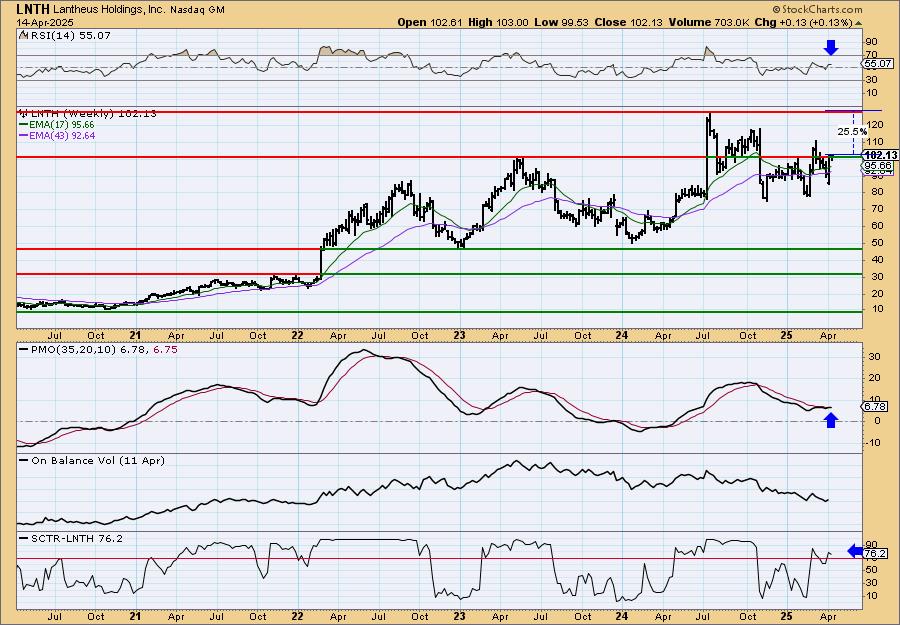
Price has just broken above overhead resistance on the weekly chart and it is technically in a new rising trend (bottom above a bottom and high above a high). The weekly RSI is positive and not overbought. The weekly PMO is on a new Crossover BUY Signal above the zero line. The SCTR is sitting in the hot zone.
Don't forget, on Thursdays I look at reader-requested symbols, click HERE to send me an email. I read every email I receive and try to answer them all!
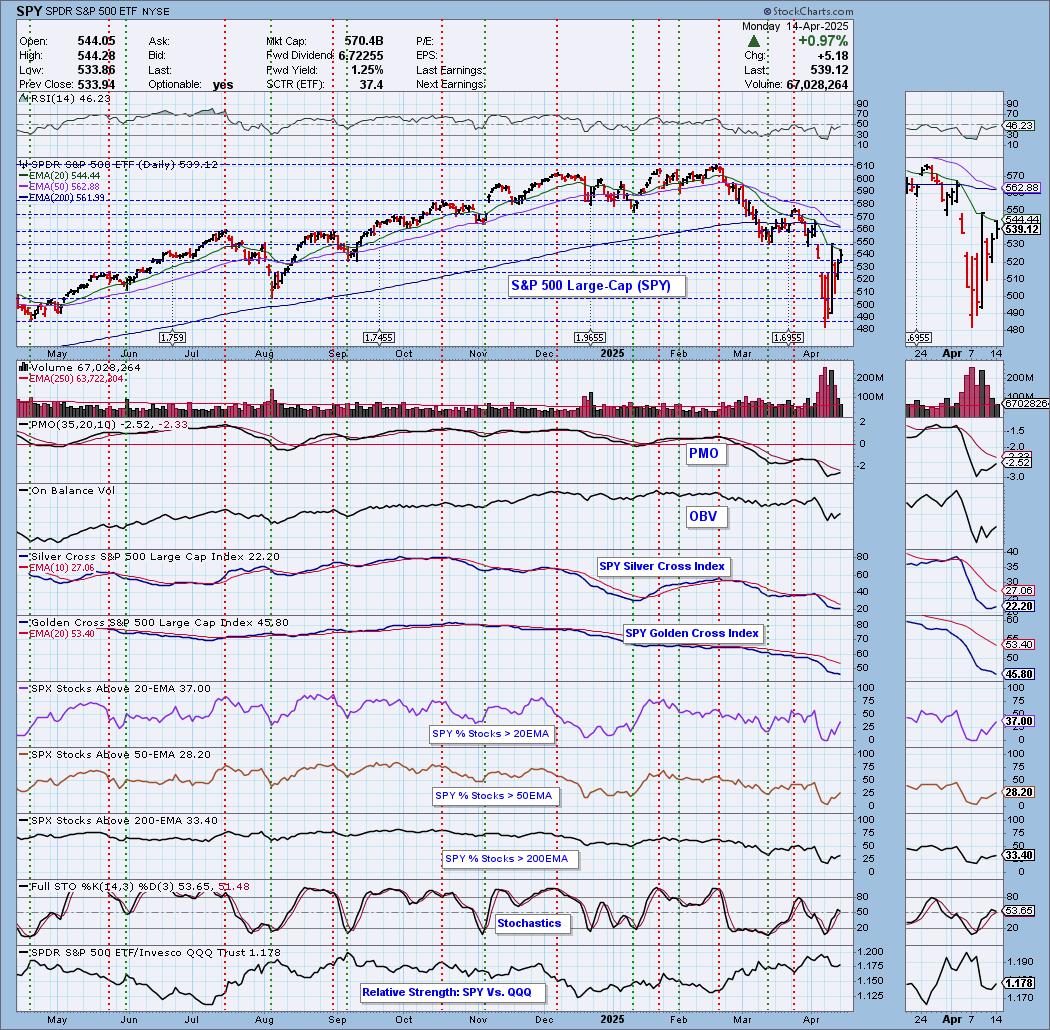
Current Market Outlook:
Market Environment: It is important to consider the odds for success by assessing the market tides. The following chart uses different methodologies for objectively showing the depth and trend of participation for intermediate- and long-term time frames.
- The Silver Cross Index (SCI) shows the percentage of SPX stocks on IT Trend Model BUY signals (20-EMA > 50-EMA)
- The Golden Cross Index (GCI) shows the percentage of SPX stocks on LT Trend Model BUY signals (50-EMA > 200-EMA)
Don't forget that as a "Diamonds" member, you have access to our "Under the Hood" curated ChartList on DecisionPoint.com. You'll find it under "Members Only" links on the left side on the Blogs and Links Page.
Here is the current chart:
Full Disclosure: I am 10% long, 0% short.
I'm required to disclose if I currently own a stock I mention and/or may buy/short it within the next 72 hours.
"Technical Analysis is a windsock, not a crystal ball." - Carl Swenlin
(c) Copyright 2025 DecisionPoint.com
Watch the latest episode of DecisionPoint Trading Room with Carl Swenlin & Erin Swenlin Mondays on the DecisionPoint YouTube channel here!
NOTE: The stocks reported herein are from mechanical trading model scans that are based upon moving average relationships, momentum and volume. DecisionPoint analysis is then applied to get five selections from the scans. The selections given should prompt readers to do a chart review using their own analysis process. This letter is not a call for a specific action to buy, sell or short any of the stocks provided. There are NO sure things or guaranteed returns on the daily selection of "Diamonds in the Rough."
Regarding BUY/SELL Signals: The signal status reported herein is based upon mechanical trading model signals and crossovers. They define the implied bias of the price index/stock based upon moving average relationships and momentum, but they do not necessarily call for a specific action. They are information flags that should prompt chart review. Further, they do not call for continuous buying or selling during the life of the signal. For example, a BUY signal will probably (but not necessarily) return the best results if action is taken soon after the signal is generated. Additional opportunities for buying may be found as price zigzags higher, but the trader must look for optimum entry points. Conversely, exit points to preserve gains (or minimize losses) may be evident before the model mechanically closes the signal.
Helpful DecisionPoint Links:
Price Momentum Oscillator (PMO)
Swenlin Trading Oscillators (STO-B and STO-V)
For more links, go to DecisionPoint.com