
Another volatile day of trading. The whipsaw is making me dizzy. This does seem to say that we are in a bear market and one that isn't likely to let up anytime soon. Although less mixed messages out of the White House would help. Countries are wanting to negotiate, but tariffs still going into effect. The news of China's 104% tariff is what really shook the market ultimately.
The scans did not produce on the long side at all and in all honesty I don't think I'd be doing you a service if I tried to go long in this current market environment. The Diamond Dog Scan did come through with plenty of stinkers to review.
Good Luck & Good Trading,
Erin
Today's "Diamonds in the Rough": BLKB (Short), BOOT (Short), EXP (Short) and PRG (Short).
Runner-ups (ALL SHORTS): TSLA, TFX, TTEK, CABO and ULTA.

Diamond Mine Trading Room:
RECORDING & DOWNLOAD LINK (4/4/2025):
Topic: DecisionPoint Diamond Mine (4/4/2025) LIVE Trading Room
Recording & Download Link
Passcode: April#4th
REGISTRATION for 4/11/2025:
When: April 11, 2025 09:00 AM Pacific Time (US and Canada)
Topic: DecisionPoint Diamond Mine LIVE Trading Room
Register in advance for this webinar HERE
After registering, you will receive a confirmation email containing information about joining the webinar.

Below is the latest free DecisionPoint Trading Room recording from 4/7. You'll find these recordings posted on Mondays to our DP YouTube Channel. Be sure and subscribe HERE.
Welcome to DecisionPoint Diamonds, wherein I highlight ten "Diamonds in the Rough" per week. These are selected from the results of my DecisionPoint Scans which search for stocks that could benefit from the trend and condition of the market. Remember, these are not recommendations to buy or sell, but are the most interesting of the stocks that surfaced in my scans. My objective is to save you the work of the initial, tedious culling process, but you need to apply your own analysis to see if these stocks pique your interest as well. There are no guaranteed winners here!
"Predefined Scans Triggered" are taken from StockCharts.com using the "Symbol Summary" option instead of a "SharpChart" on the workbench.
Stop levels are all rounded down.
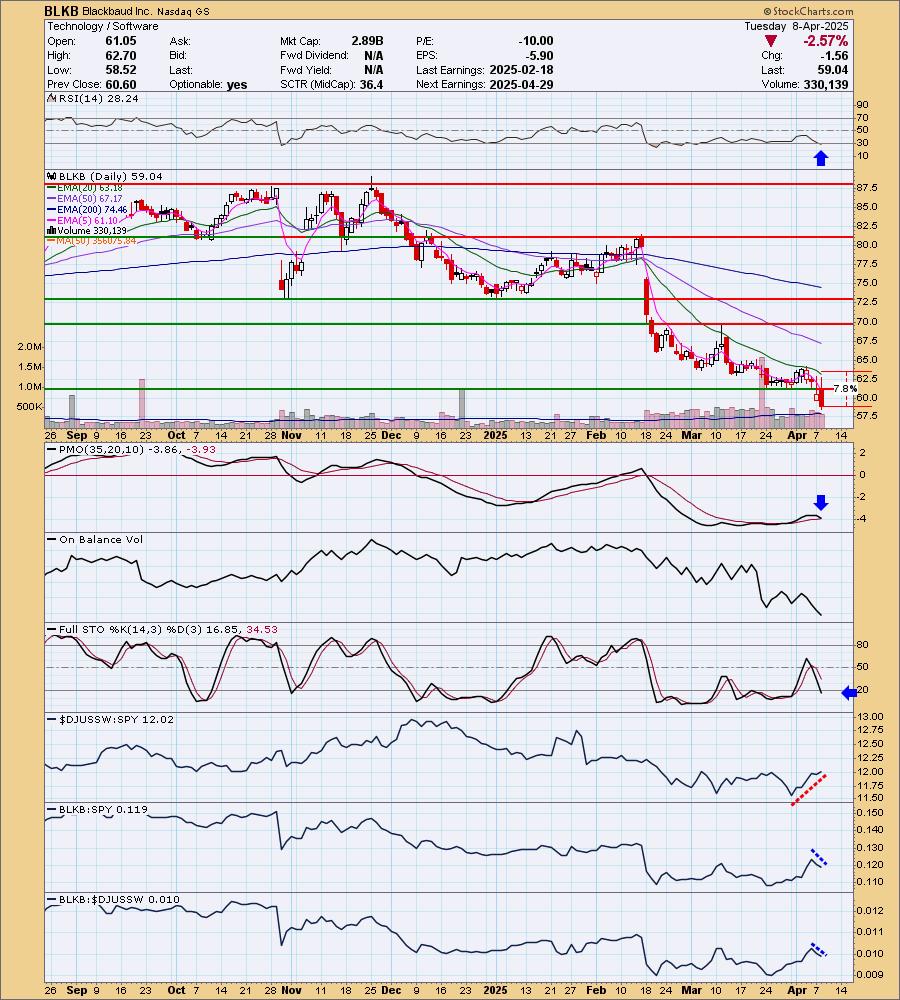
Blackbaud Inc. (BLKB)
EARNINGS: 2025-04-29 (BMO)
Blackbaud, Inc. engages in the provision of cloud-based and on-premises software solutions and related services for the global philanthropic community. It offers solutions for fundraising and constituent relationship management (CRM), marketing, advocacy, accounting, peer-to-peer fundraising, corporate social responsibility (CSR), school management, ticketing, financial management, payment processing, and analytics. The company was founded by Anthony E. Bakker in 1981 and is headquartered in Charleston, SC.
Predefined Scans Triggered: P&F Double Bottom Breakdown, Moved Below Lower Bollinger Band and New 52-week Lows.
BLKB is up +1.41% in after hours trading so you could get a better entry if that holds up. We lost key support on the daily chart and we have a bearish engulfing candlestick. The RSI is negative and not yet oversold. This one had the lowest PMO value of all the results. It has topped well beneath the zero line and is headed for a Crossover SELL Signal. Stochastics are below 20. Interestingly the group has been performing better than the SPY, but I have to believe that is primarily due to the large drops on the SPY with less harsh drops for Software. We are starting to see some underperformance by BLKB against the group and SPY. I will say that if we do get a bounce, it looks like it may come from Tech and this one could be part of that, but ultimately the technicals are so bad I have to believe there is more downside to absorb. The upside stop is set above the 20-day EMA at 7.8% or $63.64.
We have no discernible support for some time on the weekly chart. If it gets to the next level it would be an 11%+ decline, but it looks like it is headed to the bottom of its large trading range. The weekly RSI is oversold so that could imply an intermediate-term bounce ahead, but price is just sailing lower right now. It should get more oversold. The weekly PMO is falling on a Crossover SELL Signal below the zero line. The StockCharts Technical Rank (SCTR) is not in the hot zone* which is what we want on a short.
*If a stock is in the "hot zone" above 70, it implies that it is stronger than 70% of its universe (large-, mid-, small-caps and ETFs) primarily in the intermediate to long terms.

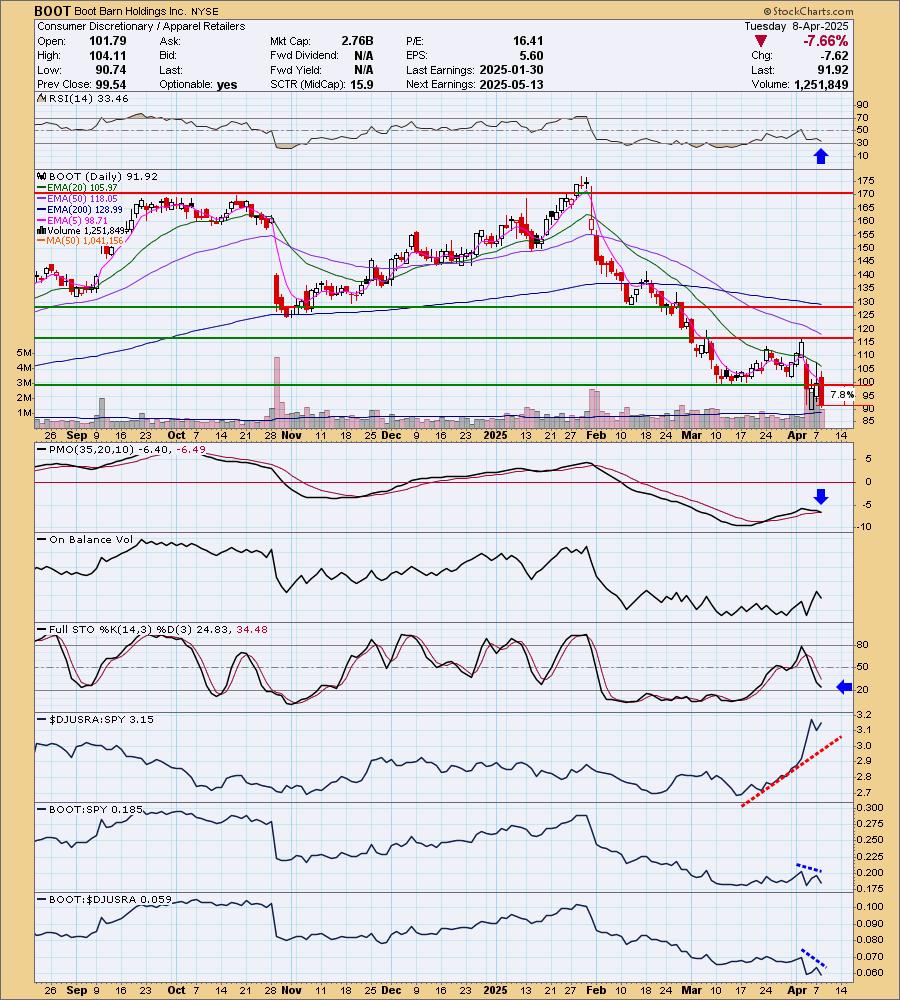
Boot Barn Holdings Inc. (BOOT)
EARNINGS: 2025-05-13 (AMC)
Boot Barn Holdings, Inc. engages in the operation of retail stores of western and work-related footwear, apparel, and accessories. The firm's products include boots, jeans, accessories, hats, gifts and home products, and work wear. Its brands include Ariat, Wrangler, Lucchese Boots, Idyllwind, and Cinch. The company was founded by Kenneth Meany in 1978 and is headquartered in Irvine, CA.
Predefined Scans Triggered: Moved Below Lower Bollinger Band.
BOOT is up +0.84% in after hours trading. I wouldn't be surprised if we do get somewhat of a snapback here after such a large decline, but that will offer a good entry. Today saw a giant bearish engulfing candlestick. Price remains under resistance at the close. The RSI is negative and not oversold. The PMO has topped beneath the zero line and is ready to trigger a Crossover SELL Signal. Stochastics are almost below 20. The group has really been outperforming, but it has done very little to help BOOT. It saw a failed rally. It is already underperforming the group and the SPY. The upside stop is set at 7.8% or $99.09.
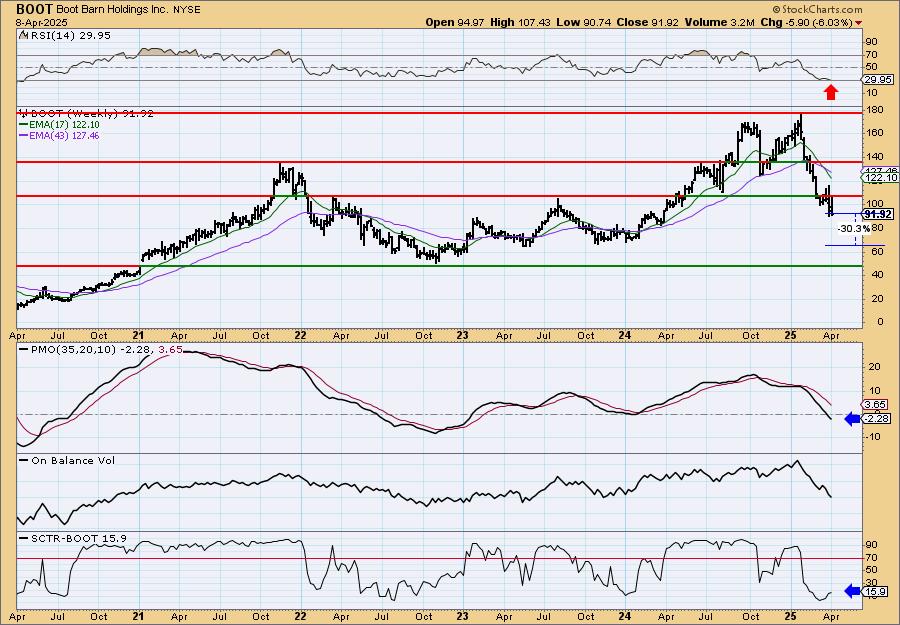
We have a large bearish double top on the weekly chart that has just about reached its minimum downside target, but it is a 'minimum' target so we could see more downside on this reversal pattern. The weekly RSI is oversold, but I believe it will stay there for awhile longer as price action looks very bearish on the weekly chart. The weekly PMO has dropped beneath the zero line. The SCTR is very low.
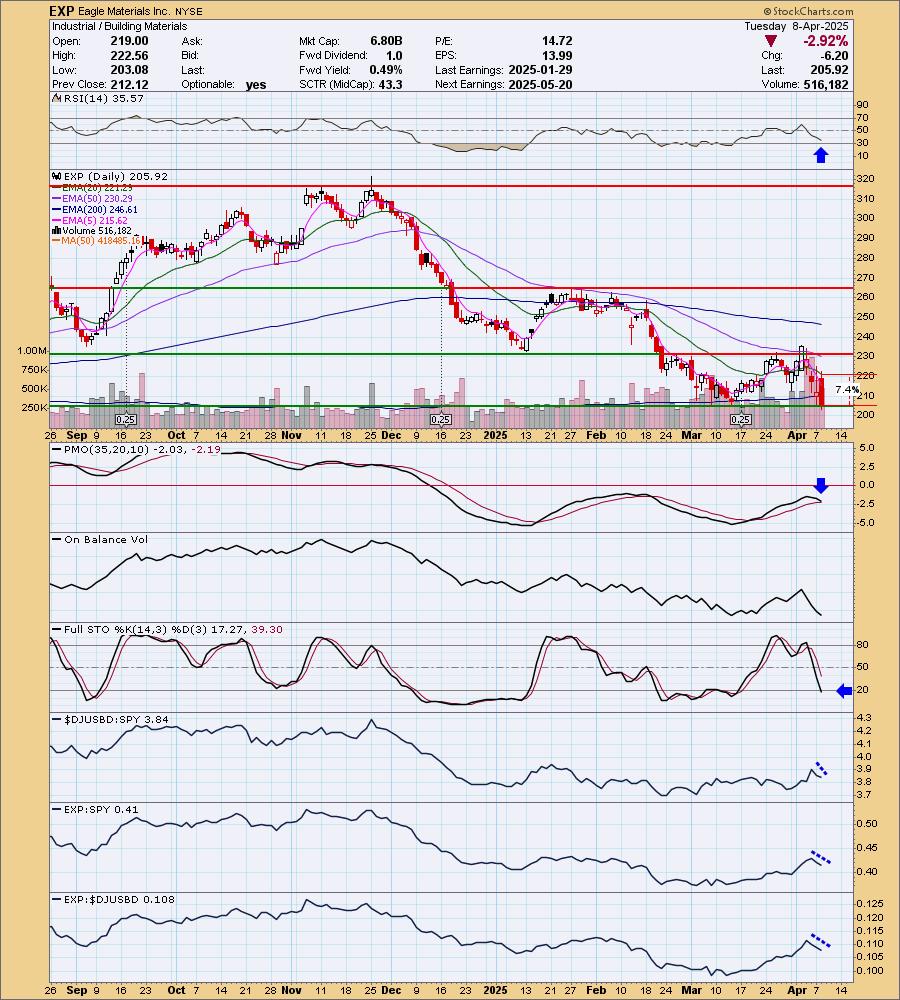
Eagle Materials Inc. (EXP)
EARNINGS: 2025-05-20 (BMO)
Eagle Materials, Inc. engages in the provision of heavy construction materials and light building materials. It operates through the following business segments: Cement, Concrete and Aggregates, Gypsum Wallboard, and Recycled Paperboard. The Cement segment deals with the manufacture, production, distribution, and sale of Portland cement. The Concrete and Aggregates segment is involved in mixing cement, sand, gravel, or crushed stone and water to form concrete, which is then sold and distributed to construction contractors. The Gypsum Wallboard segment mines and extracts natural gypsum rock, which is used in the manufacture of gypsum wallboard. The Recycled Paperboard segment processes paper fiber, water, and paper chemicals to form recycled paperboards that are sold to gypsum wallboard manufacturers. The company was founded in 1963 and is headquartered in Dallas, TX.
Predefined Scans Triggered: P&F Double Bottom Breakdown, P&F Spread Triple Bottom Breakdown and New 52-week Lows.
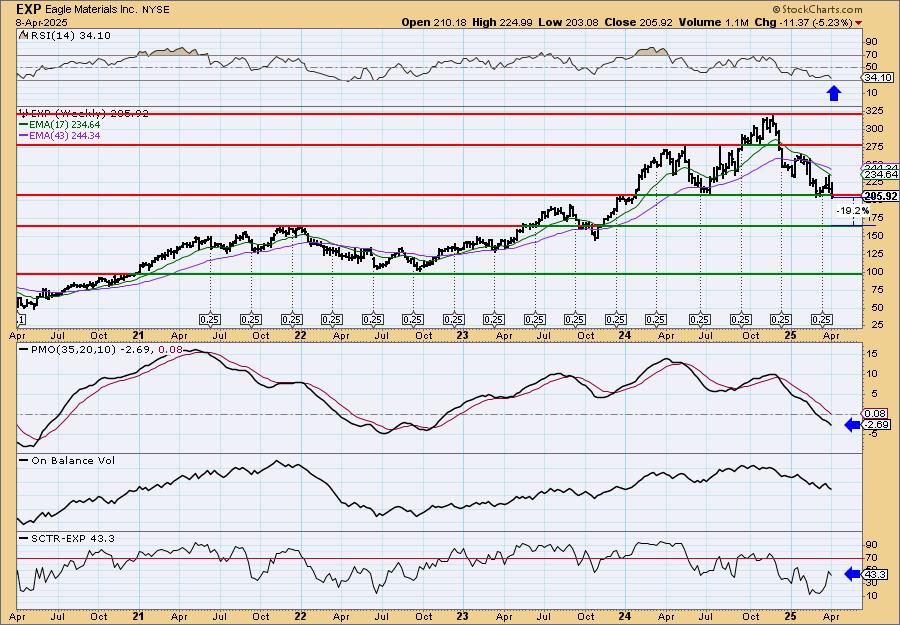
EXP is unchanged in after hours trading. Price is sitting on support right now, but it has technically closed below it. We have a clear declining trend. The PMO has topped beneath the zero line and is nearing a Crossover SELL Signal. Stochastics have dropped below 20. Relative strength is beginning to fade a bit. The upside stop is set at the 20-day EMA at 7.4% or $221.15.
We have a clear topping formation on the weekly chart that is reminiscent of a head and shoulders pattern. Price has dropped below support. The weekly RSI is negative and not oversold. The weekly PMO is declining beneath the zero line and is on a Crossover SELL Signal. The SCTR could be lower, but ultimately it is not in the hot zone.
PROG Holdings, Inc. (PRG)
EARNINGS: 2025-04-23 (BMO)
PROG Holdings, Inc. engages in the provision of lease-purchase solutions. It offers retail sale and lease ownership of furniture, home appliances, consumer electronics, and accessories through its franchised stores and e-commerce platform. It operates through the following segments: Progressive Leasing, Vive, and Four. The Progressive segment offers lease-to-own ownership of durable goods. The Vive segment provides services to customers who may not qualify to purchase goods and services from merchants. The Four segment includes provision of credit backgrounds with Buy Now, Pay Later "BNPL". The company was founded in 1955 and is headquartered in Draper, UT.
Predefined Scans Triggered: P&F Double Bottom Breakdown, P&F Descending Triple Bottom Breakdown and P&F Long Tail Down.
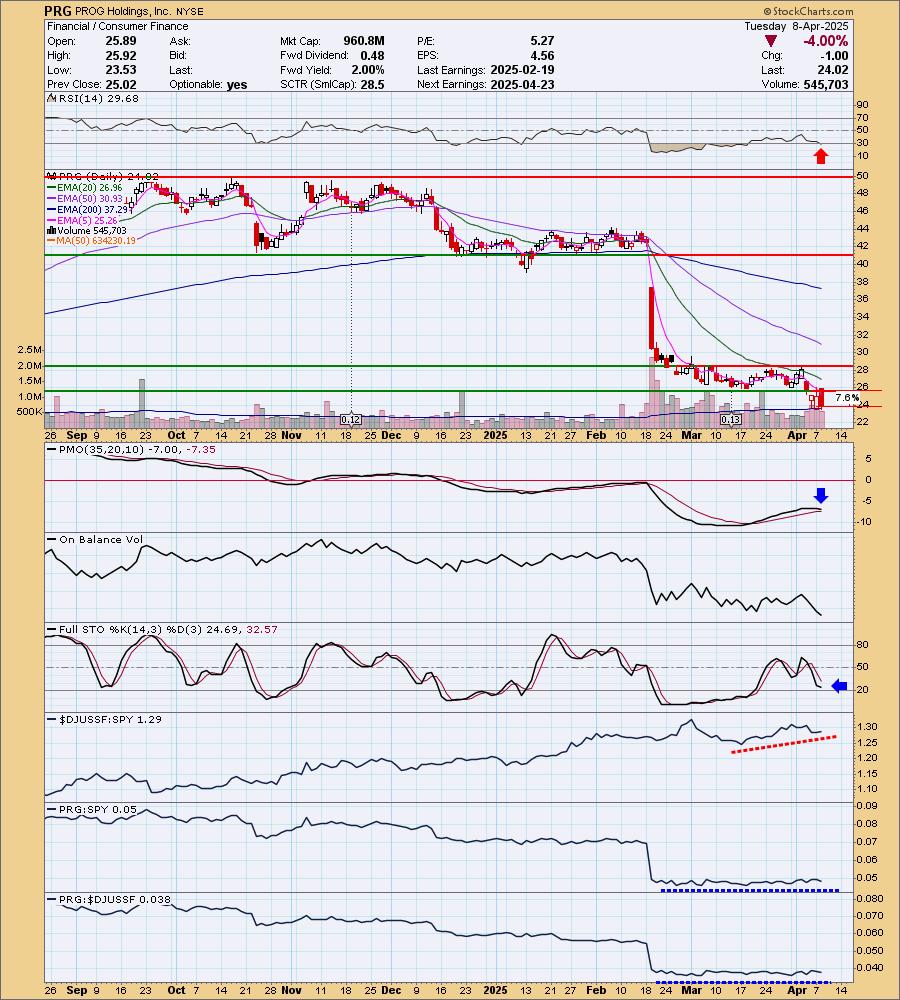
PRG is unchanged in after hours trading. Price lost support recently which was why I liked it. It dropped precipitously on earnings back in February and it really hasn't done anything since. The RSI is oversold right now, but we can see it can hold oversold readings for some time. The PMO topped beneath the zero line and is nearing a Crossover SELL Signal. The group is outperforming, but it hasn't helped PRG out. PRG is traveling in line with the group so we do want the group to start underperforming. It is traveling in line with the SPY, but given we are in a bear market, I'm okay with that. The upside stop is as close to resistance as possible at 7.6% or $25.84.
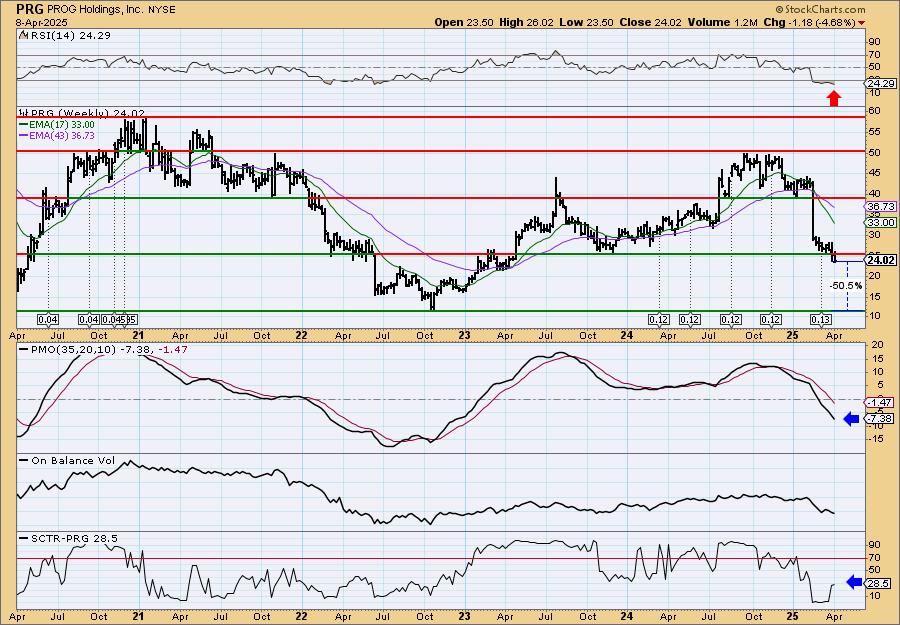
I really don't see any meaningful support here. We can see that the breakdown on the daily chart carries some weight as price also lost key long-term support. The weekly RSI is oversold, but I'd look for it to get more oversold given this serious breakdown. The weekly PMO is declining beneath the zero line on a Crossover SELL Signal. The SCTR is outside the hot zone. There is a ton of downside potential on this one.
Don't forget, on Thursdays I look at reader-requested symbols, click HERE to send me an email. I read every email I receive and try to answer them all!
Current Market Outlook:
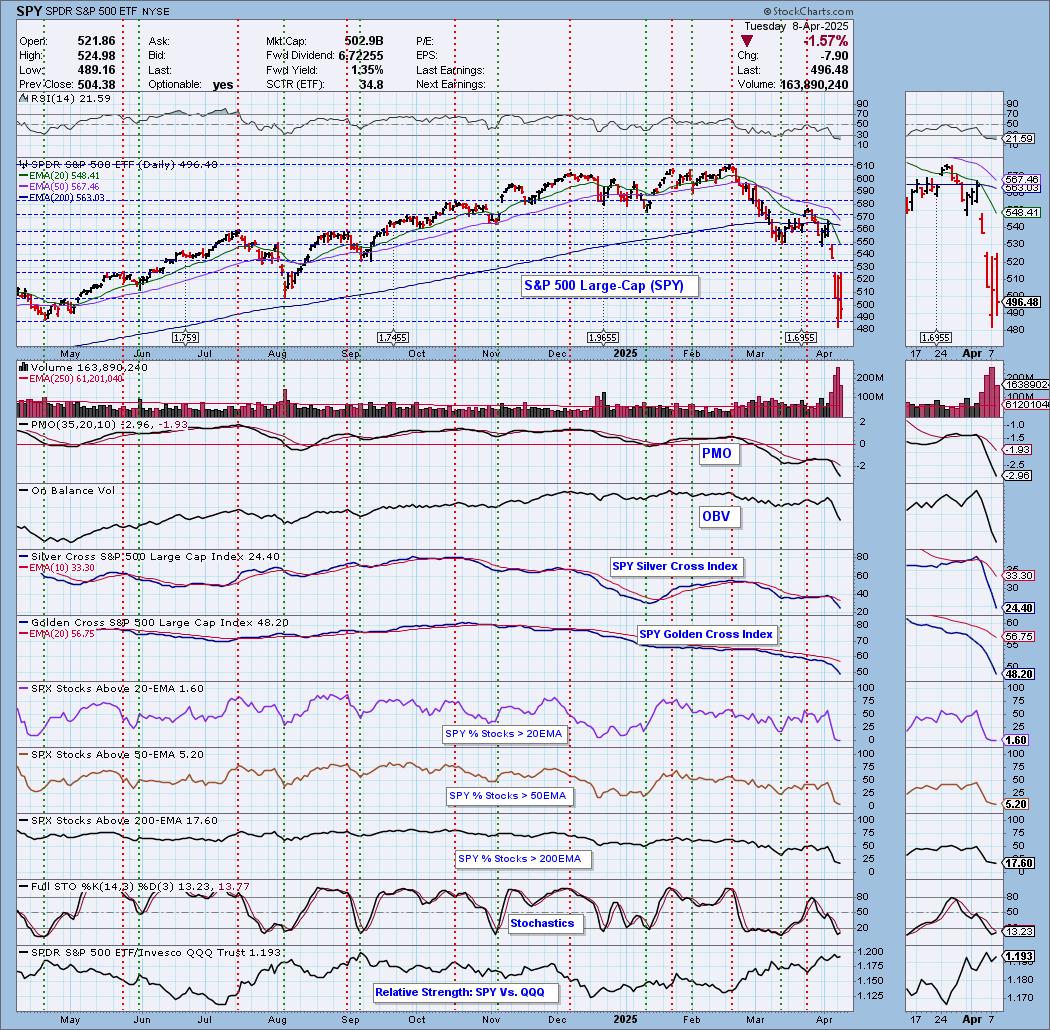
Market Environment: It is important to consider the odds for success by assessing the market tides. The following chart uses different methodologies for objectively showing the depth and trend of participation for intermediate- and long-term time frames.
- The Silver Cross Index (SCI) shows the percentage of SPX stocks on IT Trend Model BUY signals (20-EMA > 50-EMA)
- The Golden Cross Index (GCI) shows the percentage of SPX stocks on LT Trend Model BUY signals (50-EMA > 200-EMA)
Don't forget that as a "Diamonds" member, you have access to our "Under the Hood" curated ChartList on DecisionPoint.com. You'll find it under "Members Only" links on the left side on the Blogs and Links Page.
Here is the current chart:
Full Disclosure: I am 10% long, 0% short.
I'm required to disclose if I currently own a stock I mention and/or may buy/short it within the next 72 hours.
"Technical Analysis is a windsock, not a crystal ball." - Carl Swenlin
(c) Copyright 2025 DecisionPoint.com
Watch the latest episode of DecisionPoint Trading Room with Carl Swenlin & Erin Swenlin Mondays on the DecisionPoint YouTube channel here!
NOTE: The stocks reported herein are from mechanical trading model scans that are based upon moving average relationships, momentum and volume. DecisionPoint analysis is then applied to get five selections from the scans. The selections given should prompt readers to do a chart review using their own analysis process. This letter is not a call for a specific action to buy, sell or short any of the stocks provided. There are NO sure things or guaranteed returns on the daily selection of "Diamonds in the Rough."
Regarding BUY/SELL Signals: The signal status reported herein is based upon mechanical trading model signals and crossovers. They define the implied bias of the price index/stock based upon moving average relationships and momentum, but they do not necessarily call for a specific action. They are information flags that should prompt chart review. Further, they do not call for continuous buying or selling during the life of the signal. For example, a BUY signal will probably (but not necessarily) return the best results if action is taken soon after the signal is generated. Additional opportunities for buying may be found as price zigzags higher, but the trader must look for optimum entry points. Conversely, exit points to preserve gains (or minimize losses) may be evident before the model mechanically closes the signal.
Helpful DecisionPoint Links:
Price Momentum Oscillator (PMO)
Swenlin Trading Oscillators (STO-B and STO-V)
For more links, go to DecisionPoint.com