
I thought I was dizzy yesterday! The market roared back to life today on news of a 90-day pause on reciprocal tariffs, but did say the 10% baseline would remain. China is now on the hook for a 125% tariff on all goods. The market was most interested in the pause and possible trade agreements being worked out by Scott Bessent, Secretary of the Treasury. The market really likes Bessent leading this charge and that is also helping.
What wasn't helped were yesterday's shorts. At the time it made sense so I don't fault myself for not seeing this coming. Hopefully none of you got caught on these because they did see remarkable turnarounds today. I am not interested in them on the long side given their negative history, but certainly they could see a recovery period.
It was hard to pick today's selections as the scans did not produce. I have two selections from the scans (AIYY and IHF), but WEAT I chose on my own. I'm not entirely excited about it, but it was one of the few ETFs out there with a rising PMO from our ETF Tracker.
I could have gone with some index ETFs but this volatility is likely to remain. This was a good start today, but will we see strong followthrough? Personally I'm keeping my exposure at 10% until I see less volatility.
Tomorrow is Reader Request Day. It's asking a lot in this market, but I'd really like to see what symbols you are considering or need help with. Take a moment and send me an email at erin@decisionpoint.com.
Good Luck & Good Trading,
Erin
Today's "Diamonds in the Rough": AIYY, IHF and WEAT.

Diamond Mine Trading Room:
RECORDING & DOWNLOAD LINK (4/4/2025):
Topic: DecisionPoint Diamond Mine (4/4/2025) LIVE Trading Room
Recording & Download Link
Passcode: April#4th
REGISTRATION for 4/11/2025:
When: April 11, 2025 09:00 AM Pacific Time (US and Canada)
Topic: DecisionPoint Diamond Mine LIVE Trading Room
Register in advance for this webinar HERE
After registering, you will receive a confirmation email containing information about joining the webinar.

Below is the latest free DecisionPoint Trading Room recording from 4/7. You'll find these recordings posted on Mondays to our DP YouTube Channel. Be sure and subscribe HERE.
Welcome to DecisionPoint Diamonds, wherein I highlight ten "Diamonds in the Rough" per week. These are selected from the results of my DecisionPoint Scans which search for stocks that could benefit from the trend and condition of the market. Remember, these are not recommendations to buy or sell, but are the most interesting of the stocks that surfaced in my scans. My objective is to save you the work of the initial, tedious culling process, but you need to apply your own analysis to see if these stocks pique your interest as well. There are no guaranteed winners here!
"Predefined Scans Triggered" are taken from StockCharts.com using the "Symbol Summary" option instead of a "SharpChart" on the workbench.
Stop levels are all rounded down.
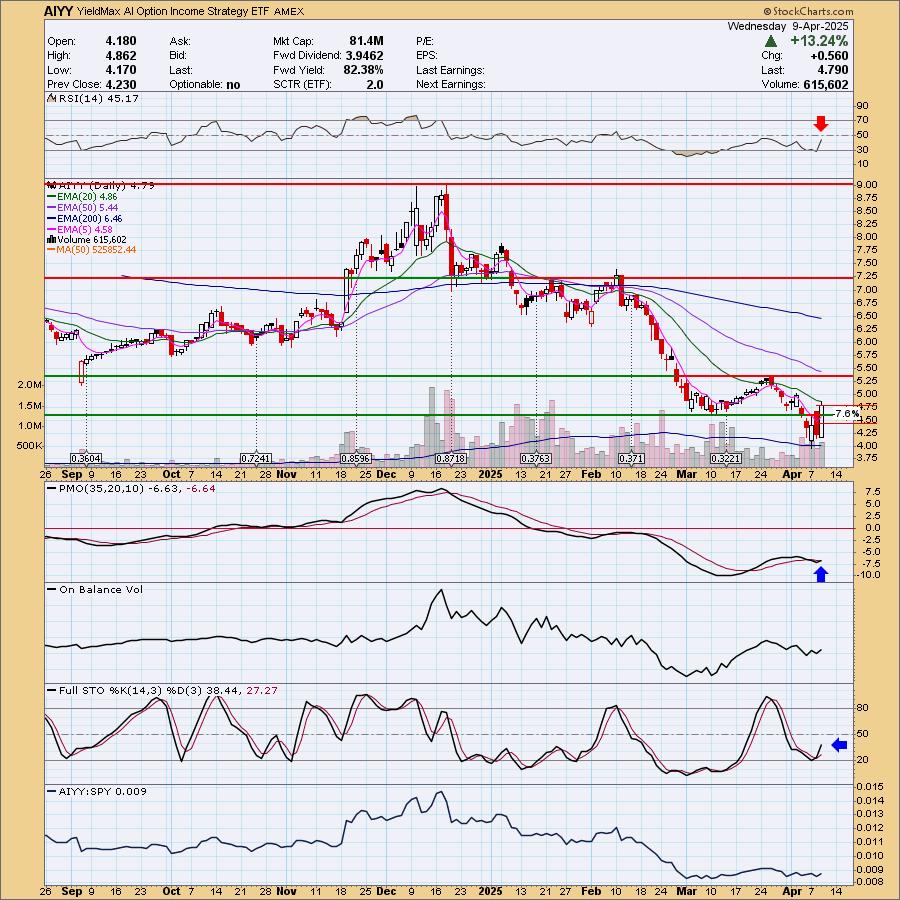
YieldMax AI Option Income Strategy ETF (AIYY)
EARNINGS: N/A
AIYY seeks to provide current income and capped gains on the C3 ai, Inc. stock (AI) through a synthetic covered call strategy, collateralized by cash and US Treasurys. The actively managed fund uses both standardized exchange-traded and FLEX options. Click HERE for more information.
Predefined Scans Triggered: Elder Bar Turned Green and Bullish Engulfing.
AIYY is up +0.42% in after hours trading. This one has been struggling and is currently in a declining trend, but this does look like a good rally off all-time lows. We did get a bullish engulfing candlestick that implies we'll see more upside here. It performed better than the indexes today. The RSI is not yet positive, but it is headed higher and isn't overbought. The PMO is on a brand new Crossover BUY Signal. Stochastics are also rising again. It isn't really outperforming the SPY, but it did today. I've set the stop below new support at 7.6% or $4.42.
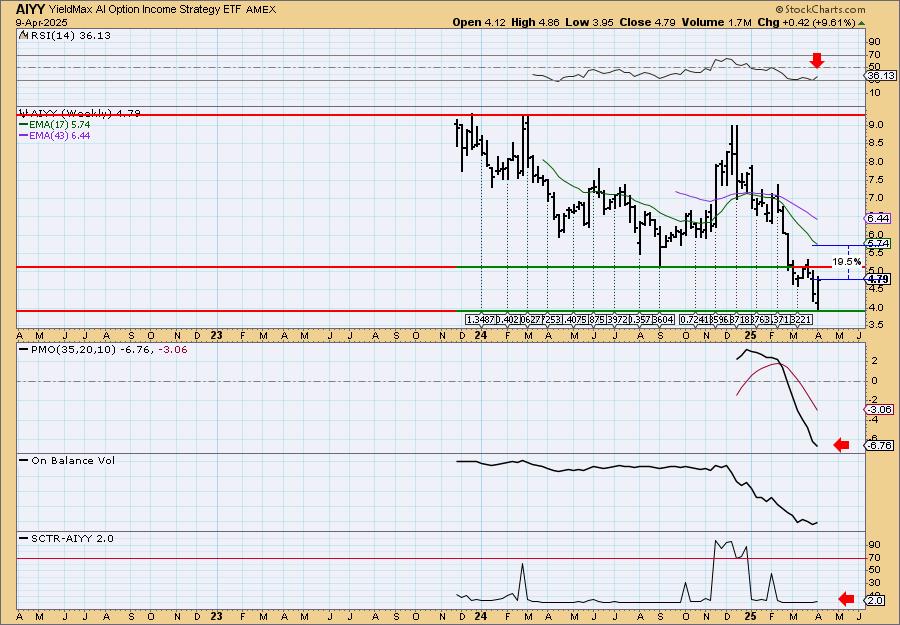
As noted above it is coming off all-time lows right now. It is currently below resistance. The weekly RSI is negative and the weekly PMO looks terrible. The StockCharts Technical Rank (SCTR) is in the basement, very far away from the hot zone*. Given this bearish weekly chart, I would only consider this one in the short term with a short leash.
*If a stock is in the "hot zone" above 70, it implies that it is stronger than 70% of its universe (large-, mid-, small-caps and ETFs) primarily in the intermediate to long terms.
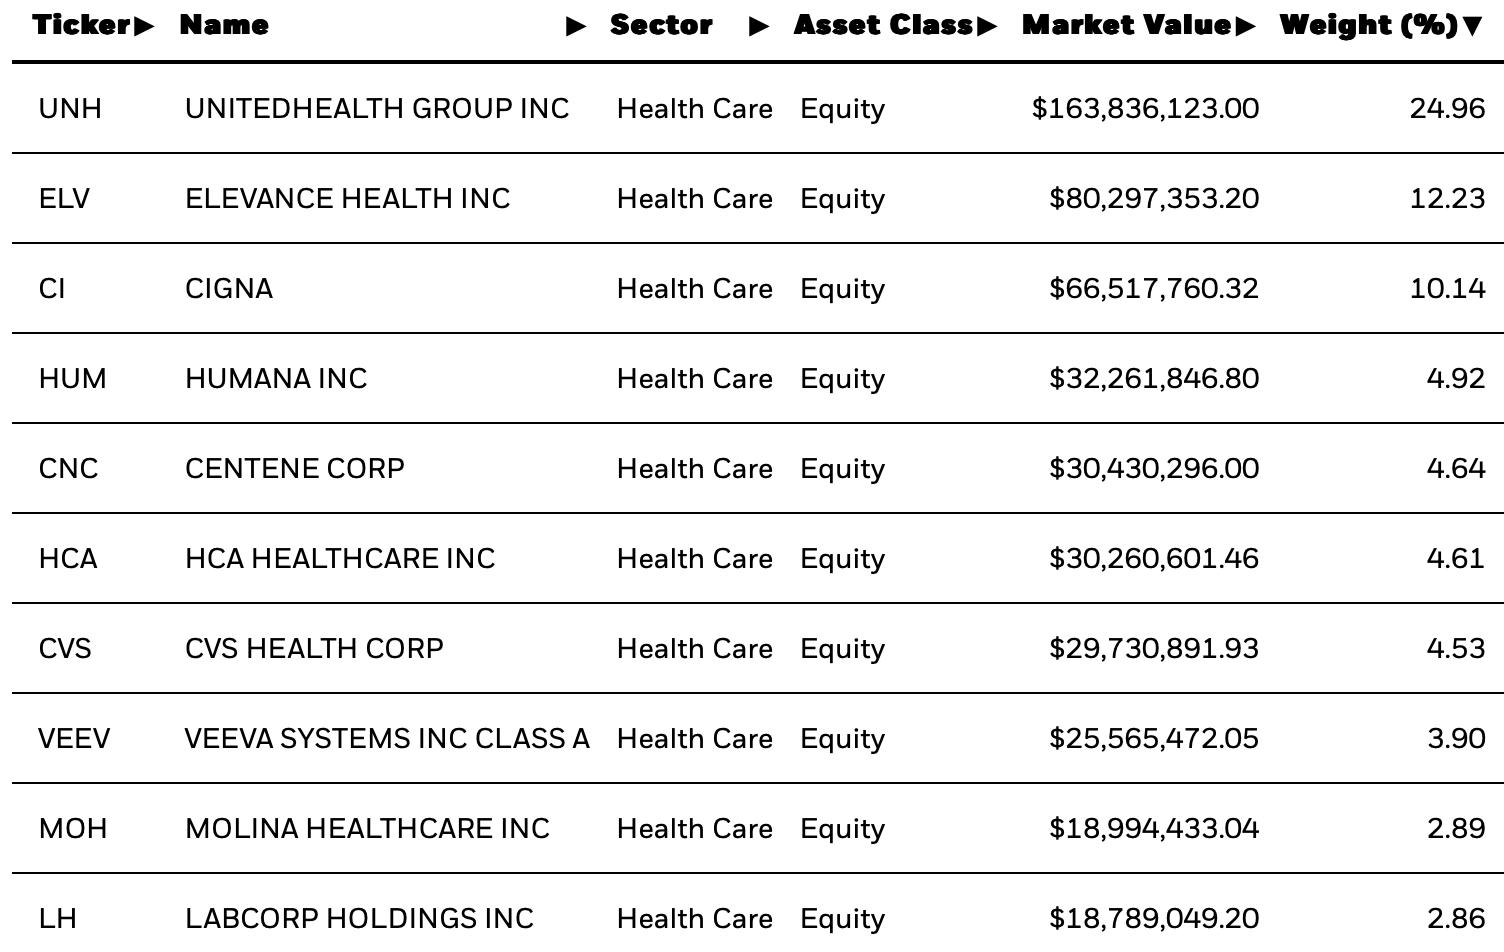
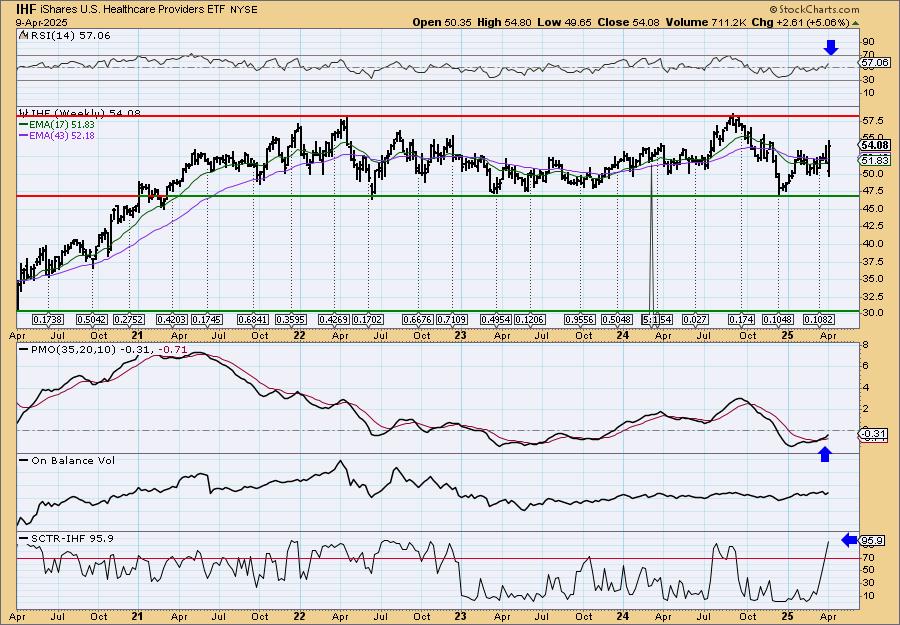
iShares U.S. Healthcare Providers ETF (IHF)
EARNINGS: N/A
IHF tracks a cap-weighted index of US companies that provide healthcare services. Click HERE for more information.
Predefined Scans Triggered: Moved Above Upper Bollinger Band, Elder Bar Turned Green and New CCI Buy Signals.
IHF is up +1.37% in after hours trading. I liked this one best as it is still essentially in a rising trend out of the December low. It rebounded off support as well. The RSI is in positive territory and the PMO is rising on a new whipsaw Crossover BUY Signal. Stochastics are moving up vertically. Relative strength has mostly been positive but I do see it has recently showed some underperformance as it wasn't up as high as the SPY today. I set the stop beneath support at 7.8% or $49.86.
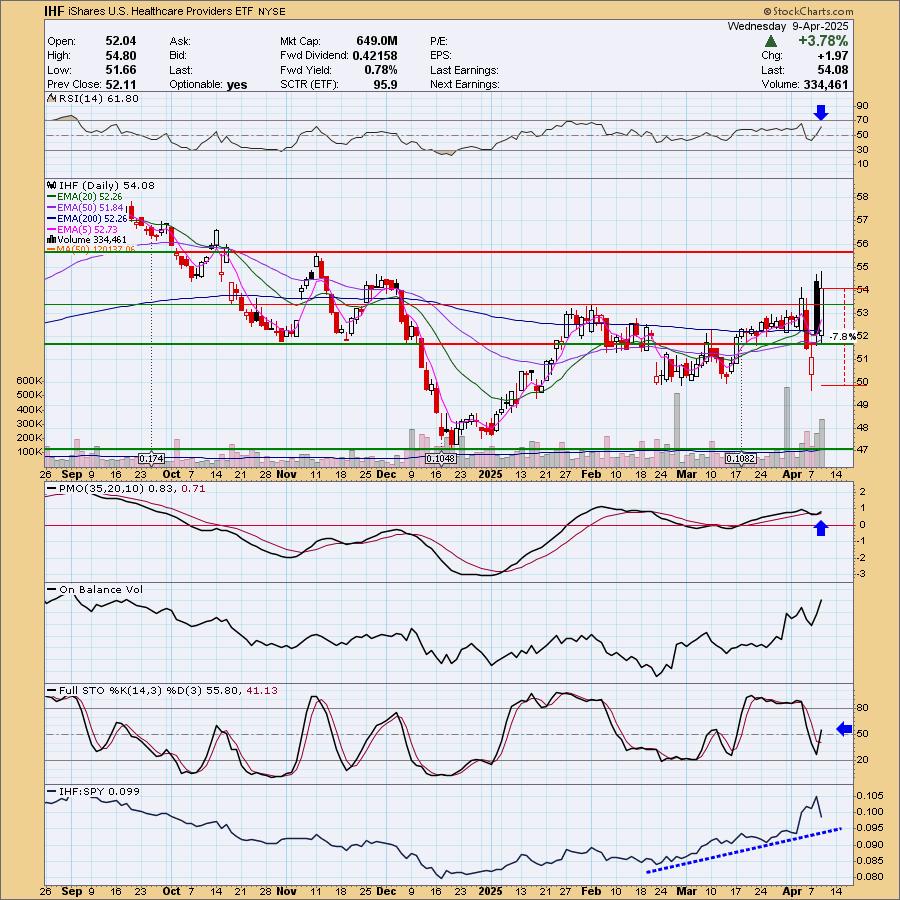
It has been in a long-term trading range and appears ready to head to the top of the range again. Upside potential to the next area of resistance is only about 8%, but it is defensive and could see a breakout. The indicators are lined up for a breakout. The weekly RSI is positive and rising. The weekly PMO is rising on a Crossover BUY Signal. Best of all the SCTR is outstanding. We should get more upside here. Consider a 17% upside target to about $44.89.
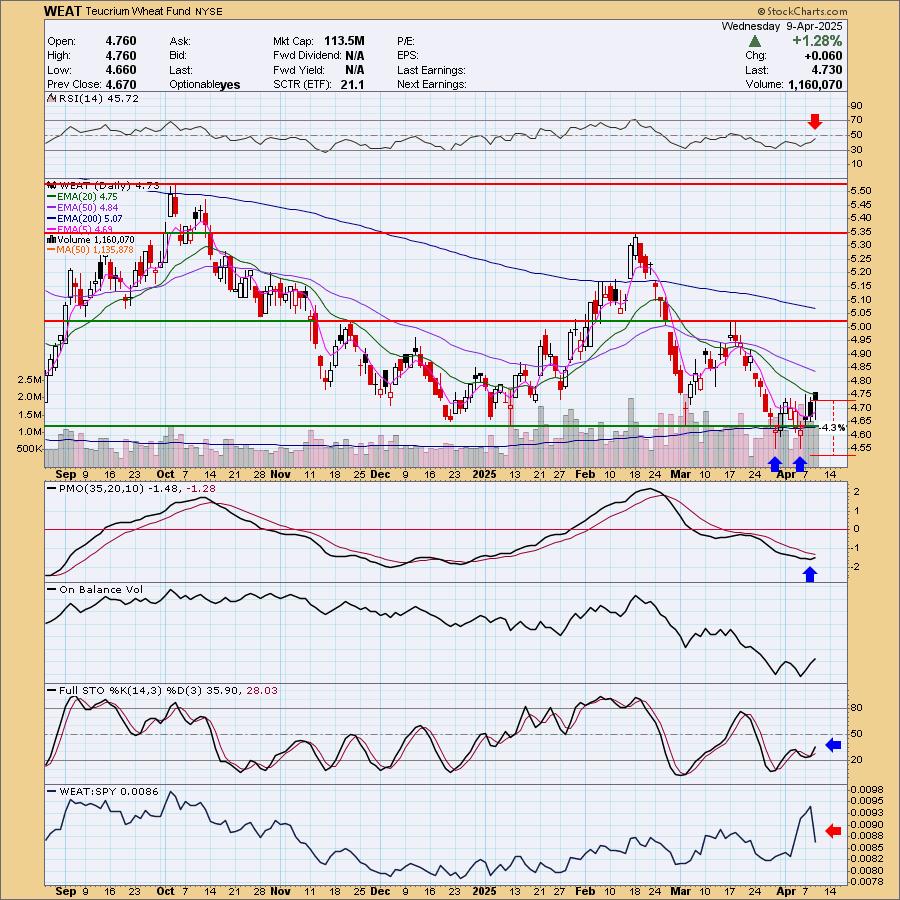
Teucrium Wheat Fund (WEAT)
EARNINGS: N/A
WEAT tracks an index of wheat futures contracts. It reflects the performance of wheat by holding Chicago Board of Trade wheat futures contracts with three different expiration dates. Click HERE for more information.
Predefined Scans Triggered: P&F Double Bottom Breakdown, Elder Bar Turned Green, P&F Descending Triple Bottom Breakdown, Bullish MACD Crossovers, Filled Black Candles, Hanging Man and Ichimoku Cloud Turned Red.
WEAT is down -0.21% in after hours trading. Besides being one of the few in our ETF Tracker to have a rising PMO, the other thing that caught my eye was the bullish double bottom that could imply a nice upside reversal. It is a filled black candle so decline could occur tomorrow. The RSI is not positive yet so this is an early pick. The PMO is rising toward a Crossover BUY Signal and Stochastics look healthy as they move toward net neutral (50). It definitely underperformed the market today, but before that it was seeing some good outperformance. I'm going with a very thin stop as I wouldn't want it if it dropped below the double bottom. I set it below that level at 4.3% or $4.52.
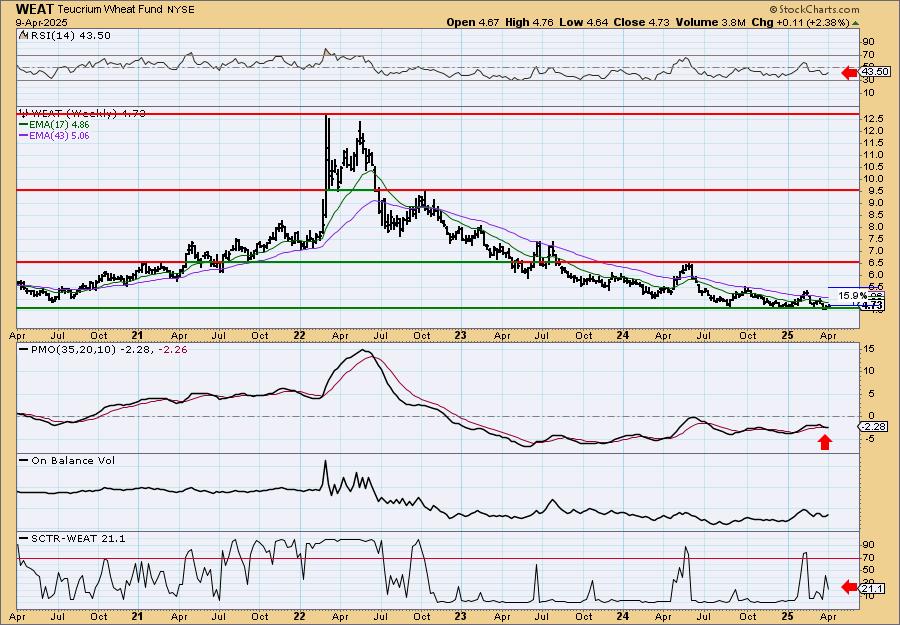
It is trading near 52-week lows and is really overdue for a rally. The weekly RSI is negative unfortunately and the weekly PMO had a negative Crossover. The SCTR is not close to the hot zone. I like it for a short-term rally and I do think it could turn into more, but we'll limit our upside target to 15.9%
Don't forget, on Thursdays I look at reader-requested symbols, click HERE to send me an email. I read every email I receive and try to answer them all!
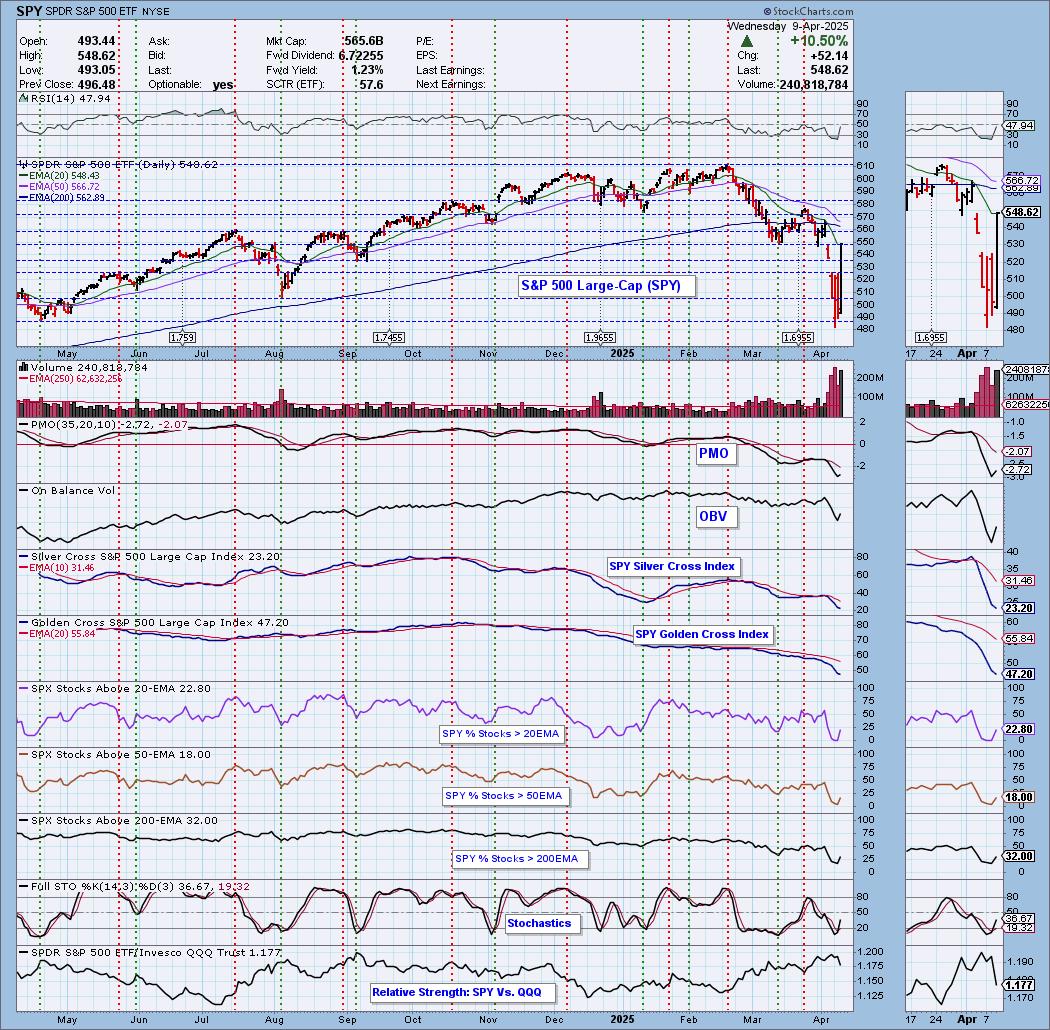
Current Market Outlook:
Market Environment: It is important to consider the odds for success by assessing the market tides. The following chart uses different methodologies for objectively showing the depth and trend of participation for intermediate- and long-term time frames.
- The Silver Cross Index (SCI) shows the percentage of SPX stocks on IT Trend Model BUY signals (20-EMA > 50-EMA)
- The Golden Cross Index (GCI) shows the percentage of SPX stocks on LT Trend Model BUY signals (50-EMA > 200-EMA)
Don't forget that as a "Diamonds" member, you have access to our "Under the Hood" curated ChartList on DecisionPoint.com. You'll find it under "Members Only" links on the left side on the Blogs and Links Page.
Here is the current chart:
Full Disclosure: I am 10% long, 0% short.
I'm required to disclose if I currently own a stock I mention and/or may buy/short it within the next 72 hours.
"Technical Analysis is a windsock, not a crystal ball." - Carl Swenlin
(c) Copyright 2025 DecisionPoint.com
Watch the latest episode of DecisionPoint Trading Room with Carl Swenlin & Erin Swenlin Mondays on the DecisionPoint YouTube channel here!
NOTE: The stocks reported herein are from mechanical trading model scans that are based upon moving average relationships, momentum and volume. DecisionPoint analysis is then applied to get five selections from the scans. The selections given should prompt readers to do a chart review using their own analysis process. This letter is not a call for a specific action to buy, sell or short any of the stocks provided. There are NO sure things or guaranteed returns on the daily selection of "Diamonds in the Rough."
Regarding BUY/SELL Signals: The signal status reported herein is based upon mechanical trading model signals and crossovers. They define the implied bias of the price index/stock based upon moving average relationships and momentum, but they do not necessarily call for a specific action. They are information flags that should prompt chart review. Further, they do not call for continuous buying or selling during the life of the signal. For example, a BUY signal will probably (but not necessarily) return the best results if action is taken soon after the signal is generated. Additional opportunities for buying may be found as price zigzags higher, but the trader must look for optimum entry points. Conversely, exit points to preserve gains (or minimize losses) may be evident before the model mechanically closes the signal.
Helpful DecisionPoint Links:
Price Momentum Oscillator (PMO)
Swenlin Trading Oscillators (STO-B and STO-V)
For more links, go to DecisionPoint.com