
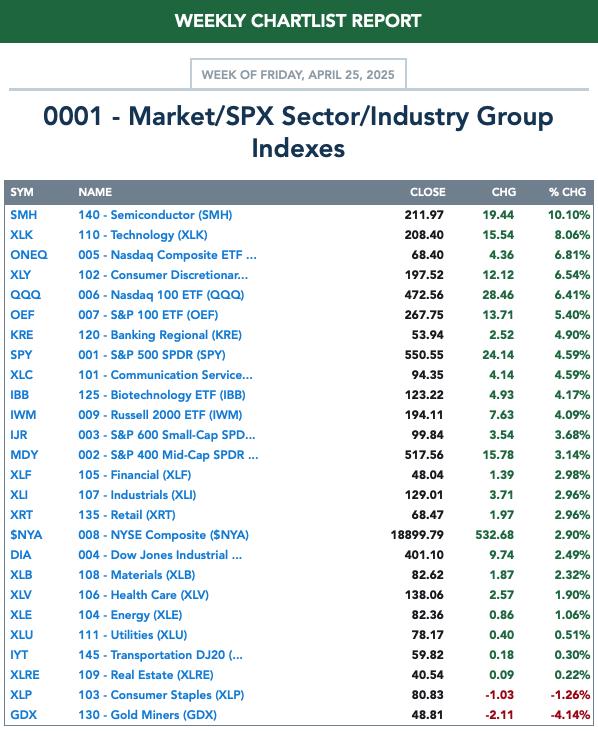
It was a decent week for "Diamonds in the Rough". Seven out of 10 positions finished in the green. The average was positive, but not nearly as high as the SPY for the week. This was primarily due to picking two Utilities on Tuesday. The rally this week has not touched the Utilities sector by much so therein lies the problem.
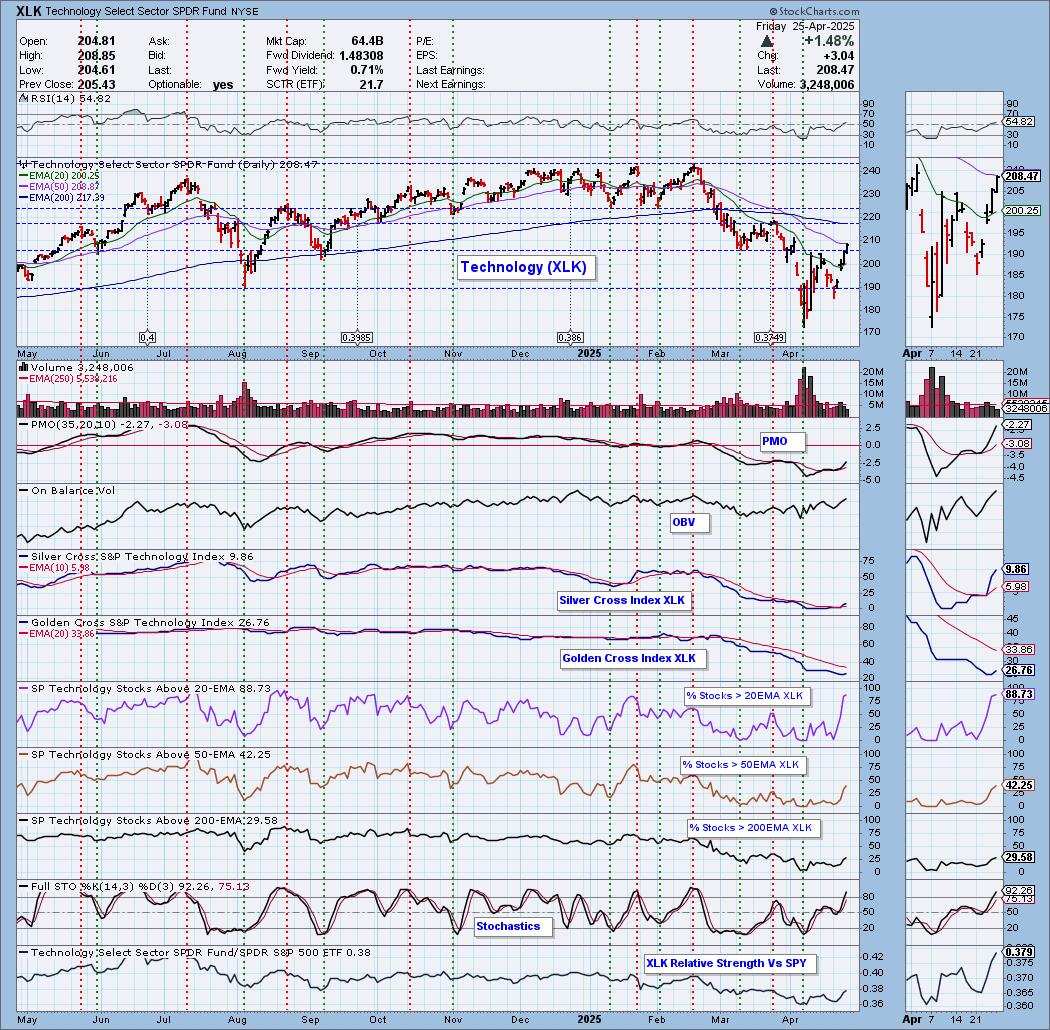
This week's Sector to Watch is Technology (XLK). I think we can get a bit more aggressive moving into next week as this market bottom is looking credible. However, have your finger close to the sell button if you dive in. We could still be in a bear market situation and the market could turn on a dime if we're not careful. Set stops.
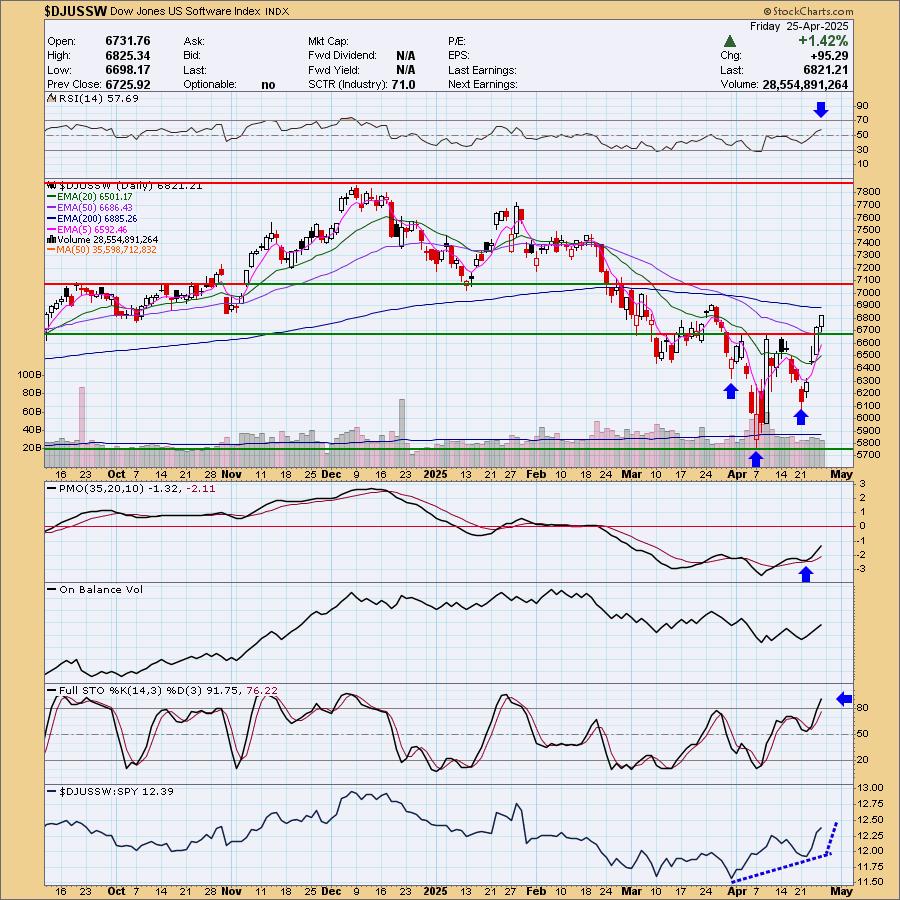
The Industry Group to Watch is Software which is showing nice relative strength and a good price pattern. It is an area that should see movement if this rally is going to continue. Interestingly nearly all stocks I found within looked good with the big names showing prominence. Here are the symbols I found interesting this morning: PLTR, DUOL, CRWD, STNE, OKTA, NET, PAGS and FTNT. Again be careful and set stops.
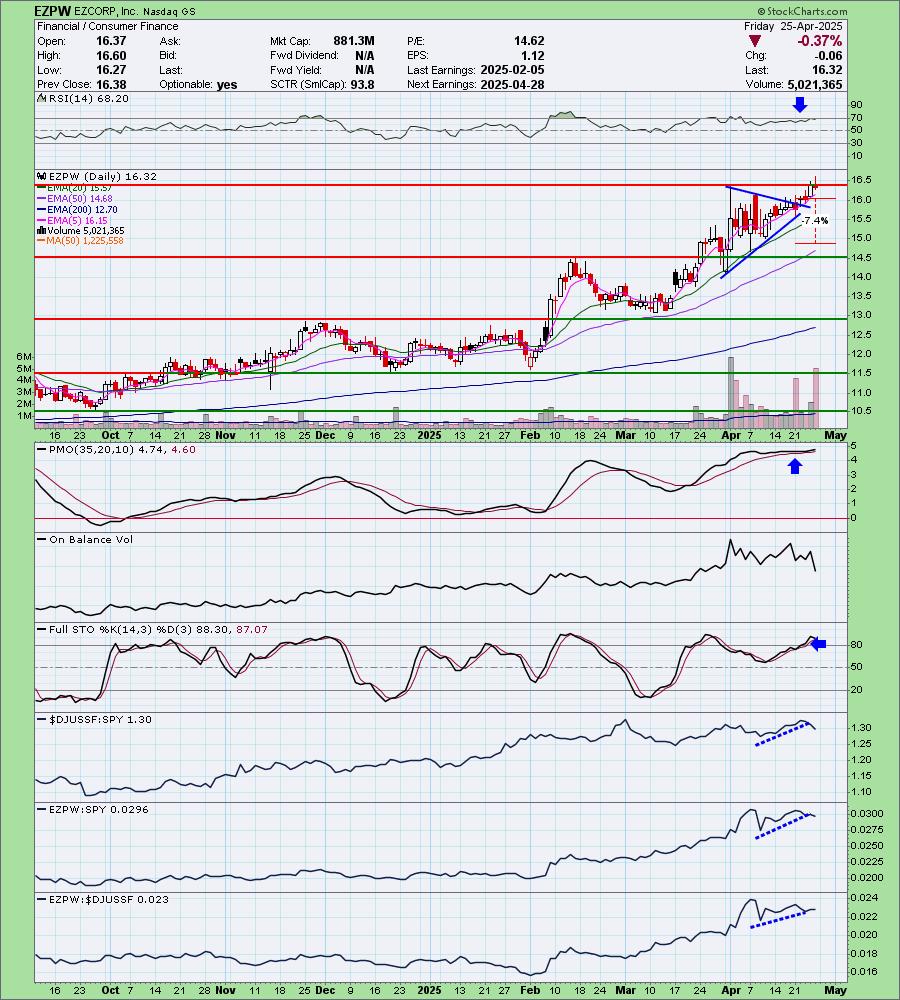
This week's "Darling" was EZCORP Inc (EZPW). It came up in the scans again this morning and still looks good to move higher.
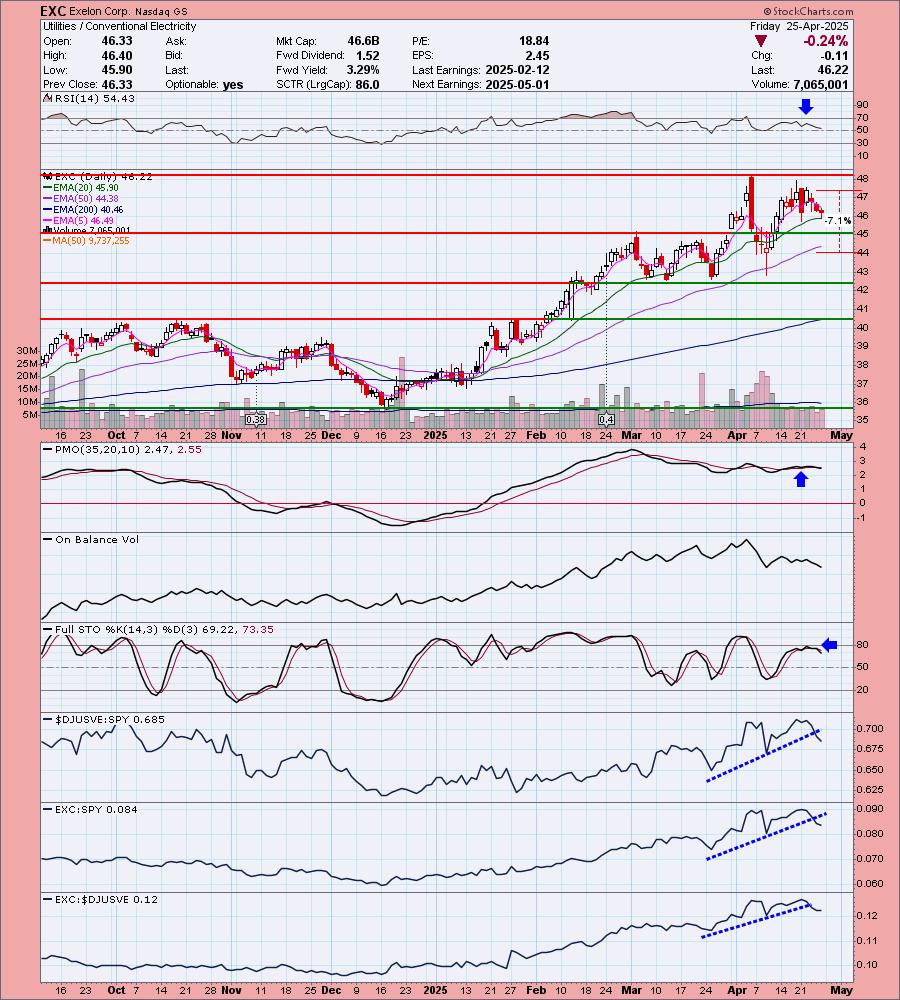
This week's "Dud" was Exelon Corp (EXC) which saw an over 2% decline since being picked on Tuesday. As I already said, Utilities were gifted with as good a week as the other sectors and this led to a losing position.
I had time to run some scans at the end of the trading room and found a handful of stocks that look very interesting right now. I will say that the scans weren't all that impressive this morning so we do have to be careful in the consideration of the symbols I did find: GOGO, GEO, CNP, CVLT AND FLG.
Have a terrific weekend! I'll see you in Monday's trading room for a big announcement!
Good Luck & Good Trading,
Erin

Diamond Mine Trading Room:
RECORDING & DOWNLOAD LINK (4/25/2025):
Topic: DecisionPoint Diamond Mine (4/25/2025) LIVE Trading Room
Download & Recording LINK
Passcode: April#25
REGISTRATION for 5/2/2025:
When: May 2, 2025 09:00 AM Pacific Time (US and Canada)
Topic: DecisionPoint Diamond Mine LIVE Trading Room
Register in advance for this webinar HERE
After registering, you will receive a confirmation email containing information about joining the webinar.

Below is the latest free DecisionPoint Trading Room recording from 4/21/2025. You'll find these recordings posted on Mondays to our DP YouTube Channel. Be sure and subscribe HERE.
A few items about the spreadsheet: I've put on the spreadsheet whether the RSI is positive (green) or negative (red). The PMO column tells you if it is rising (green) or falling (red). Finally I've added my own "Sparkle Factor" that gives you my assessment going forward, bullish (green), bearish (red) or neutral (gray). The Sparkle Factor is basically my thoughts on whether I expect it to rise or fall. A neutral means it could really go either way so it could be added to a watch list. If you're in a stock I consider "neutral" going forward, the ball is in your court.

Darling:
EZCORP, Inc. (EZPW)
EARNINGS: 2025-05-07 (AMC)
EZCORP, Inc. engages in the provision of pawn services. The firm also sells merchandise, primarily collateral forfeited from pawn lending operations and used merchandise purchased from customers. It operates through the following segments: U.S. Pawn, Latin America Pawn, and Other Investments. The U.S. Pawn segment includes EZPAWN, Value Pawn and Jewelry, and other branded pawn operations. The Latin America Pawn segment consists of Empeño Fácil, Cash Apoyo Efectivo, and other branded pawn operations in Mexico, as well as GuatePrenda and MaxiEfectivo pawn operations in Guatemala, El Salvador, and Honduras. The company was founded in 1989 and is headquartered in Rollingwood, TX.
Predefined Scans Triggered: Elder Bar Turned Green, P&F Ascending Triple Top Breakout and P&F Double Top Breakout.
Below are the commentary and chart from Tuesday, 4/22:
"EZPW is down -0.31% in after hours trading. Here we have another strong rising trend. We also have a symmetrical triangle with an upside breakout. The RSI is positive and not overbought. The PMO is flat above the signal line signifying pure strength. The PMO has also surged above the signal line. Stochastics are now above 80. The group is showing good relative strength and EZPW is outperforming both the group and the SPY. The stop is set between the 20/50-day EMAs at 7.4% or $14.86."
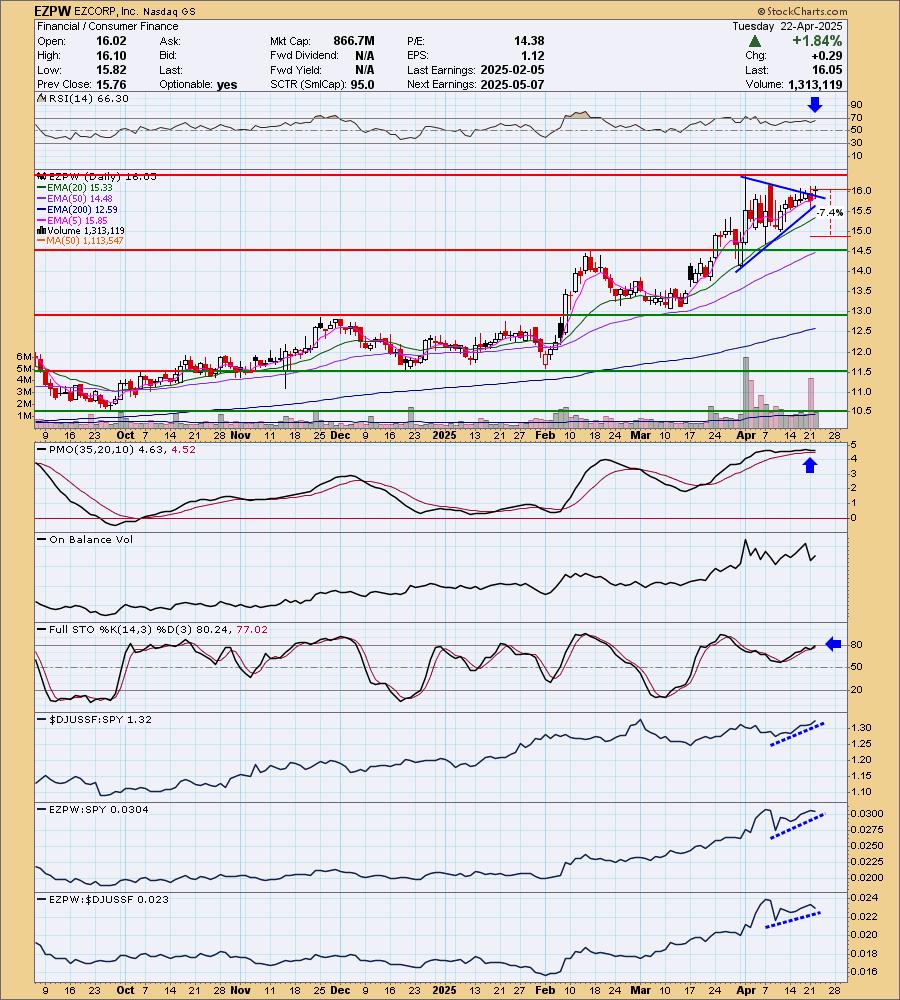
Here is today's chart:
We got the expected upside breakout from the symmetrical triangle formation. Remember these are continuation patterns and suggest the prior trend will continue out of them. Price is basically above overhead resistance based on closing prices. The PMO is still flat above the zero line suggesting pure strength. Relative strength has calmed, but is acceptable at this point. I'd like to see the group start to perform again. Overall I think this one could be added now.
Don't forget, on Thursdays I look at reader-requested symbols, so shoot me an email at erin@decisionpoint.com. I read every email I receive and try to answer them all!
Dud:
Exelon Corp. (EXC)
EARNINGS: 2025-05-01 (BMO)
Exelon Corp. is a utility services holding company, which engages in the energy distribution and transmission businesses. It operates through the following segments: Commonwealth Edison Company, PECO Energy Company, Baltimore Gas and Electric Company, Potomac Electric Power Company, Delmarva Power and Light Company, and Atlantic City Electric Company. The company was founded on February 4, 1999 and is headquartered in Chicago, IL.
Predefined Scans Triggered: Elder Bar Turned Green.
Below are the commentary and chart from Tuesday, 4/22:
"EXC is up +0.40% in after hours trading. Here is another nice rising trend on a daily chart. They aren't that easy to find right now. We have a positive and not overbought RSI. The PMO is flat above the zero line suggesting pure strength. The PMO also surged (bottomed) above the signal line. Stochastics are nearing 80 and relative strength is looking good across the board. It is close to overhead resistance, but I'm fairly confident we'll get a breakout based on these indicators and its rising trend. The stop is set at the 50-day EMA at 7.1% or $44.00."
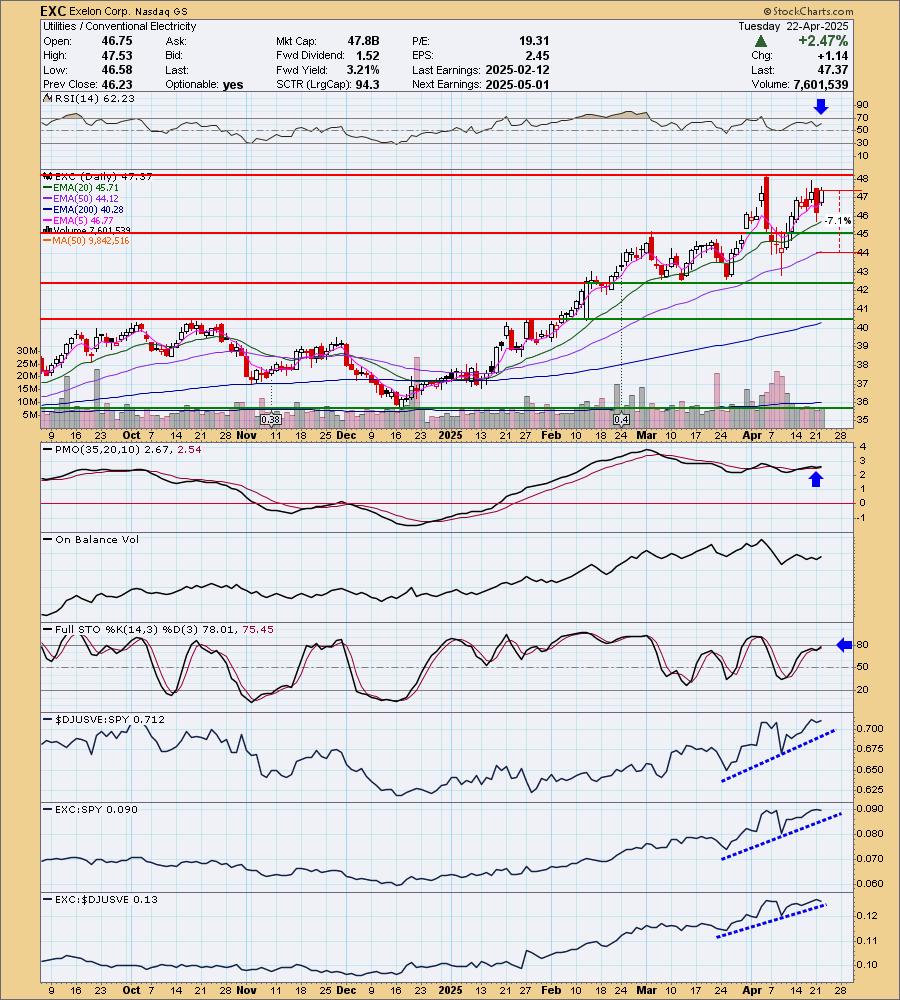
Here is today's chart:
There is still a rising trend despite the pullback and the RSI is still holding in positive territory. This is why I gave it a Neutral Sparkle Factor. I couldn't give it a green Sparkle Factor due to its possible double top developing. However, it is holding above support still and could rebound at that level so I couldn't give it a red Sparkle Factor either. The PMO and Stochastics don't look healthy and the group is starting to underperform. The problem with this one is the sinking industry group.
THIS WEEK's Performance:
DecisionPoint Market Scoreboard (Mechanical Trend Model Signals):
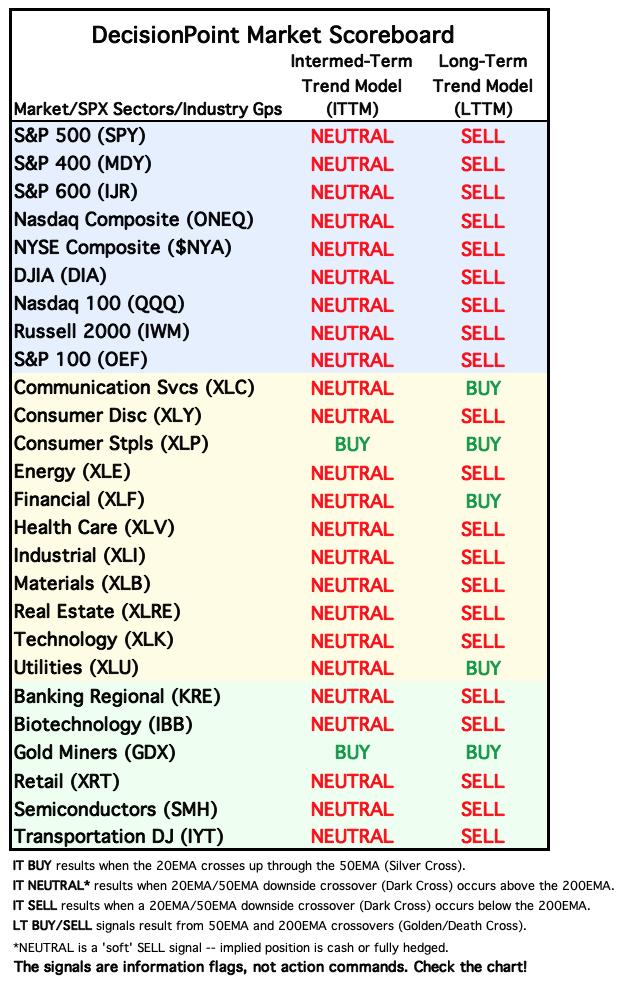
Friday signal changes are outlined in purple.
Click Here to view Carl's annotated "Under the Hood" ChartList!
Sector to Watch: Technology (XLK)
If this rally is for real, this will be the place to be on a rally continuation. The beat down Technology sector is overdue for a good rally and so far it looks pretty good. It isn't textbook, but you could say we have a double bottom formation and today's rally confirmed the pattern with a move above the confirmation line. Price is still beneath the 50-day EMA and that could pose a problem next week. We'll see if the rally can keep going.
Participation is really getting strong for %Stocks > 20EMA but admittedly that is already creeping into overbought territory. I like the big move on %Stocks > 50EMA. The RSI just moved into positive territory and the PMO is rising strongly despite being so far below the zero line. The Silver Cross Index is very oversold and the Golden Cross Index has turned back up. Stochastics look good and we're seeing the requisite outperformance against the SPY.
Industry Group to Watch: Software ($DJUSDT)
I was scrutinizing the chart more closely this afternoon and I spotted a reverse head and shoulders pattern. Price is above the 50-day EMA now and is headed to test resistance at the 200-day EMA. The upside target of the pattern would take price to at least the January high if it fulfills. The PMO has surged above the signal line and Stochastics are above 80. Relative strength is really picking up here. The stocks I found in this group that you may want to take a look at are: PLTR, DUOL, CRWD, STNE, OKTA, NET, PAGS and FTNT.
Go to our Under the Hood ChartList on DecisionPoint.com to get an in-depth view of all the sectors. On StockCharts.com you can find the Industry Summary.
Good Luck & Good Trading!
- Erin
erin@decisionpoint.com
Full Disclosure: I'm 10% long, 0% short. I may start inching in a little bit next week.
Watch the latest episode of the DecisionPoint Trading Room with Carl & Erin Swenlin HERE!
Technical Analysis is a windsock, not a crystal ball. --Carl Swenlin
NOTE: The stocks reported herein are from mechanical trading model scans that are based upon moving average relationships, momentum and volume. DecisionPoint analysis is then applied to get selections from the scans. The selections given should prompt readers to do a chart review using their own analysis process. This letter is not a call for a specific action to buy, sell or short any of the stocks provided. There are NO sure things or guaranteed returns on the selection of "diamonds in the rough."
Helpful DecisionPoint Links:
DecisionPoint Shared ChartList and DecisionPoint Chart Gallery
Price Momentum Oscillator (PMO)
Swenlin Trading Oscillators (STO-B and STO-V)
(c) Copyright 2025 DecisionPoint.com