
I would like to start off by thanking the three subscribers who sent in requests today. I really enjoy seeing what you're seeing! Today's selections are quite interesting, with two I'm surprised I'm presenting.
The first is Semiconductor AMAT. I can't believe I'm presenting a tech stock, but if we're going to see a bear market rally continue, like today, I think you'll see a lot of movement in stocks like this one. It has a nice setup, but be prepared to be nimble if the trade starts to go south again.
The second is a Utility with a beautiful rising trend and good indicators to back it up, EBR/B.
The third is in Materials which I haven't been impressed with, but Steel seems to be coming to life and this steel company is set up quite well, MT.
Tomorrow is the Diamond Mine trading room! Hope to get a bigger group this week. The Thursday start last week seemed to have lightened attendance.
Good Luck & Good Trading,
Erin
Today's "Diamonds in the Rough": AMAT, EBR/B and MT.
Other requests: DTE, ING and MNSB.

Diamond Mine Trading Room:
RECORDING & DOWNLOAD LINK (4/17/2025):
Topic: DecisionPoint Diamond Mine (4/17/2025) LIVE Trading Room
Recording & Download LINK
Passcode: April#17
REGISTRATION for 4/25/2025:
When: April 25, 2025 09:00 AM Pacific Time (US and Canada)
Topic: DecisionPoint Diamond Mine LIVE Trading Room
Register in advance for this webinar HERE
After registering, you will receive a confirmation email containing information about joining the webinar.

Below is the latest free DecisionPoint Trading Room recording from 4/21. You'll find these recordings posted on Mondays to our DP YouTube Channel. Be sure and subscribe HERE.
Welcome to DecisionPoint Diamonds, wherein I highlight ten "Diamonds in the Rough" per week. These are selected from the results of my DecisionPoint Scans which search for stocks that could benefit from the trend and condition of the market. Remember, these are not recommendations to buy or sell, but are the most interesting of the stocks that surfaced in my scans. My objective is to save you the work of the initial, tedious culling process, but you need to apply your own analysis to see if these stocks pique your interest as well. There are no guaranteed winners here!
"Predefined Scans Triggered" are taken from StockCharts.com using the "Symbol Summary" option instead of a "SharpChart" on the workbench.
Stop levels are all rounded down.
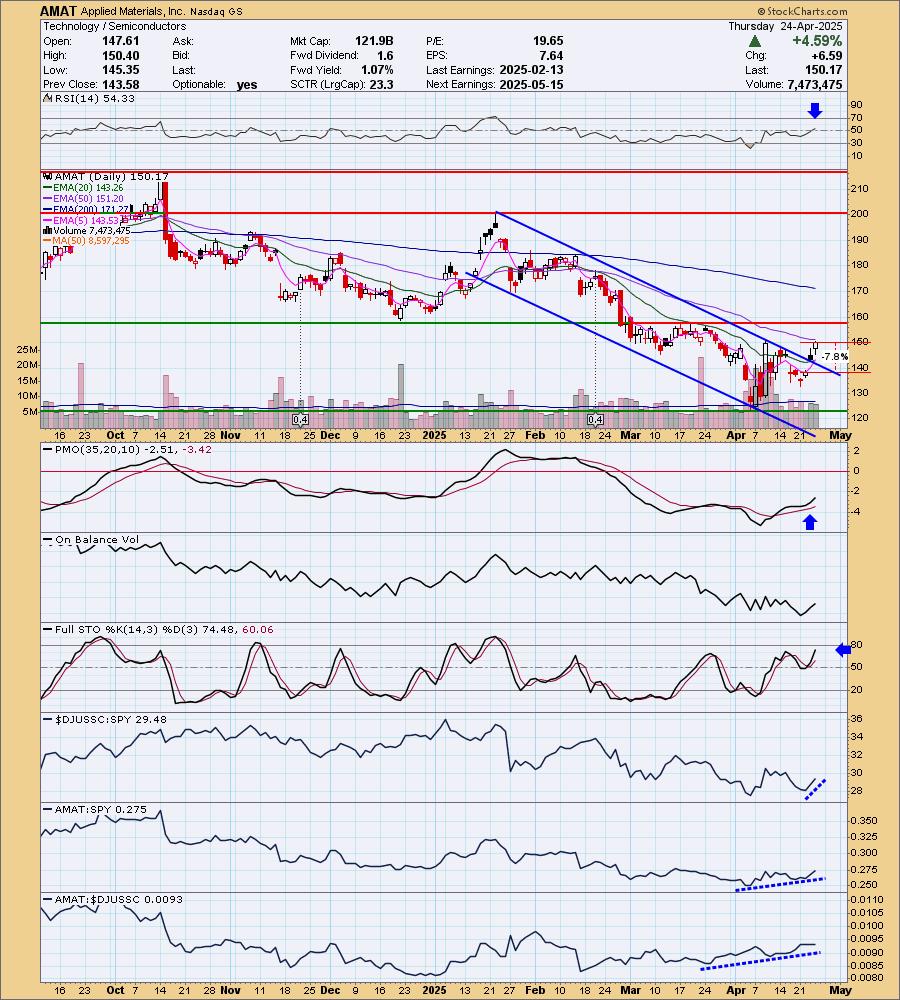
Applied Materials, Inc. (AMAT)
EARNINGS: 2025-05-15 (AMC)
Applied Materials, Inc. provides manufacturing equipment, services and software to the semiconductor, display and related industries. It operates through the following segments: Semiconductor Systems, Applied Global Services, and Display & Adjacent Markets. The Semiconductor Systems segment includes semiconductor capital equipment for etch, rapid thermal processing, deposition, chemical mechanical planarization, metrology and inspection, wafer packaging, and ion implantation. The Applied Global Services segment provides solutions to optimize equipment, performance, and productivity. The Display & Adjacent Markets segment offers products for manufacturing liquid crystal displays, organic light-emitting diodes, equipment upgrades, and other display technologies for TVs, monitors, laptops, personal computers, smart phones, and other consumer-oriented devices. The company was founded on November 10, 1967 and is headquartered in Santa Clara, CA.
Predefined Scans Triggered: New CCI Buy Signals and P&F Double Top Breakout.
AMAT is down -0.05% in after hours trading. I do like this bottoming formation that kind of reminds me of a reverse head and shoulders. Price got above the 20-day EMA and the 5-day EMA is crossing above the 20-day EMA for a ST Trend Model BUY Signal. The declining trend has also been broken. The RSI is just now positive. The PMO saw a previous surge above the signal line. Stochastics are also rising toward 80 after reversing in mostly positive territory. Relative strength is picking up for Semiconductors and AMAT is outperforming the group and the SPY. The stop is set where price would reenter the declining trend channel at 7.8% or $138.45.
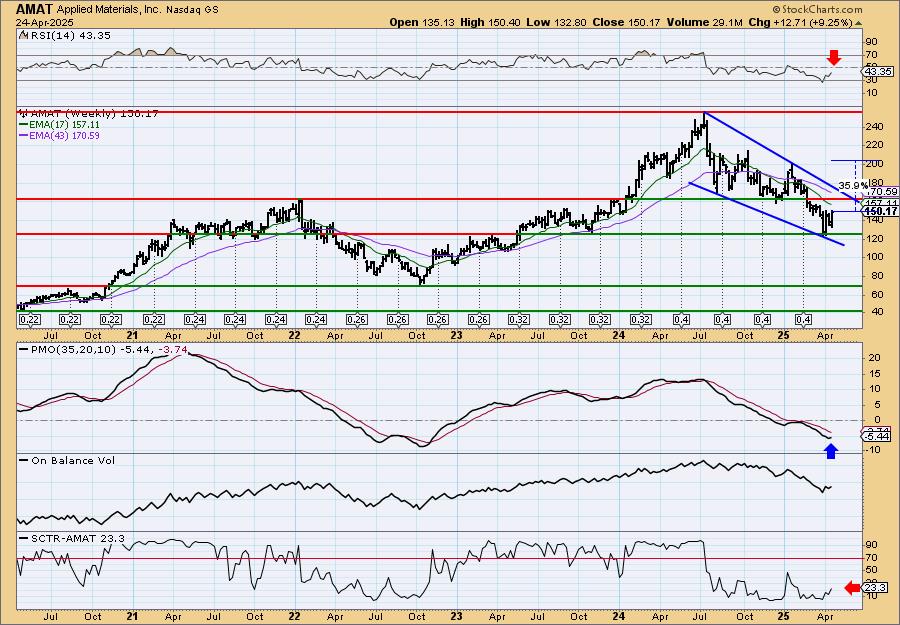
I really like the large bullish falling wedge on the weekly chart. It hasn't been confirmed with a breakout yet, but we do see that the weekly PMO is turning up for the first time since January. The weekly RSI is still negative so there is some weakness visible. The StockCharts Technical Rank (SCTR) is not in the hot zone* but it is at least rising again.
*If a stock is in the "hot zone" above 70, it implies that it is stronger than 70% of its universe (large-, mid-, small-caps and ETFs) primarily in the intermediate to long terms.
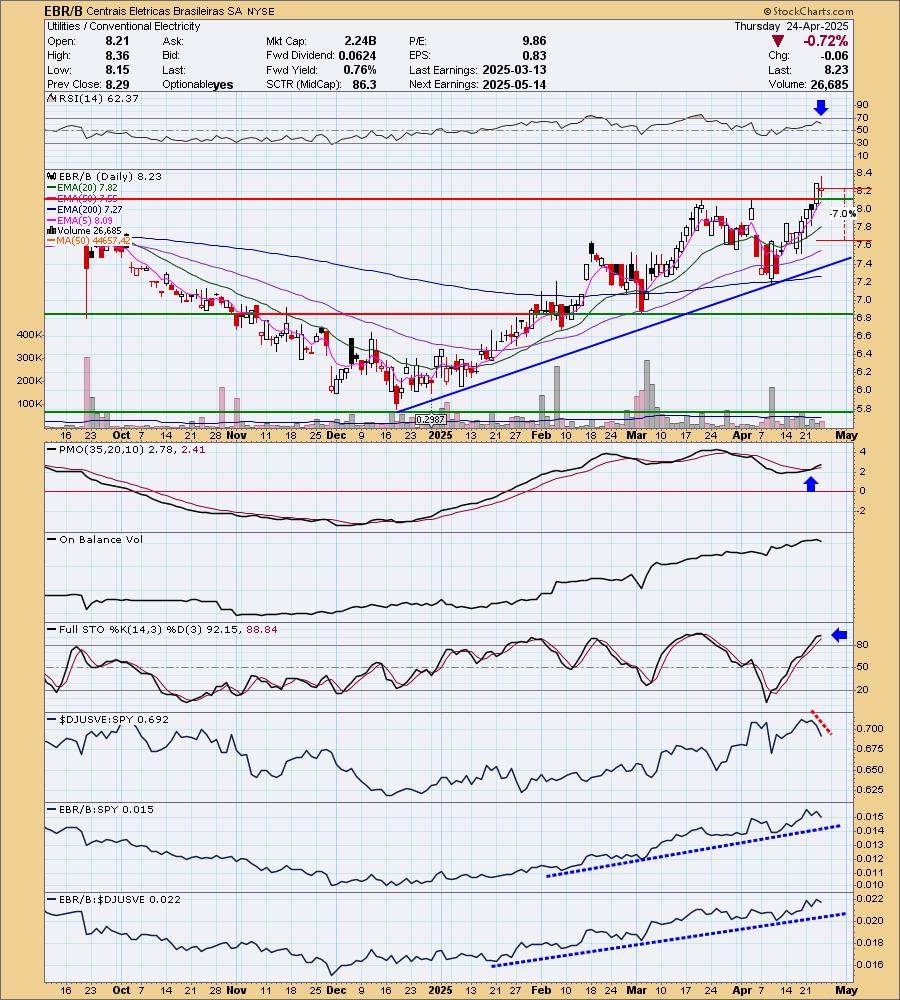
Centrais Eletricas Brasileiras SA (EBR/B)
EARNINGS: 2025-05-14 (AMC)
Centrais Elétricas Brasileiras SA engages in the production and dissemination of electricity. It operates through the Generation and Transmission segments. The Generation segment refers to the electric power generation including hydroelectric, thermal, and nuclear power plants. The Transmission segment focuses on the transmission of electric power in Brazil. The company was founded by Getulio Dornelles Vargas on June 11, 1962 and is headquartered in Rio de Janeiro, Brazil.
Predefined Scans Triggered: None.
EBR/B is unchanged in after hours trading. This is a beautiful rising trend and we even have a breakout. The EMAs are configured very positively due to the rising trend. The RSI is in positive territory and the PMO is on a relatively new Crossover BUY Signal that occurred above the zero line. The OBV is rising steadily confirming the rising trend. Stochastics are above 80. The group is beginning to underperform, but we still see great performance coming from EBR/B against the group and the SPY. The stop is set between the 20/50-day EMAs at 7% or $7.65.
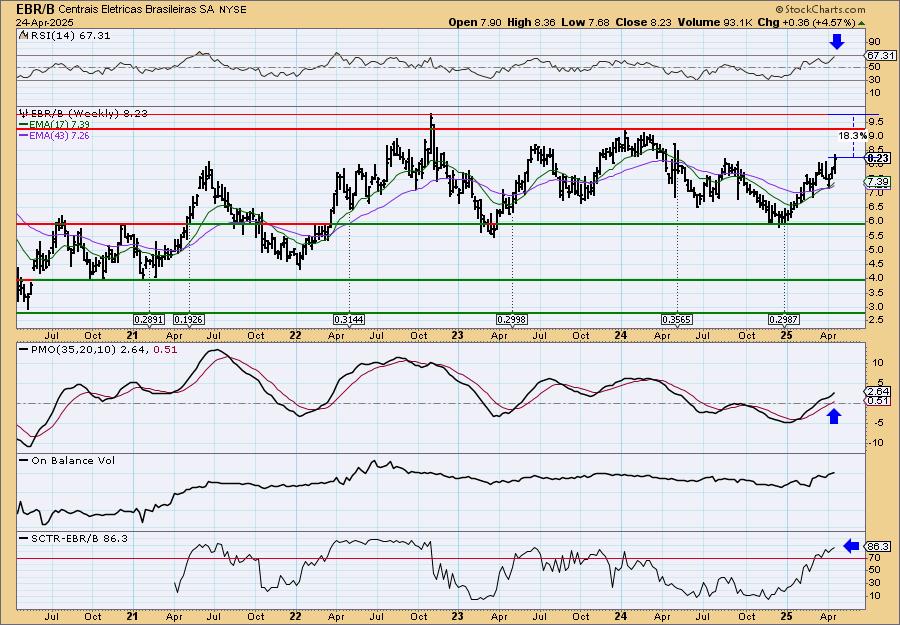
It is a trading range stock which doesn't impress me too much, but it's a Utility and this is usually par for the course. The good thing is that it is headed to test the top of the range. I think it will challenge the 2022 high as the indicators are in its favor. The weekly RSI is positive and not overbought. The weekly PMO is rising strongly above the zero line on a Crossover BUY Signal and it isn't overbought. The SCTR is well within the hot zone.
ArcelorMittal SA (MT)
EARNINGS: 2025-04-30 (BMO) ** Reports next week **
ArcelorMittal SA is a holding company, which engages in steelmaking and mining activities. It operates through the following business segments: NAFTA; Brazil; Europe; Africa and Commonwealth of Independent States (ACIS), and Mining. The NAFTA segment consists of flat products such as slabs, hot-rolled coil, cold-rolled coil, coated steel, and plate. The Brazil segment covers wire rod, bar and rebars, billets, blooms, and wire drawing. The Europe segment offers hot-rolled coil, cold-rolled coil, coated products, tinplate, plate, and slab. The ACIS segment produces a combination of flat, long, and tubular products. The Mining segment focuses on steel operations. The company was founded by Lakshmi Niwas Mittal in 1976 and is headquartered in Luxembourg.
Predefined Scans Triggered: None.
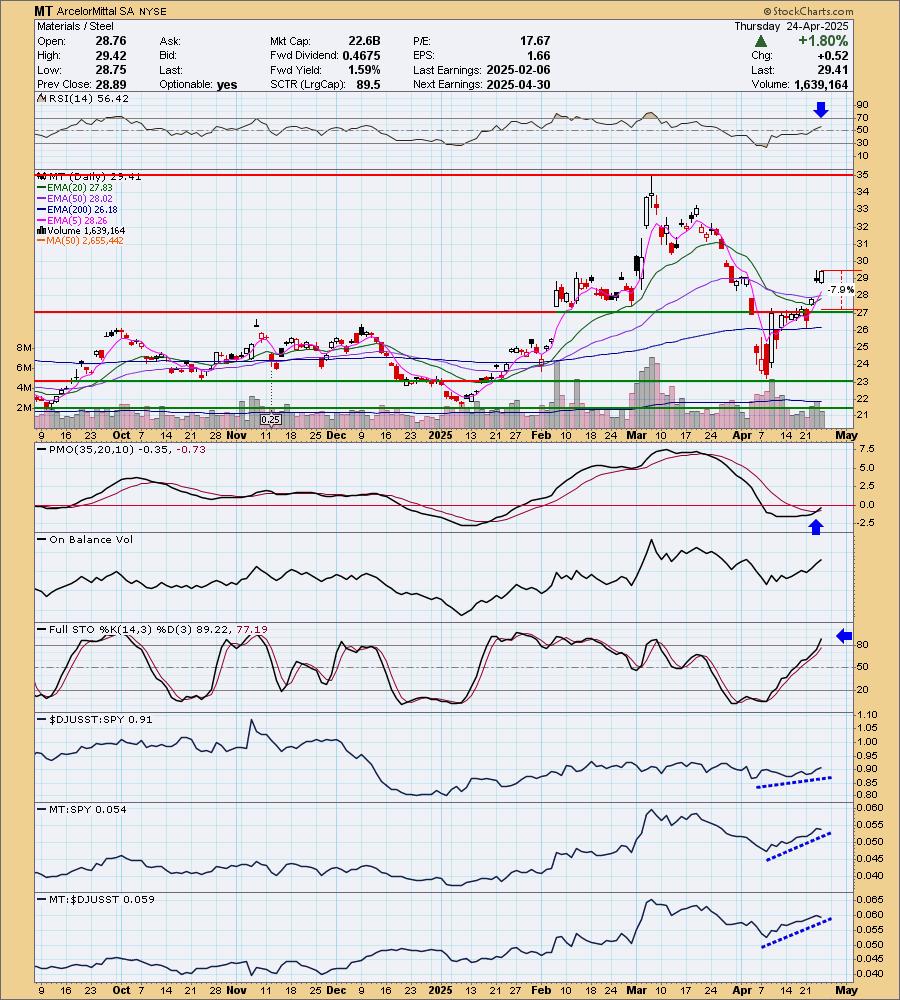
MT is unchanged in after hours trading. I like the rally out of the recent congestion zone. Price gapped up above the 50-day EMA yesterday. Today it formed a bullish engulfing candlestick. This also looks a little like a "V" Bottom which is a very bullish pattern. The RSI is positive and not at all overbought. The PMO is rising on a new Crossover BUY Signal very close to the zero line. The OBV is confirming the rally as it rises with price. Stochastics are rising above 80. The group is showing a little bit of outperformance right now. MT has very good performance against the group and the SPY. The stop is set as close to support as I was comfortable marking at 7.9% or $27.08.
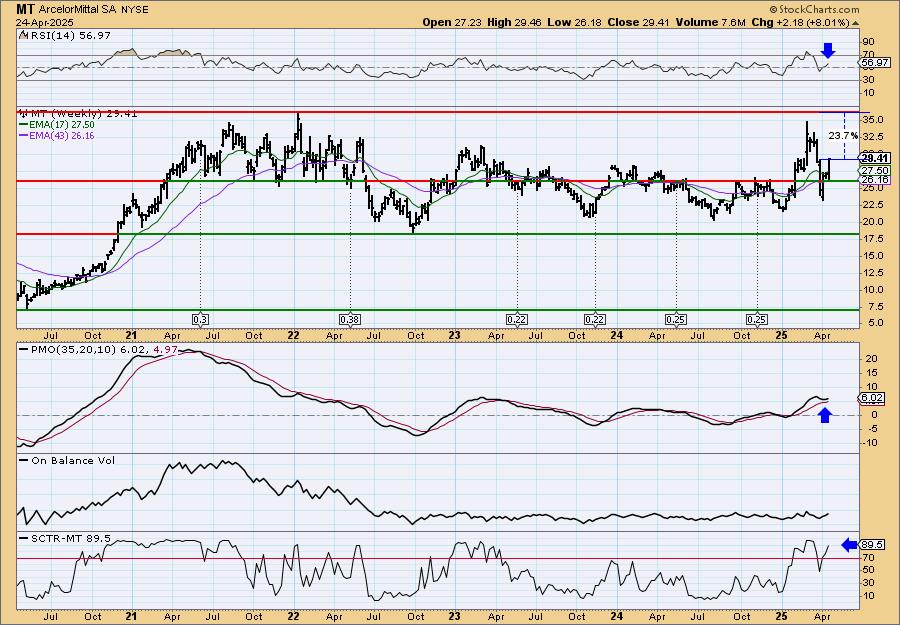
We have another chart in a trading range, but again it appears headed to test the top of this range right now. The weekly RSI is now in positive territory. The weekly PMO has surged (bottomed) above the signal line above the zero line which is especially bullish. The SCTR is in the hot zone above 70.
Don't forget, on Thursdays I look at reader-requested symbols, click HERE to send me an email. I read every email I receive and try to answer them all!
Current Market Outlook:
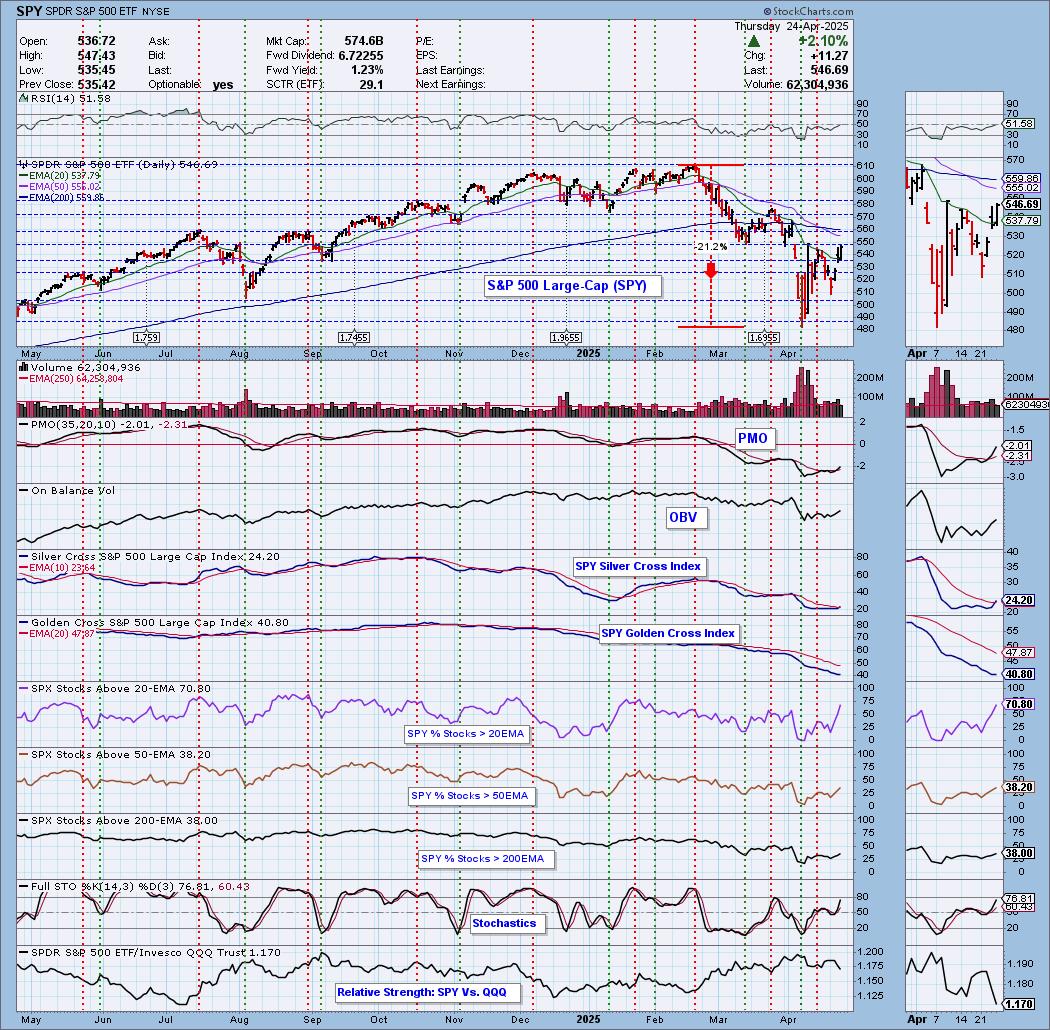
Market Environment: It is important to consider the odds for success by assessing the market tides. The following chart uses different methodologies for objectively showing the depth and trend of participation for intermediate- and long-term time frames.
- The Silver Cross Index (SCI) shows the percentage of SPX stocks on IT Trend Model BUY signals (20-EMA > 50-EMA)
- The Golden Cross Index (GCI) shows the percentage of SPX stocks on LT Trend Model BUY signals (50-EMA > 200-EMA)
Don't forget that as a "Diamonds" member, you have access to our "Under the Hood" curated ChartList on DecisionPoint.com. You'll find it under "Members Only" links on the left side on the Blogs and Links Page.
Here is the current chart:
Full Disclosure: I am 10% long, 0% short.
I'm required to disclose if I currently own a stock I mention and/or may buy/short it within the next 72 hours.
"Technical Analysis is a windsock, not a crystal ball." - Carl Swenlin
(c) Copyright 2025 DecisionPoint.com
Watch the latest episode of DecisionPoint Trading Room with Carl Swenlin & Erin Swenlin Mondays on the DecisionPoint YouTube channel here!
NOTE: The stocks reported herein are from mechanical trading model scans that are based upon moving average relationships, momentum and volume. DecisionPoint analysis is then applied to get five selections from the scans. The selections given should prompt readers to do a chart review using their own analysis process. This letter is not a call for a specific action to buy, sell or short any of the stocks provided. There are NO sure things or guaranteed returns on the daily selection of "Diamonds in the Rough."
Regarding BUY/SELL Signals: The signal status reported herein is based upon mechanical trading model signals and crossovers. They define the implied bias of the price index/stock based upon moving average relationships and momentum, but they do not necessarily call for a specific action. They are information flags that should prompt chart review. Further, they do not call for continuous buying or selling during the life of the signal. For example, a BUY signal will probably (but not necessarily) return the best results if action is taken soon after the signal is generated. Additional opportunities for buying may be found as price zigzags higher, but the trader must look for optimum entry points. Conversely, exit points to preserve gains (or minimize losses) may be evident before the model mechanically closes the signal.
Helpful DecisionPoint Links:
Price Momentum Oscillator (PMO)
Swenlin Trading Oscillators (STO-B and STO-V)
For more links, go to DecisionPoint.com