
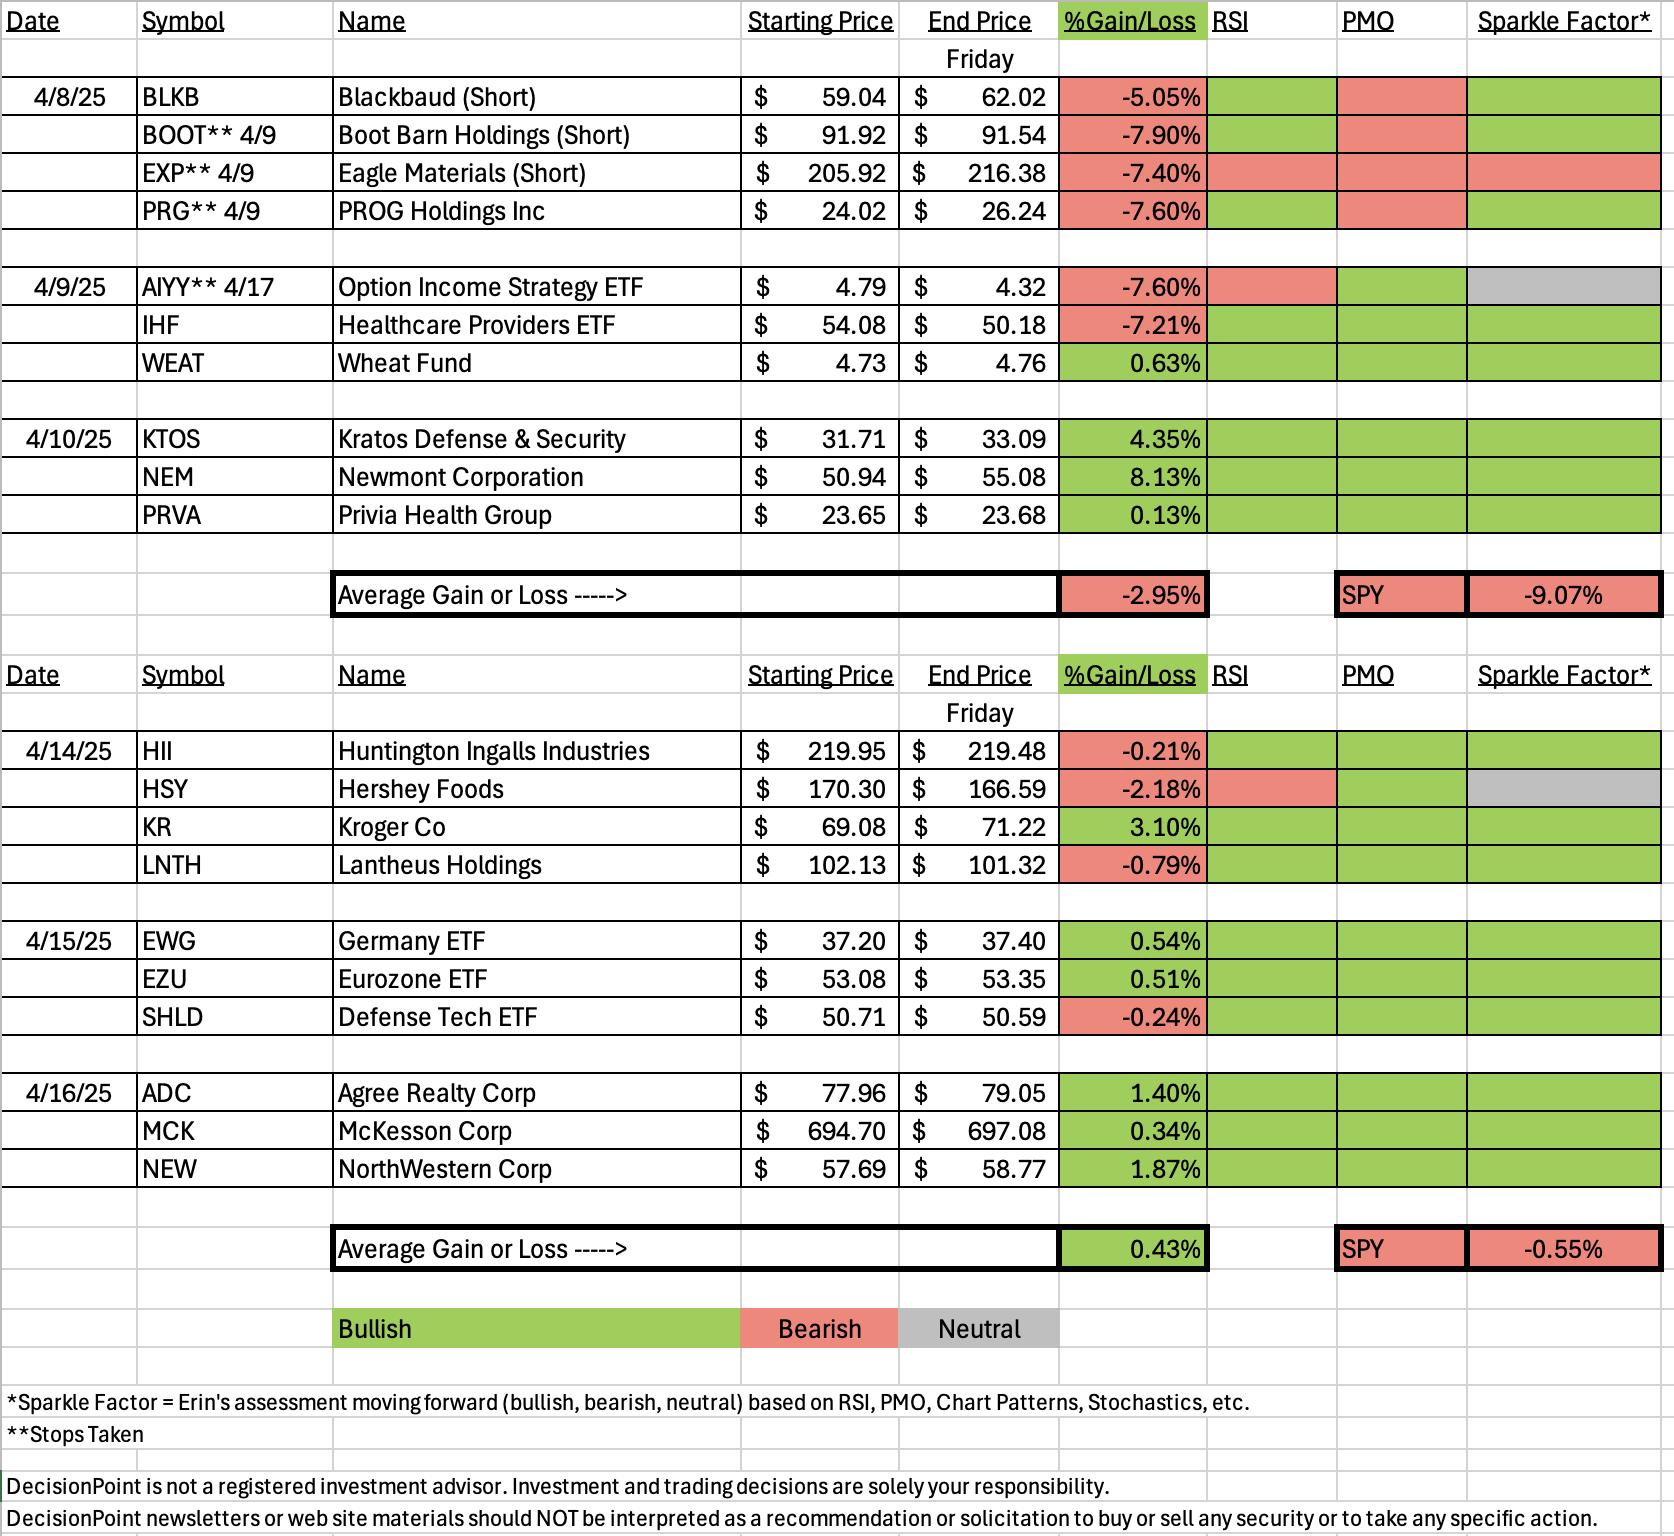
We saw a big improvement on the spreadsheet this week. Even last week started to look better. It wasn't much of a rally today, but yesterday's "Diamonds in the Rough" performed very well. I made a concerted effort to find rising trends and it seems to have paid off, at least for one trading day!
This week's Darling was Kroger (KR) which was up over 3% since being picked on Monday. The chart is shaping up nicely as you'll see below.
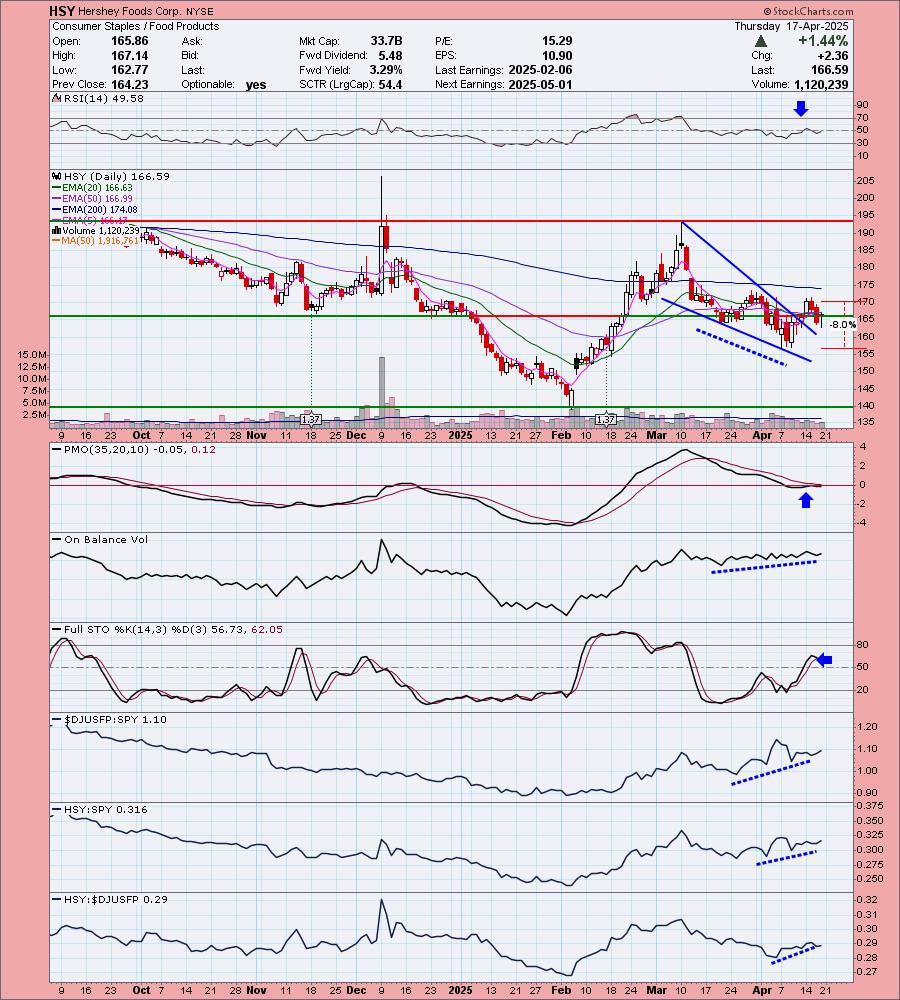
This week's Dud was Hershey Foods (HSY). I was surprised by this one as it had a beautiful positive OBV divergence on the chart that usually will lead to extended rallies. It isn't completely over for HSY, we'll look at its setup below.
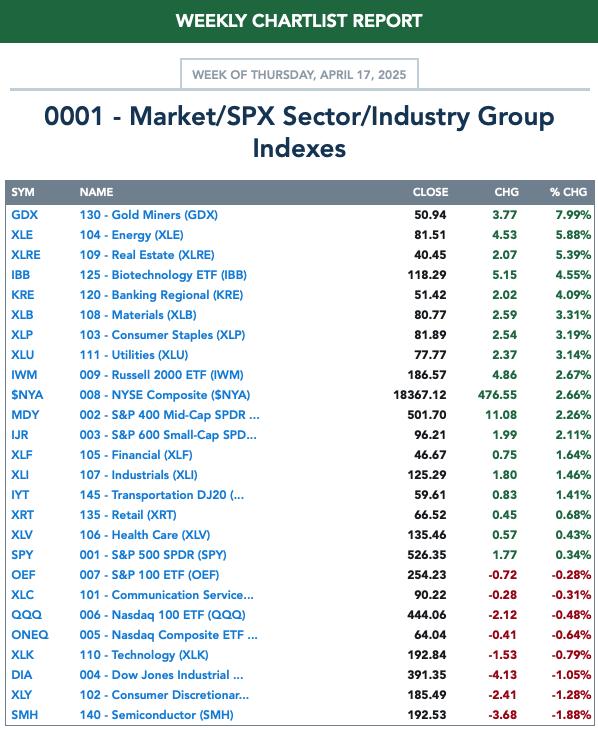
The Sector to Watch had to be Real Estate (XLRE). It is rallying strongly and is considered somewhat defensive which suits me right now with the market trying to top again. Close second would be Energy (XLE) which is making a nice move, I just don't trust Crude Oil to keep up its rally and that will likely mean a quick downturn if it begins to fail. Staples (XLP) and Utilities (XLU) still look pretty good although they weren't as strong under the hood in my opinion as compared to XLRE. That may've changed after the close, but I'm happy with XLRE.
The Industry Group to Watch was a little tricky to find as most groups are in declining trends. All but one are making a nice move higher so I think we'd be fine in most any of the groups within XLRE. I chose Diversified REITS. I found a few symbols to watch next week: GNL, WPC, MRP and MDV.
I ran a few scans at the end of the trading room and we did find a good group of stocks to watch going into next week: ED, AMT, NRG, AEP, PNW and JNJ.
Have a wonderful long weekend! Happy Easter!
Good Luck & Good Trading,
Erin

Diamond Mine Trading Room:
RECORDING & DOWNLOAD LINK (4/17/2025):
Topic: DecisionPoint Diamond Mine (4/17/2025) LIVE Trading Room
Recording & Download LINK
Passcode: April#17
REGISTRATION for 4/25/2025:
When: April 25, 2025 09:00 AM Pacific Time (US and Canada)
Topic: DecisionPoint Diamond Mine LIVE Trading Room
Register in advance for this webinar HERE
After registering, you will receive a confirmation email containing information about joining the webinar.

Below is the latest free DecisionPoint Trading Room recording from 4/14/2025. You'll find these recordings posted on Mondays to our DP YouTube Channel. Be sure and subscribe HERE.
A few items about the spreadsheet: I've put on the spreadsheet whether the RSI is positive (green) or negative (red). The PMO column tells you if it is rising (green) or falling (red). Finally I've added my own "Sparkle Factor" that gives you my assessment going forward, bullish (green), bearish (red) or neutral (gray). The Sparkle Factor is basically my thoughts on whether I expect it to rise or fall. A neutral means it could really go either way so it could be added to a watch list. If you're in a stock I consider "neutral" going forward, the ball is in your court.
Darling:
Kroger Co. (KR)
EARNINGS: 2025-06-20 (BMO)
The Kroger Co. engages in the retail grocery business with added convenience to retail pharmacies and fuel centers. Its main focus is on growing households and increasing customer loyalty by delivering great value and convenience, and investing in four strategic pillars: Fresh, Brands, Data & Personalization and Seamless. Its brands include Big K, Smart Way, Heritage Farm, Simple Truth, and Simple Truth Organic. The company was founded by Barney Kroger in 1883 and is headquartered in Cincinnati, OH.
Predefined Scans Triggered: New CCI Buy Signals.
Below are the commentary and chart from Monday, 4/14:
"KR is up +0.07% in after hours trading. I really liked the intermediate-term rising trend channel on the daily chart. Notice that price hasn't even had to test the bottom of the channel of late. The RSI is not at all overbought yet. The PMO is rising on a Crossover BUY Signal well above the zero line. The OBV shows volume coming in on the rally. Stochastics have just entered positive territory. Relative strength is good for the group and KR as all relative strength lines are trending upward. The stop is set beneath support at 7.3% or $64.03."
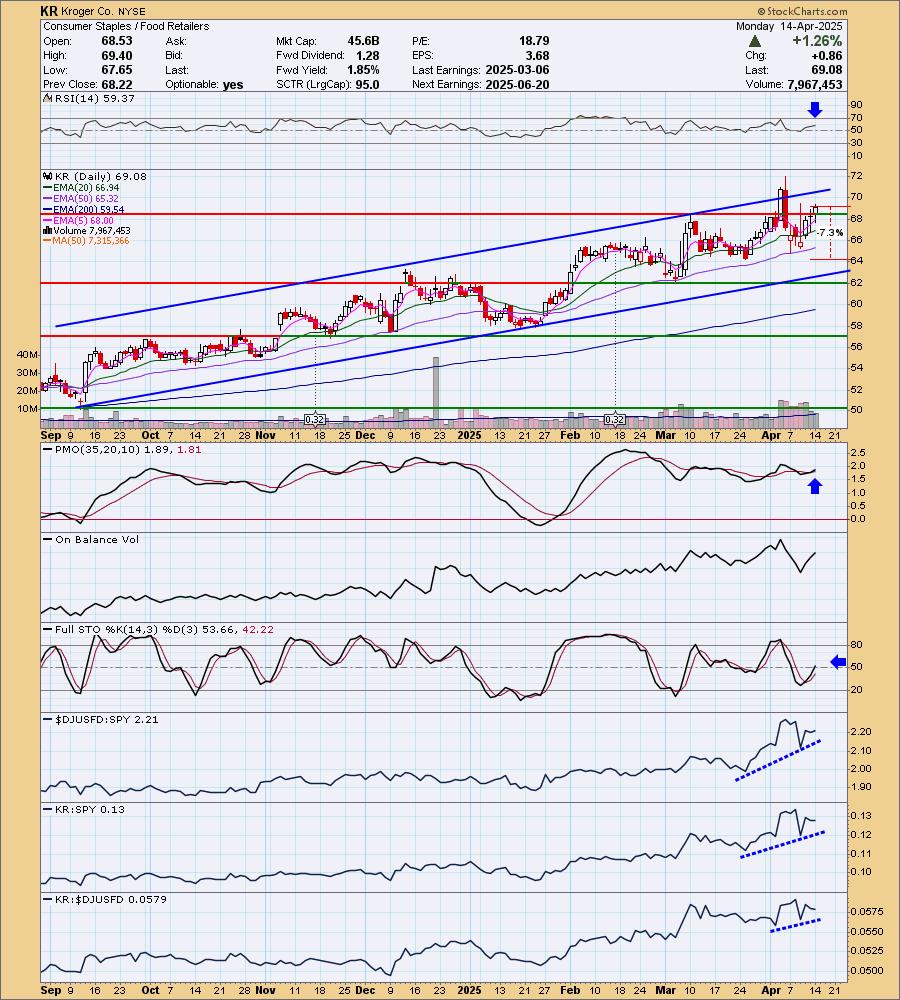
Here is today's chart:
It's extremely hard to find a chart with such a strong rising trend channel. It has certainly had its ups and downs within the channel but overall it has held up very well. We actually have a breakout above the channel which is especially bullish. Even with this nice rally, the RSI is not yet overbought so it could be set up for entry on a small pullback preferably, but it does look strong enough to continue on its way higher from here.
Don't forget, on Thursdays I look at reader-requested symbols, so shoot me an email at erin@decisionpoint.com. I read every email I receive and try to answer them all!
Dud:
Hershey Foods Corp. (HSY)
EARNINGS: 2025-05-01 (BMO)
The Hershey Co. engages in the manufacture and marketing of chocolate, sweets, mints and confectionery products. The firm operates through the following segments: North America Confectionery, North America Salty Snacks and International. The North America Confectionery segment is responsible for the traditional chocolate and non-chocolate confectionery market position of the company, as well as its grocery and snacks market positions, in the United States and Canada. The North America Salty Snacks segment is responsible for the salty snack products in the United States. The International segment includes the combination of all other operating segments, including those geographic regions where the company operates outside of North America. Its brands include Hershey's, Reese's, and Kisses. The company was founded by Milton S. Hershey in 1894 and is headquartered in Hershey, PA.
Predefined Scans Triggered: Bullish MACD Crossovers, Parabolic SAR Buy Signals and P&F Double Top Breakout.
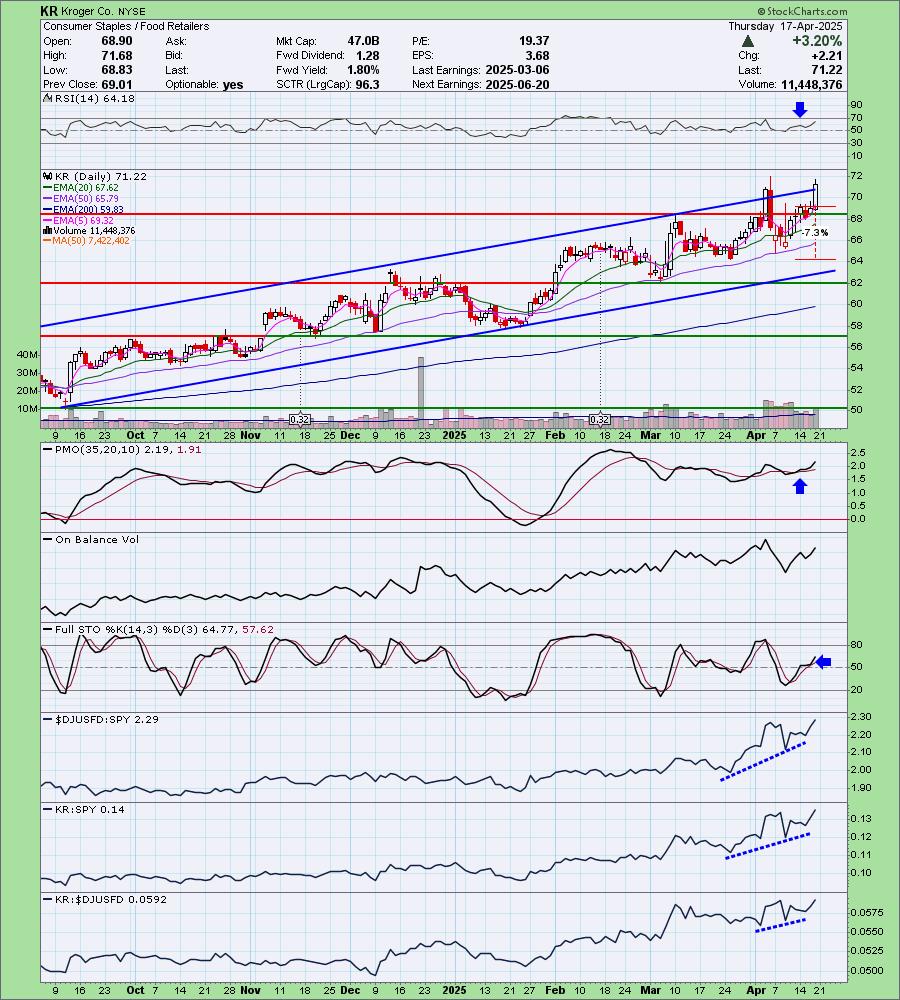
Below are the commentary and chart from Monday, 4/14:
"HSY is down -0.01% in after hours trading so it isn't taking much back from today's strong rally. Price has rallied out of a bullish falling wedge. The RSI only just hit positive territory. The PMO has turned up toward a Crossover BUY Signal. There is a very positive OBV divergence with price lows falling and OBV lows rising. Stochastics are now in positive territory and we see rising relative strength across the board. This is definitely one of my favorites today primarily due to that positive OBV divergence. The stop is set below support at 8% or $156.67."
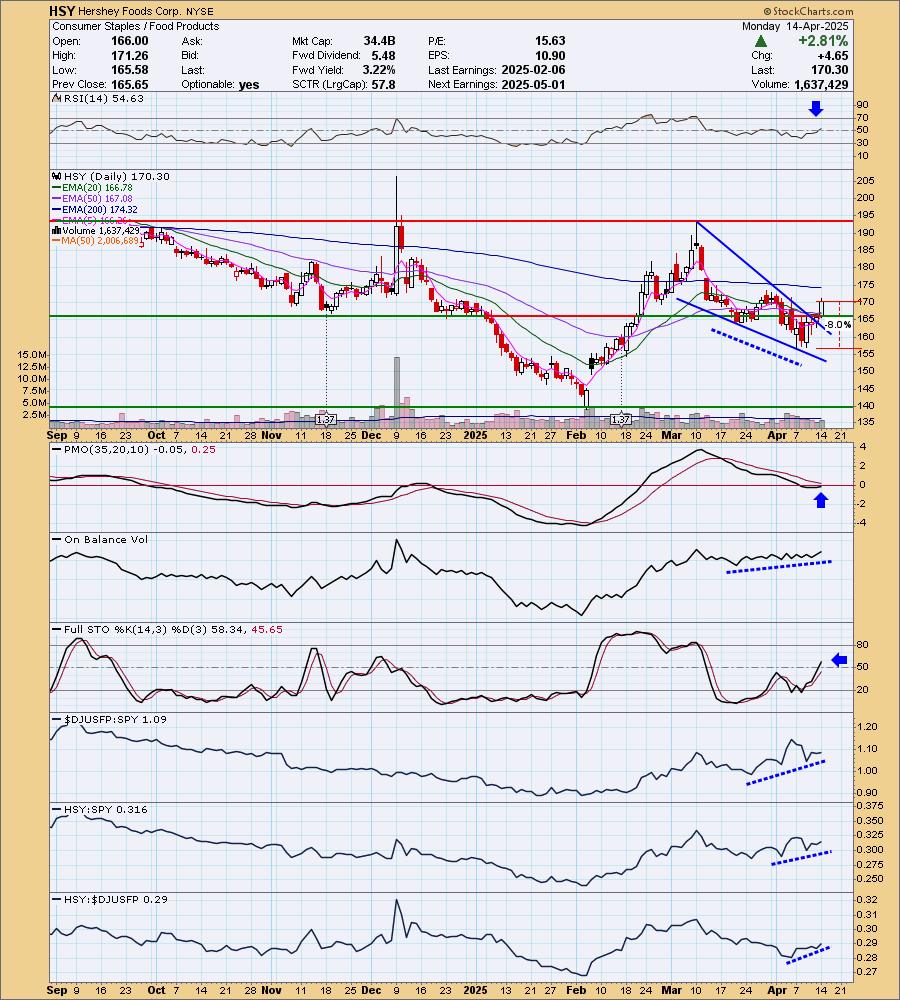
Here is today's chart:
It didn't do well this week but I do still think the chart has merit. I don't know that the OBV positive divergence has fully played out yet. We have what looks like a bullish hammer candlestick and price closed above support. The PMO is still technically rising although Stochastics did turn down before reaching 80. If I owned it I would probably hold it a bit longer and I think it could be an interesting entry on this pullback. It is in Consumer Staples and that could help move it higher. The group is also performing well right now.
THIS WEEK's Performance:
DecisionPoint Market Scoreboard (Mechanical Trend Model Signals):
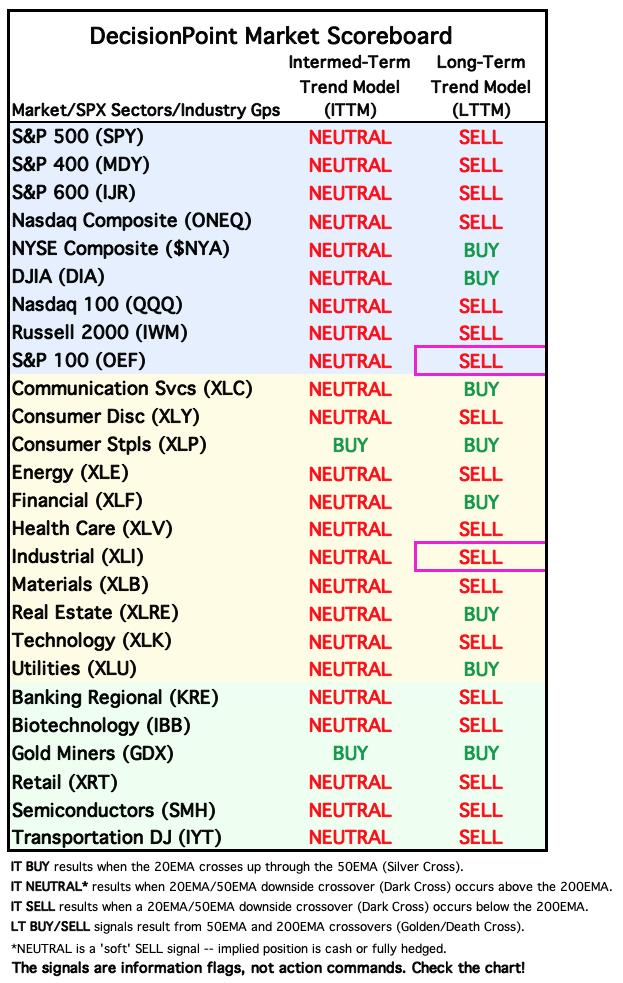
Friday signal changes are outlined in purple.
Click Here to view Carl's annotated "Under the Hood" ChartList!
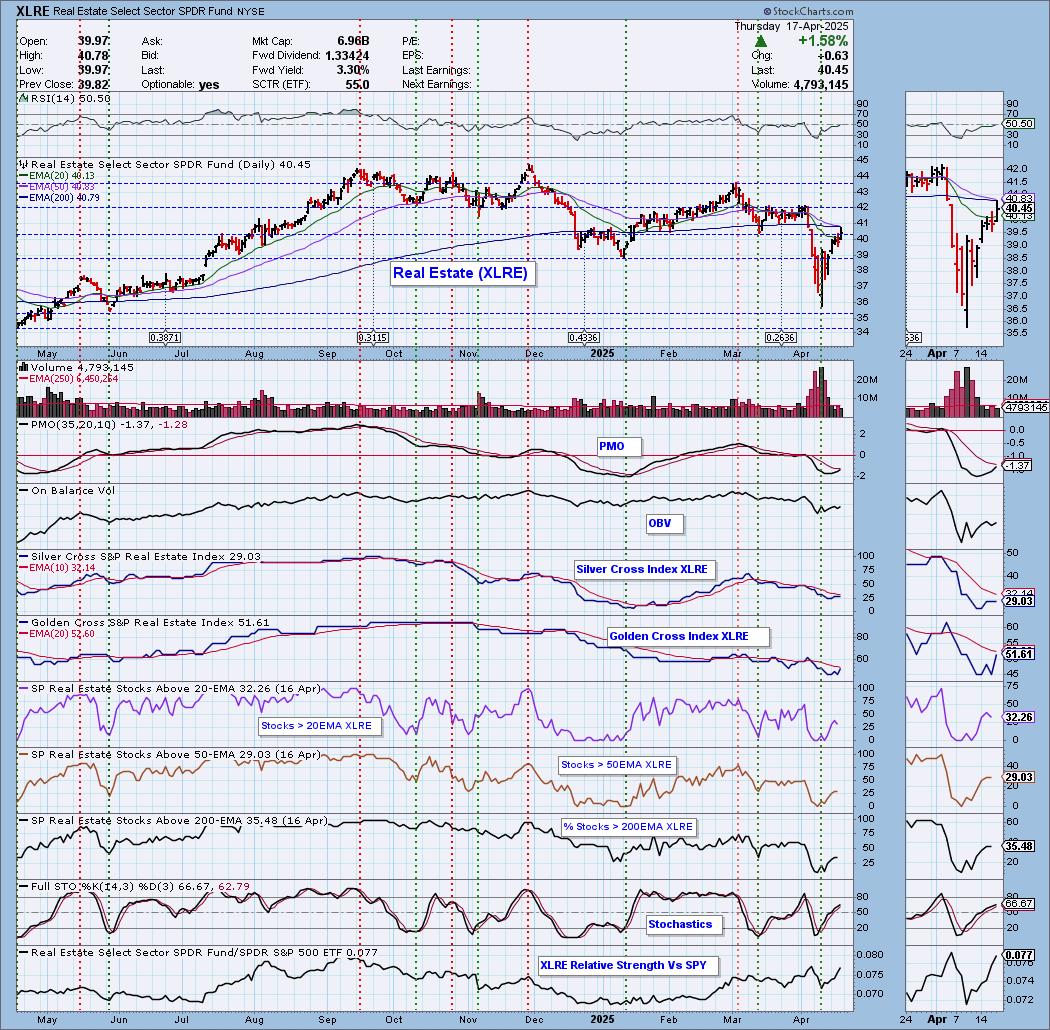
Sector to Watch: Real Estate (XLRE)
I really liked today's strong rally higher. It better get above the 200-day EMA soon or we will see a death cross of the 50/200-day EMAs. I wasn't happy that participation of stocks above key moving averages started to top today on the rally. That is a bit concerning. The Silver Cross Index is still at a very low reading and below its signal line so there is definitely work to do. Stochastics and the PMO look very promising right now. This one could continue to buck the market trend like it did today.
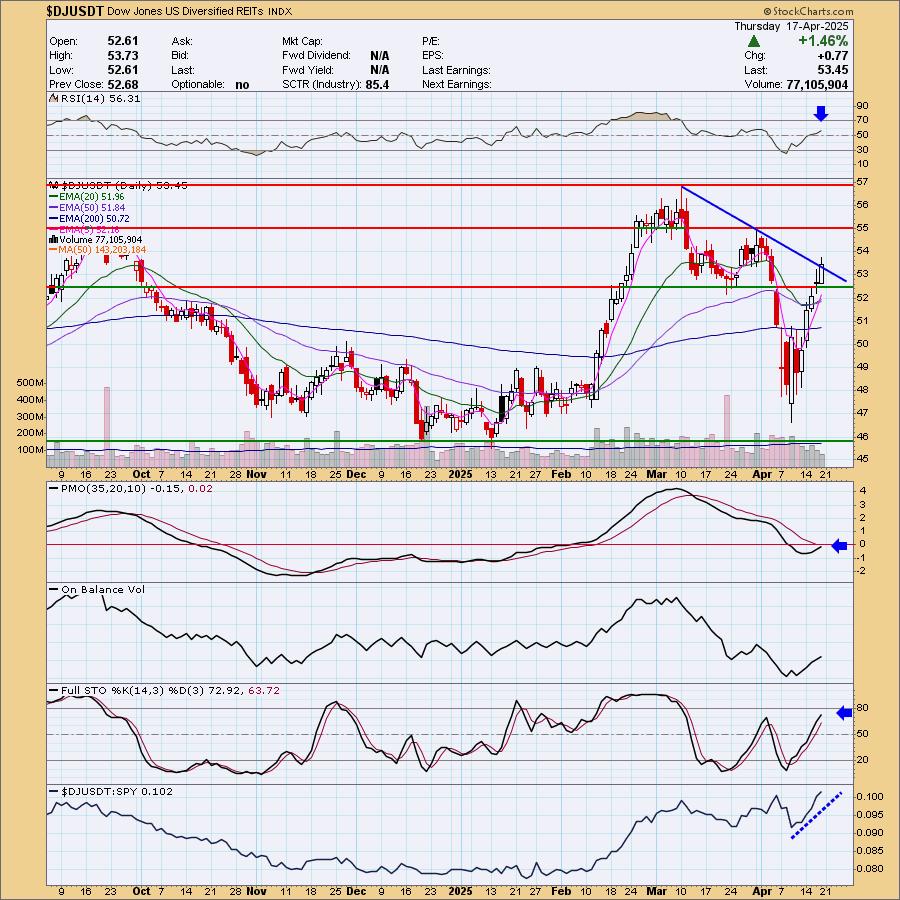
Industry Group to Watch: Diversified REITS ($DJUSDT)
The reason we went with this industry group is because it is in the process of breaking through its declining tops trendline. That is hard to find right now. The RSI is positive and not overbought. The PMO is going in for a Crossover BUY Signal. Stochastics are rising strongly toward 80. Relative strength is excellent for this group. I found the following symbols of interest from this group: GNL, WPC, MRP and MDV. All charts are worth a look.
Go to our Under the Hood ChartList on DecisionPoint.com to get an in-depth view of all the sectors. On StockCharts.com you can find the Industry Summary.
Good Luck & Good Trading!
- Erin
erin@decisionpoint.com
Full Disclosure: I'm 10% long, 0% short.
Watch the latest episode of the DecisionPoint Trading Room with Carl & Erin Swenlin HERE!
Technical Analysis is a windsock, not a crystal ball. --Carl Swenlin
NOTE: The stocks reported herein are from mechanical trading model scans that are based upon moving average relationships, momentum and volume. DecisionPoint analysis is then applied to get selections from the scans. The selections given should prompt readers to do a chart review using their own analysis process. This letter is not a call for a specific action to buy, sell or short any of the stocks provided. There are NO sure things or guaranteed returns on the selection of "diamonds in the rough."
Helpful DecisionPoint Links:
DecisionPoint Shared ChartList and DecisionPoint Chart Gallery
Price Momentum Oscillator (PMO)
Swenlin Trading Oscillators (STO-B and STO-V)
(c) Copyright 2025 DecisionPoint.com