
As a consequence of finding stocks with rising trends, I found some great looking weekly charts that suggests today's "Diamonds in the Rough" could be good intermediate-term investments. I'm still of the mind that we are in a bear market, but the rising trends on these stocks tell me they could weather some of the storm.
Three of today's selections are from Utilities. I hadn't intended that to happen, but given they have done alright during this bear market, there were some rising trends. I was more enamored of Real Estate on Friday but given the selection I had today, I think Utilities may see a resurgence.
The final pick is from Financials. While I'm not exactly confident in this sector, the chart for this particular stock was compelling.
Stay safe out there! It is still likely to be a bumpy road for trading this market. We'll see how today's "Diamonds in the Rough" perform at week's end.
Good Luck & Good Trading,
Erin
Today's "Diamonds in the Rough": DUK, EXC, EZPW and ORA.
Runner-ups: PCG, BXMT, WRB, ACI, PNW and BGS.

Diamond Mine Trading Room:
RECORDING & DOWNLOAD LINK (4/17/2025):
Topic: DecisionPoint Diamond Mine (4/17/2025) LIVE Trading Room
Recording & Download LINK
Passcode: April#17
REGISTRATION for 4/25/2025:
When: April 25, 2025 09:00 AM Pacific Time (US and Canada)
Topic: DecisionPoint Diamond Mine LIVE Trading Room
Register in advance for this webinar HERE
After registering, you will receive a confirmation email containing information about joining the webinar.

Below is the latest free DecisionPoint Trading Room recording from 4/21. You'll find these recordings posted on Mondays to our DP YouTube Channel. Be sure and subscribe HERE.
Welcome to DecisionPoint Diamonds, wherein I highlight ten "Diamonds in the Rough" per week. These are selected from the results of my DecisionPoint Scans which search for stocks that could benefit from the trend and condition of the market. Remember, these are not recommendations to buy or sell, but are the most interesting of the stocks that surfaced in my scans. My objective is to save you the work of the initial, tedious culling process, but you need to apply your own analysis to see if these stocks pique your interest as well. There are no guaranteed winners here!
"Predefined Scans Triggered" are taken from StockCharts.com using the "Symbol Summary" option instead of a "SharpChart" on the workbench.
Stop levels are all rounded down.
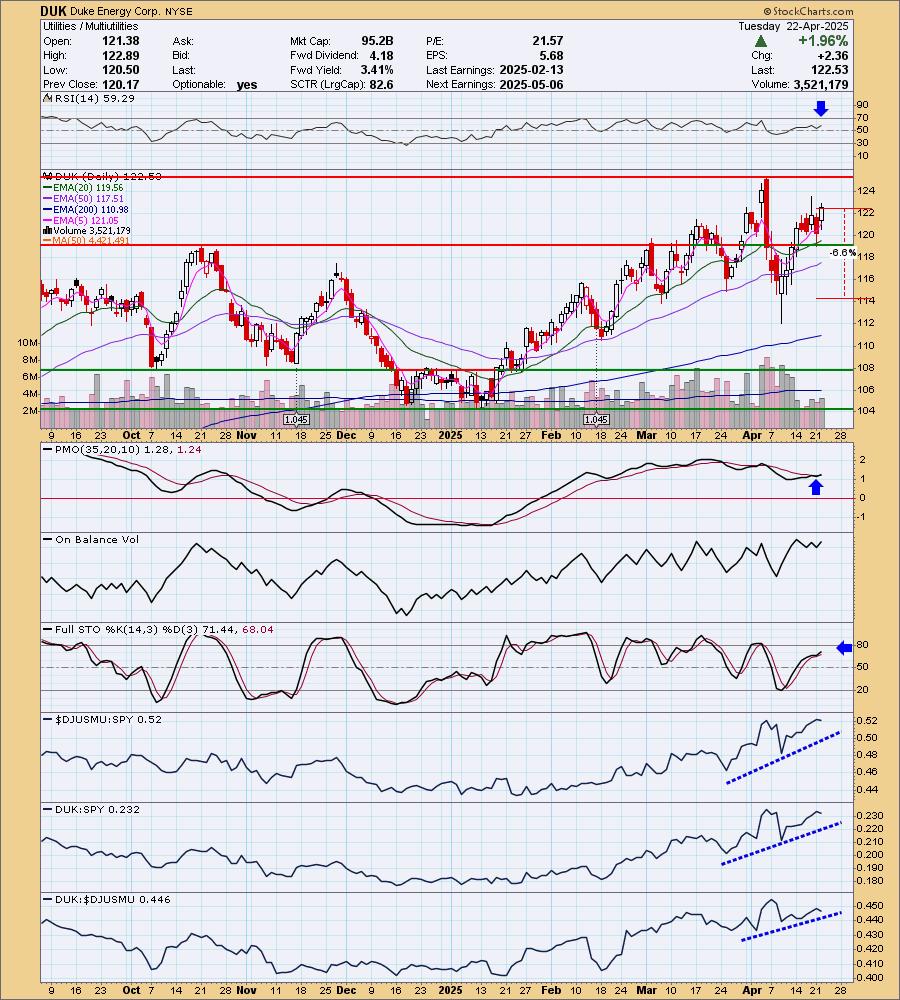
Duke Energy Corp. (DUK)
EARNINGS: 2025-05-06 (BMO)
Duke Energy Corp. engages in the distribution of natural gas and energy-related services. It operates through the following segments: Electric Utilities and Infrastructure, Gas Utilities and Infrastructure, and Other. The Electric Utilities and Infrastructure segment conducts operations in regulated electric utilities in the Carolinas, Florida and the Midwest. The Gas Utilities and Infrastructure segment focuses on Piedmont, natural gas local distribution companies in Ohio and Kentucky, and natural gas storage and midstream pipeline investments. The Other segment includes interest expense on holding company debt, unallocated corporate costs, and Bison which is a wholly owned captive insurance company. The company was founded on April 30, 1904 and is headquartered in Charlotte, NC.
Predefined Scans Triggered: Elder Bar Turned Green.
DUK is up +0.29% in after hours trading. Nice rising trend overall visible on the chart. It's a little close to overhead resistance, but given the positive and not overbought RSI, I think we'll see a breakout. The PMO has given us a Crossover BUY Signal above the zero line. I'd like to see a little more volume, but ultimately the OBV is essentially rising. Stochastics are accelerating higher. Relative strength is excellent for the group and the stock against the SPY. DUK is also outperforming the Multiutilities group. The stop is set beneath the late March low at 6.6% or $114.44.
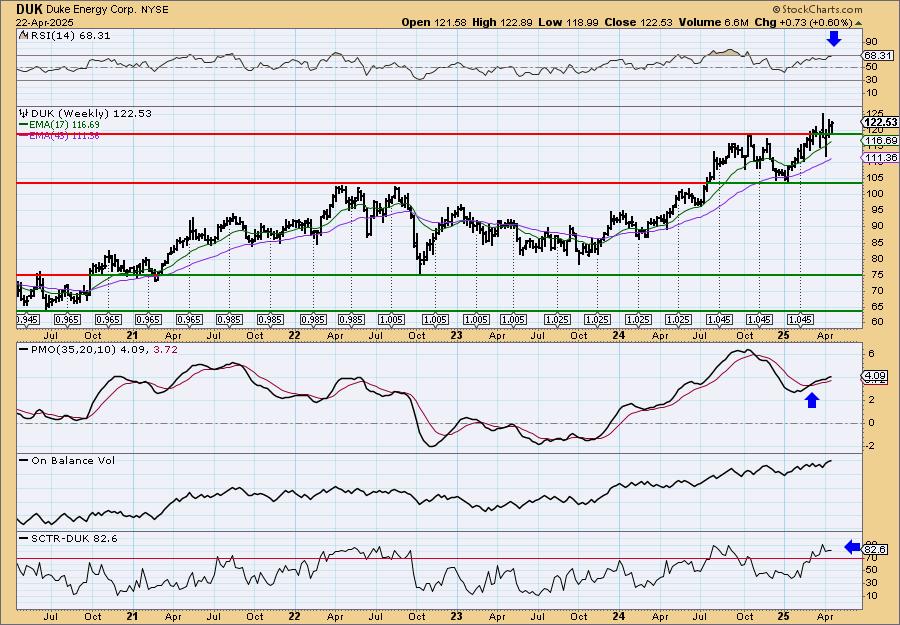
Really nice weekly chart with a breakout out of a trading range. The weekly RSI is positive and not yet overbought. The weekly PMO is rising on a Crossover BUY Signal well above the zero line. The StockCharts Technical Rank (SCTR) is comfortably within the hot zone* above 70. Consider a 17% upside target to about $143.36.
*If a stock is in the "hot zone" above 70, it implies that it is stronger than 70% of its universe (large-, mid-, small-caps and ETFs) primarily in the intermediate to long terms.
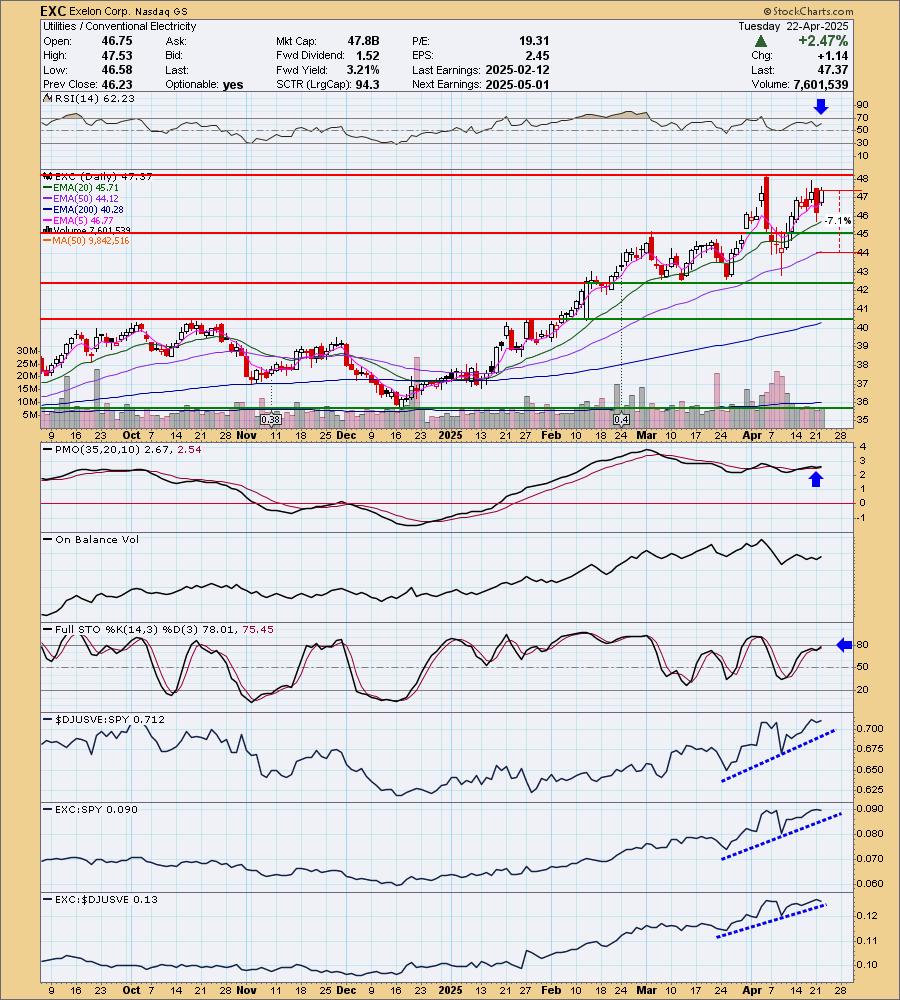
Exelon Corp. (EXC)
EARNINGS: 2025-05-01 (BMO)
Exelon Corp. is a utility services holding company, which engages in the energy distribution and transmission businesses. It operates through the following segments: Commonwealth Edison Company, PECO Energy Company, Baltimore Gas and Electric Company, Potomac Electric Power Company, Delmarva Power and Light Company, and Atlantic City Electric Company. The company was founded on February 4, 1999 and is headquartered in Chicago, IL.
Predefined Scans Triggered: Elder Bar Turned Green.
EXC is up +0.40% in after hours trading. Here is another nice rising trend on a daily chart. They aren't that easy to find right now. We have a positive and not overbought RSI. The PMO is flat above the zero line suggesting pure strength. The PMO also surged (bottomed) above the signal line. Stochastics are nearing 80 and relative strength is looking good across the board. It is close to overhead resistance, but I'm fairly confident we'll get a breakout based on these indicators and its rising trend. The stop is set at the 50-day EMA at 7.1% or $44.00.
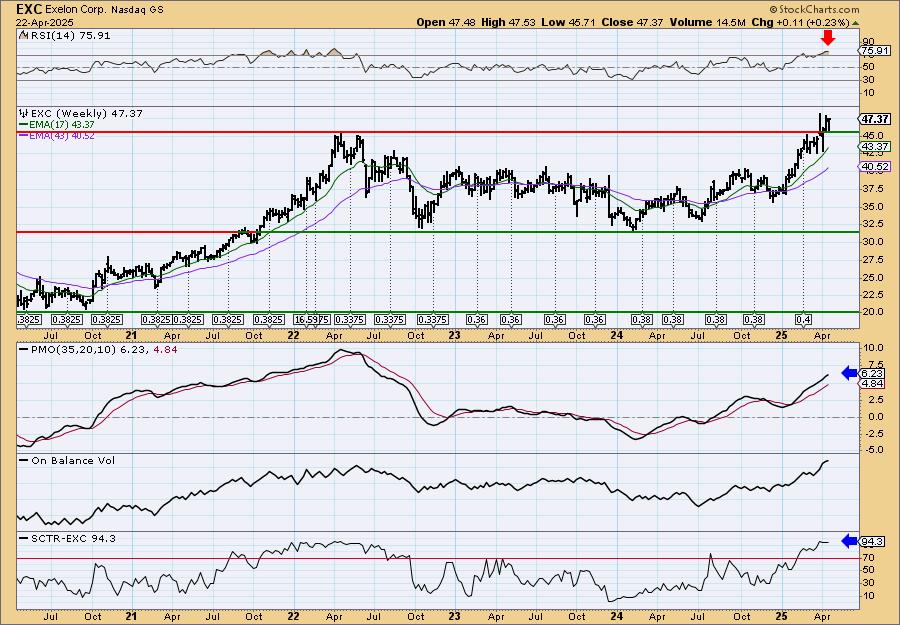
Look at this lovely breakout from the long-term trading range. The weekly RSI is overbought, but look at how it handled that condition back at the end of 2021 and the beginning of 2022. It can hold this condition for some time in a good rally. The weekly PMO is rising nicely well above the zero line on a Crossover BUY Signal. The SCTR is at the top of the hot zone. Consider a 17% upside target to about $55.42.
EZCORP, Inc. (EZPW)
EARNINGS: 2025-05-07 (AMC)
EZCORP, Inc. engages in the provision of pawn services. The firm also sells merchandise, primarily collateral forfeited from pawn lending operations and used merchandise purchased from customers. It operates through the following segments: U.S. Pawn, Latin America Pawn, and Other Investments. The U.S. Pawn segment includes EZPAWN, Value Pawn and Jewelry, and other branded pawn operations. The Latin America Pawn segment consists of Empeño Fácil, Cash Apoyo Efectivo, and other branded pawn operations in Mexico, as well as GuatePrenda and MaxiEfectivo pawn operations in Guatemala, El Salvador, and Honduras. The company was founded in 1989 and is headquartered in Rollingwood, TX.
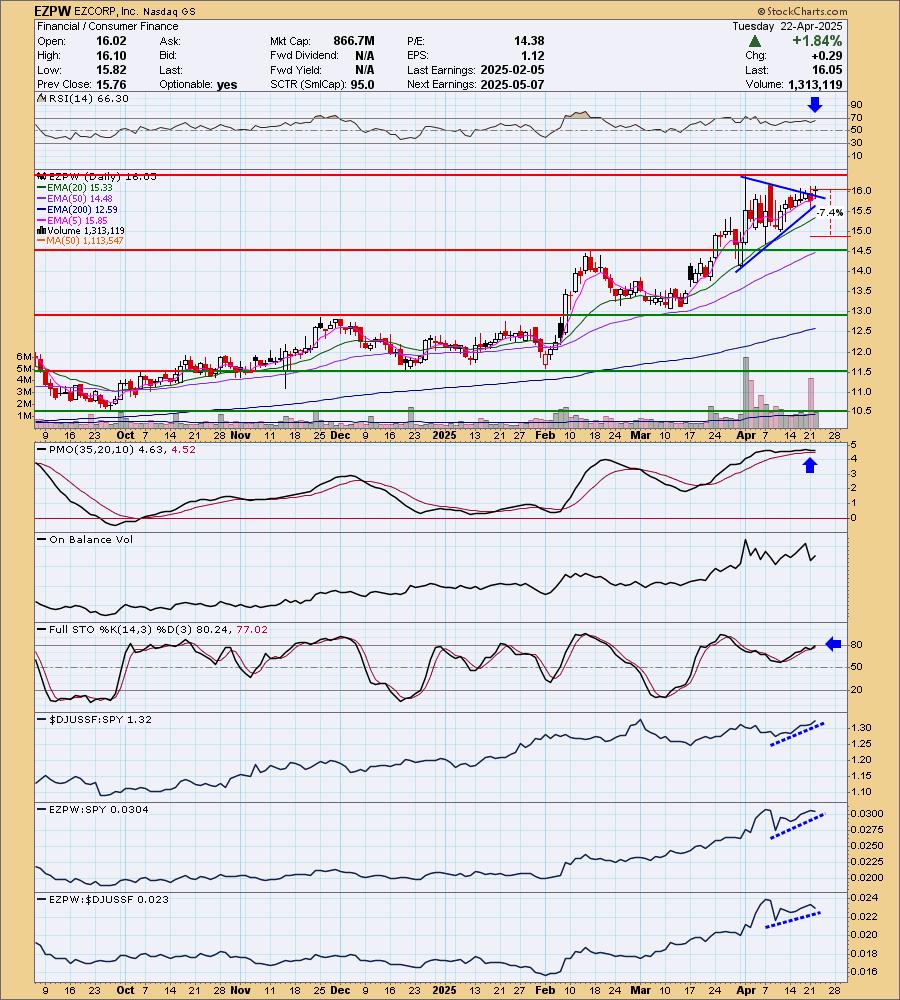
Predefined Scans Triggered: Elder Bar Turned Green, P&F Ascending Triple Top Breakout and P&F Double Top Breakout.
EZPW is down -0.31% in after hours trading. Here we have another strong rising trend. We also have a symmetrical triangle with an upside breakout. The RSI is positive and not overbought. The PMO is flat above the signal line signifying pure strength. The PMO has also surged above the signal line. Stochastics are now above 80. The group is showing good relative strength and EZPW is outperforming both the group and the SPY. The stop is set between the 20/50-day EMAs at 7.4% or $14.86.
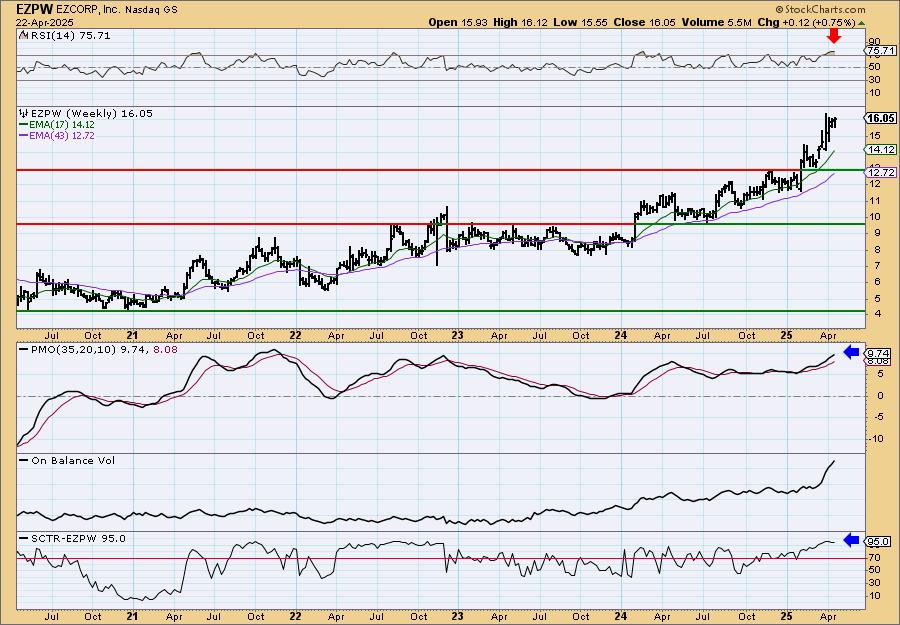
The rising trend is very strong on the weekly chart. It does look a bit parabolic so we have to be ready for a possible snapback especially given the weekly RSI is currently overbought. But overall I really like this rising trend. The weekly PMO is at a very high 9.74 reading and is rising further. The SCTR is at the top of the hot zone. We should see follow-through. Consider a 17% upside target to about $18.78.
Ormat Technologies Inc. (ORA)
EARNINGS: 2025-05-07 (AMC)
Ormat Technologies, Inc. operates as a holding company. The firm engages in the geothermal and recovered energy power businesses. It operates through the following segments: Electricity, Product and Energy Storage. The Electricity segment focuses on the sale of electricity from the company's power plants pursuant to power purchase agreements. The Product segment involves the manufacture, including design and development, of turbines and power units for the supply of electrical energy and in the associated construction of power plants utilizing the power units manufactured by the company to supply energy from geothermal fields and other alternative energy sources. The Energy Storage segment consists of battery energy storage systems as a service and management of curtailable customer loads under contracts with U.S. retail energy providers and directly with large commercial and industrial customers. The company was founded in 1965 and is headquartered in Reno, NV.
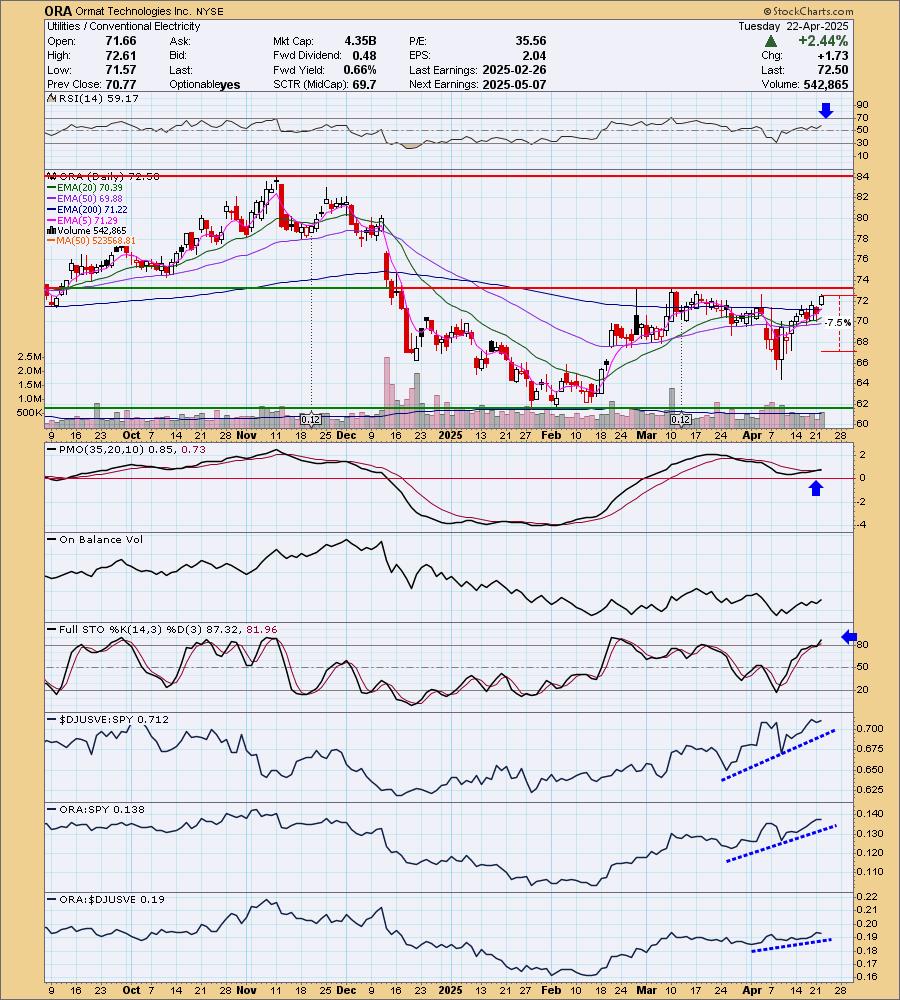
Predefined Scans Triggered: New CCI Buy Signals, P&F Double Top Breakout and P&F Bearish Signal Reversal.
ORA is up +0.61% in after hours trading. My one problem with this chart is that price is still under overhead resistance. But I liked today's gap up move above the 200-day EMA. I would say it is in a rising trend out of the February low but we do need to see a top above a top. You could almost say this is a cup with handle pattern. I like that the RSI is not overbought even after this rally out of the April low. The PMO has given us a Crossover BUY Signal above the zero line. Stochastics are rising above 80. Relative strength is improving for the group and ORA is outperforming both the group and the SPY. The stop is arbitrarily set at 7.5% or $67.06.
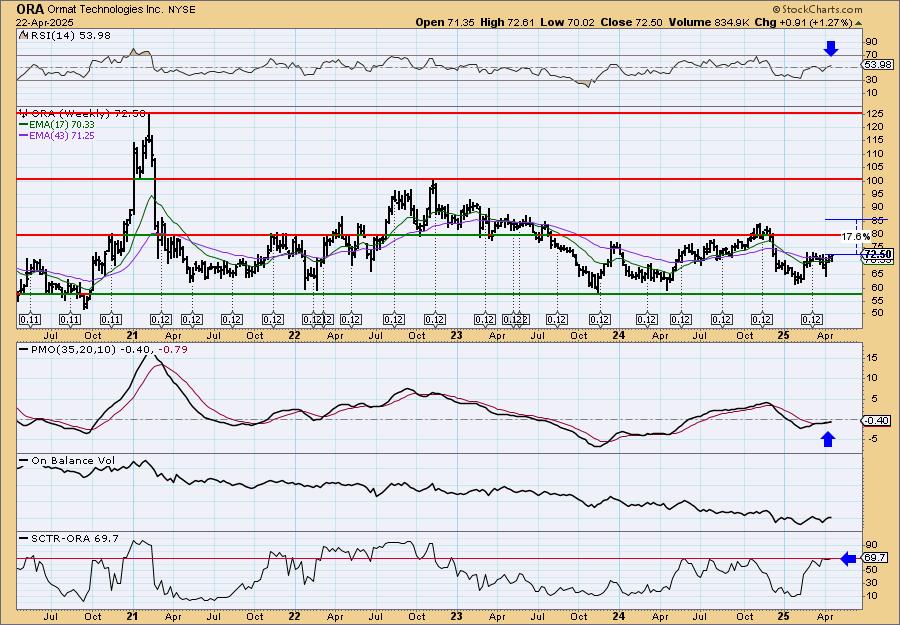
It is still in a trading range on the weekly chart, but does appear ready to test the top of the range. I like the newly positive weekly RSI and the relatively new weekly PMO Crossover BUY Signal. The SCTR is just slightly under the hot zone which works, but I'd like it to overcome it as it hasn't been able to do that while in this trading range. I think there is a good chance that it'll challenge the 2024 high.
Don't forget, on Thursdays I look at reader-requested symbols, click HERE to send me an email. I read every email I receive and try to answer them all!
Current Market Outlook:
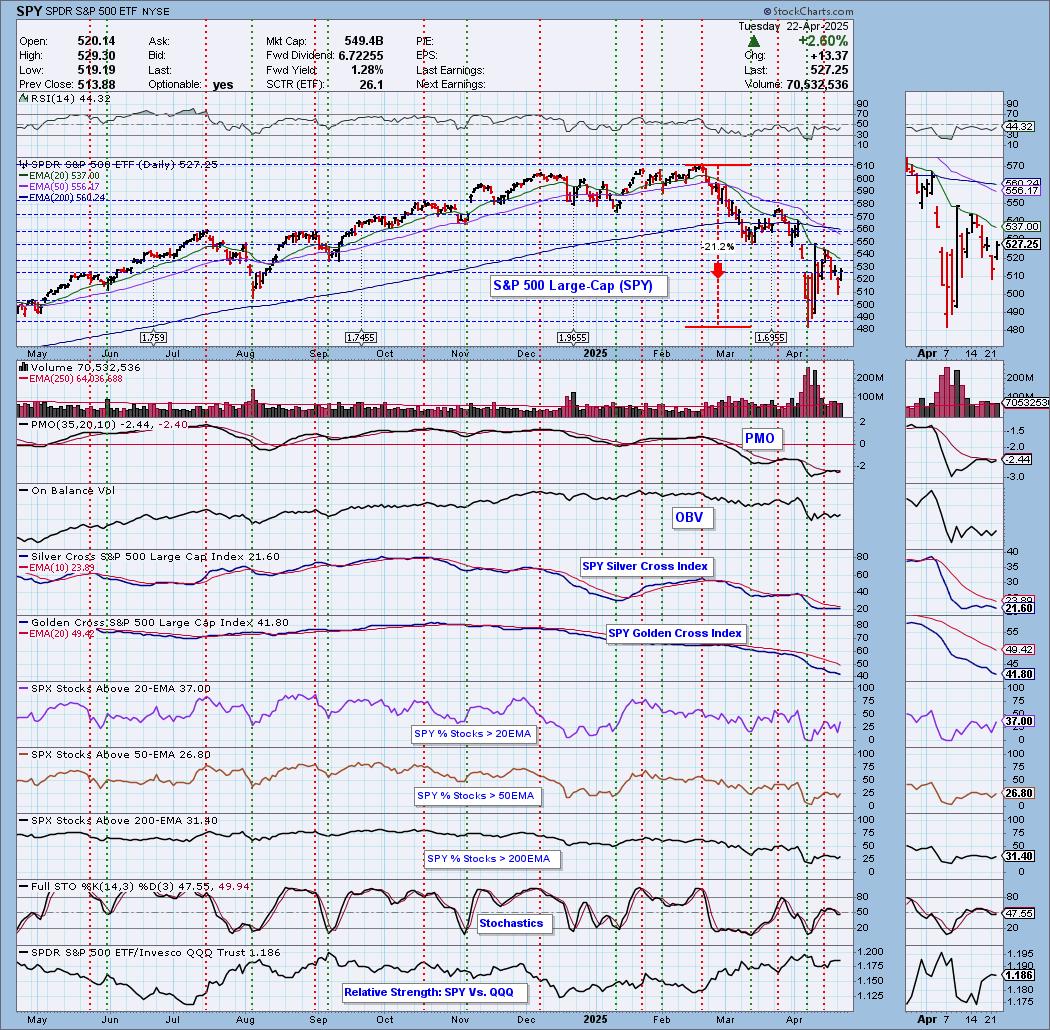
Market Environment: It is important to consider the odds for success by assessing the market tides. The following chart uses different methodologies for objectively showing the depth and trend of participation for intermediate- and long-term time frames.
- The Silver Cross Index (SCI) shows the percentage of SPX stocks on IT Trend Model BUY signals (20-EMA > 50-EMA)
- The Golden Cross Index (GCI) shows the percentage of SPX stocks on LT Trend Model BUY signals (50-EMA > 200-EMA)
Don't forget that as a "Diamonds" member, you have access to our "Under the Hood" curated ChartList on DecisionPoint.com. You'll find it under "Members Only" links on the left side on the Blogs and Links Page.
Here is the current chart:
Full Disclosure: I am 10% long, 0% short.
I'm required to disclose if I currently own a stock I mention and/or may buy/short it within the next 72 hours.
"Technical Analysis is a windsock, not a crystal ball." - Carl Swenlin
(c) Copyright 2025 DecisionPoint.com
Watch the latest episode of DecisionPoint Trading Room with Carl Swenlin & Erin Swenlin Mondays on the DecisionPoint YouTube channel here!
NOTE: The stocks reported herein are from mechanical trading model scans that are based upon moving average relationships, momentum and volume. DecisionPoint analysis is then applied to get five selections from the scans. The selections given should prompt readers to do a chart review using their own analysis process. This letter is not a call for a specific action to buy, sell or short any of the stocks provided. There are NO sure things or guaranteed returns on the daily selection of "Diamonds in the Rough."
Regarding BUY/SELL Signals: The signal status reported herein is based upon mechanical trading model signals and crossovers. They define the implied bias of the price index/stock based upon moving average relationships and momentum, but they do not necessarily call for a specific action. They are information flags that should prompt chart review. Further, they do not call for continuous buying or selling during the life of the signal. For example, a BUY signal will probably (but not necessarily) return the best results if action is taken soon after the signal is generated. Additional opportunities for buying may be found as price zigzags higher, but the trader must look for optimum entry points. Conversely, exit points to preserve gains (or minimize losses) may be evident before the model mechanically closes the signal.
Helpful DecisionPoint Links:
Price Momentum Oscillator (PMO)
Swenlin Trading Oscillators (STO-B and STO-V)
For more links, go to DecisionPoint.com