
I was a bit discouraged by the returns of four of my regular scans. There weren't many choices. However, I ran my "Bullish EMAs - Mid-Range SCTR" Scan (I need to come up with a better name) and had enough results that I had to add a few additional lines of code to pare down the amount of results (185) to something more manageable (83).
I am laughing right now because as I went to add the five diamonds to this report, I had Lowes (LOW) on the list for today. Then, I realized that I had presented Lowes (LOW) last week so I had to find a replacement! I chose Freeport-McMoRan Inc (FCX). I suppose it does reveal how much I rely on the charts themselves and not the name.
Here are some themes that I saw from my various scans. First, Gold and Gold Miners are showing momentum underneath the surface that had them coming up on my "Momentum Sleepers" scan. I didn't include any, but thought you might be interested. Another interesting phenomenon was I saw quite a few car parts and car retailers. I chose Penske Auto Group (PAG). Remember that Autonation (AN) was one of last week's big winners and it continues to look great.
Today's "Diamonds in the Rough" and Reader Requests: COWN, FCX, MAXR, PAG, and SPCE.
 Diamond Mine Information:
Recording from 10/9/2020 is at this link. Access Passcode: .6O2G.E!
Register in advance for the next "DecisionPoint Diamond Mine" trading room on Friday (10/16/2020) 12:00p ET:
Here is the registration link for Friday, 10/16/2020. Password: outlook
Please do not share these links! They are for Diamonds subscribers ONLY!

It's Free!
***Click here to register for this recurring free DecisionPoint Trading Room on Mondays at Noon ET!***
Did you miss the 10/19 trading room? Here is a link to the recording (access code: Au6B.X*1). For best results, copy and paste the access code to avoid typos.
Welcome to DecisionPoint Daily Diamonds, wherein I highlight five "diamonds in the rough." These are selected from the results of my DecisionPoint scans, which search for stocks that could benefit from the trend and condition of the market. Remember, these are not recommendations to buy or sell, but are the most interesting of the stocks that surfaced in my scans. My objective is to save you the work of the initial, tedious culling process, but you need to apply your own analysis to see if these stocks pique your interest as well. There are no guaranteed winners here!
Cowen, Inc. (COWN)
EARNINGS: 10/27/2020 (BMO)
Cowen, Inc. is a financial services company, which provides alternative investment management, investment banking, research, and sales, and trading services. It operates through following the segments: Operating Company and Asset Company. The Operating Company segment consists of four divisions: the Cowen Investment Management division, the Investment Banking division, the Markets division and the Research division. The Asset Company segment consists of the company's private investments, private real estate investments and other legacy investment strategies. The company was founded in 1918 and is headquartered in New York, NY.
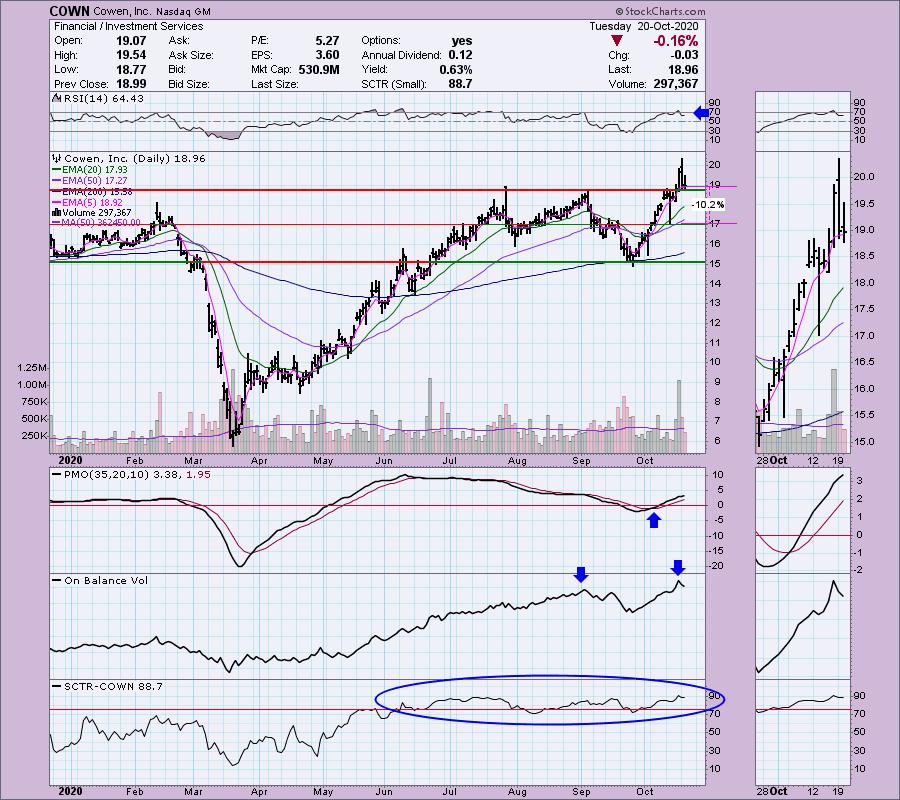
I like this one on the pullback to prior resistance. It has moved the RSI out of overbought territory. The PMO is rising and is not overbought. Notice that when price broke out, so did the OBV to confirm that breakout move. The SCTR looks great.
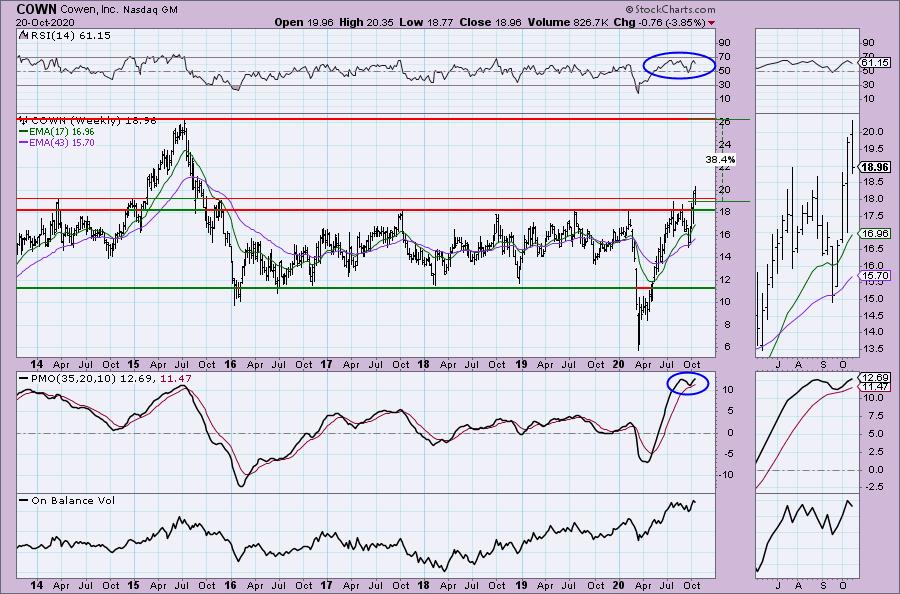
I always like to see the PMO bottom above its signal line. The RSI is positive and not overbought. The breakout from that very long-term trading range is impressive and now it is pulling back to the breakout point.
Freeport-McMoRan, Inc. (FCX)
EARNINGS: 10/22/2020 (BMO)
Freeport-McMoRan, Inc. engages in the mining of copper, gold, and molybdenum. It operates through the following segments: North America Copper Mines; South America Mining; Indonesia Mining; Molybdenum Mines; Rod and Refining; Atlantic Copper Smelting and Refining; and Corporate, Other, and Eliminations. The North America Copper Mines segment operates open-pit copper mines in Morenci, Bagdad, Safford, Sierrita and Miami in Arizona; and Chino and Tyrone in New Mexico. The South America Mining segment includes Cerro Verde in Peru and El Abra in Chile. The Indonesia Mining segment handles the operations of Grasberg minerals district that produces copper concentrate that contains significant quantities of gold and silver. The Molybdenum Mines segment includes the Henderson underground mine and Climax open-pit mine, both in Colorado. The Rod and Refining segment consists of copper conversion facilities located in North America, and includes a refinery, rod mills, and a specialty copper products facility. The Atlantic Copper Smelting and Refining segment smelts and refines copper concentrate and markets refined copper and precious metals in slimes. The Corporate, Other, and Eliminations segment consists of other mining and eliminations, oil and gas operations, and other corporate and elimination items. The company was founded by James R. Moffett on November 10, 1987 and is headquartered in Phoenix, AZ.
Down -0.34% in after hours trading, I presented FCX in the March 19th Diamond Report. You should check that article out. I didn't like it at the time, but it turns out it was just about ready to reverse (it was at $5.47 which is a 222% gain). You can see that it actually took until the end of March to hit its low. The chart looked terrible at that time. If we use my "diamond in the rough" analysis, this wouldn't have been included until early April when the RSI moved into positive territory after we had a PMO BUY signal.
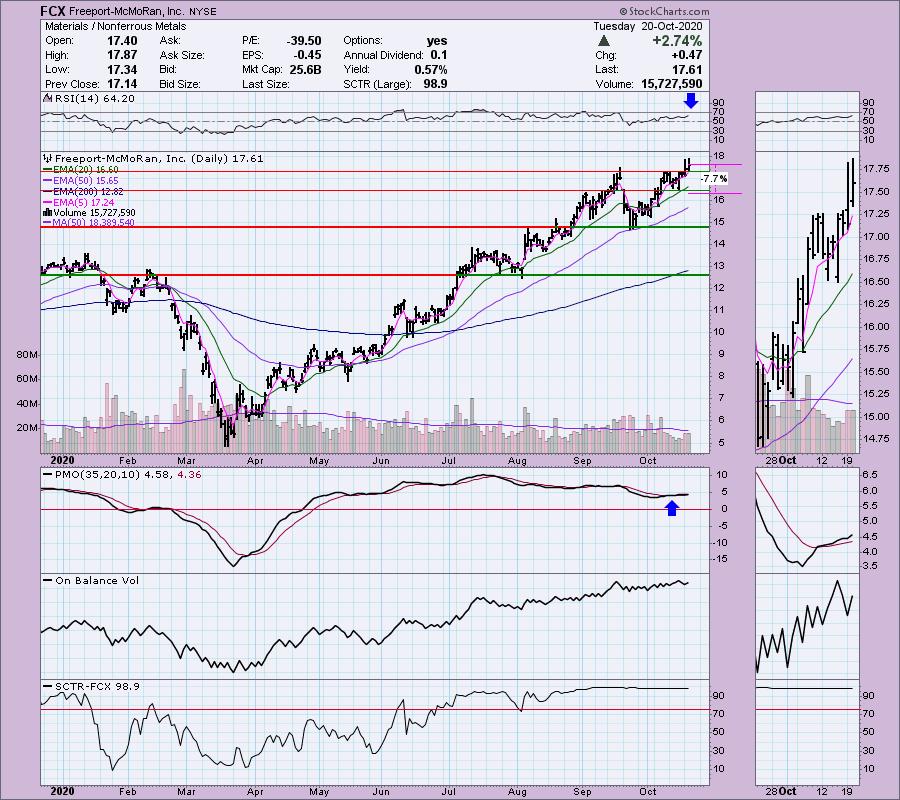
FCX is holding onto support at the previous two tops. The PMO is on a BUY signal and is not overbought. The RSI is positive and not overbought. The OBV is confirming the rising trend. The SCTR is top-notch.
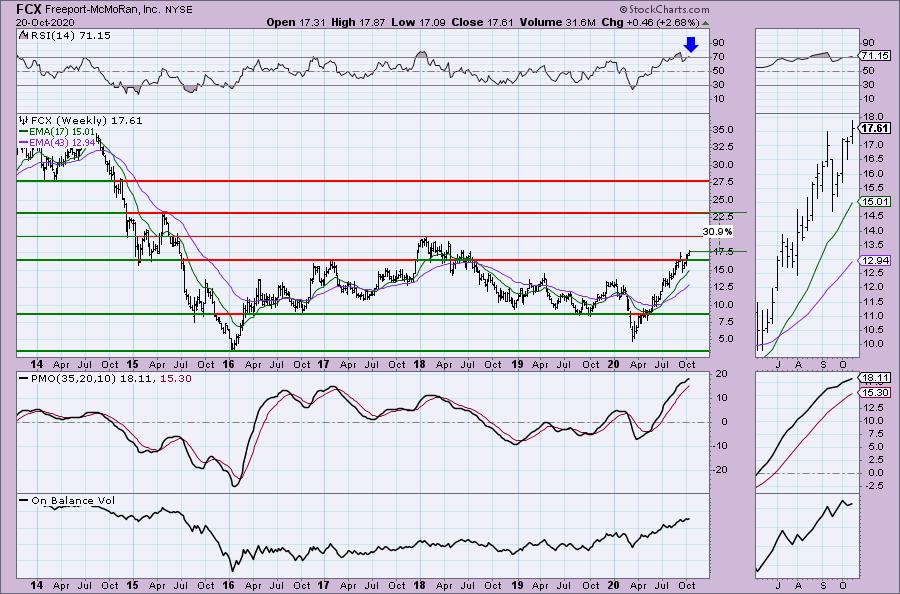
This short-term breakout turns out to be an important one. It broke out of a very long-term trading range. Granted the next level of overhead resistance is close, but would still offer a 12% gain. If it breaks out from there, it could turn into a 30%+ gain. The PMO and RSI are overbought so keep that in mind.
Don't forget, on Thursdays I look at reader-requested symbols, so shoot me an email at erin@decisionpoint.com. I read every email I receive and try to answer them all!
Maxar Technologies Ltd. (MAXR)
EARNINGS: 11/4/2020 (AMC)
Maxar Technologies, Inc. provides space technology solutions, delivering unmatched end-to-end capabilities in satellites, robotics, Earth imagery, geospatial data, analytics and insights. Its segments include Space Systems, Imagery and Services. The company was founded on February 3, 1969 and is headquartered in Westminster, CO.
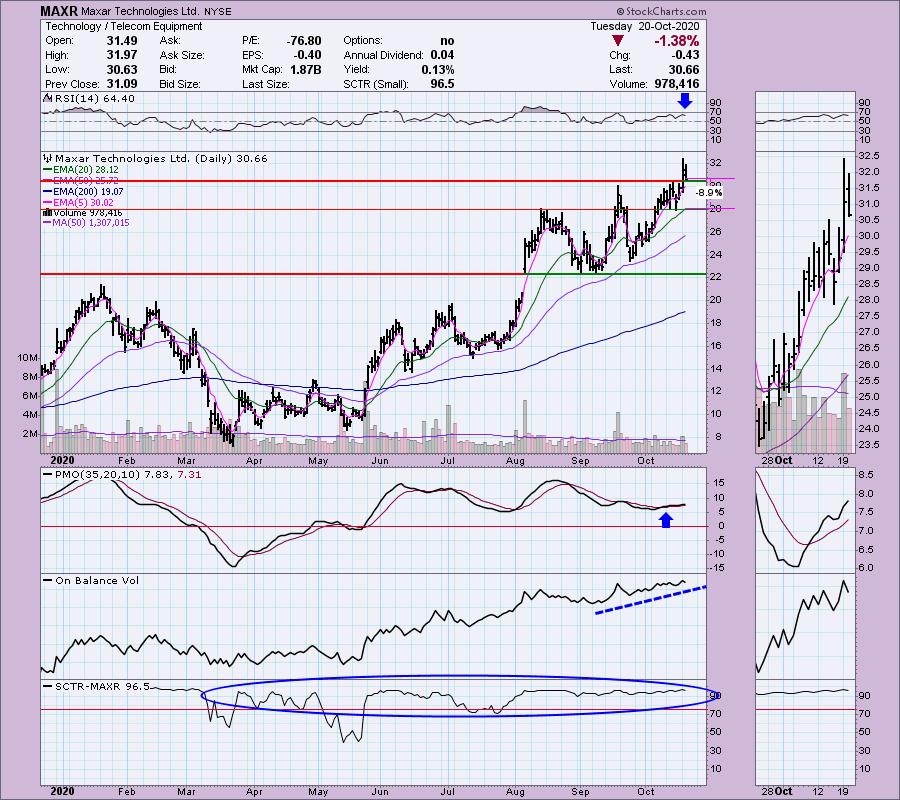
I was absolutely sure that I had previously presented MAXR, but apparently since the beginning of February, it hasn't been a diamond in the rough. I've been watching Telecom Equipment group and was pleased to see this one appear. On the pullback, I very much like MAXR. The PMO bottomed above its signal line and is now rising on an oversold BUY signal. The RSI is firmly within positive territory above net neutral (50). The stop is set around $20.
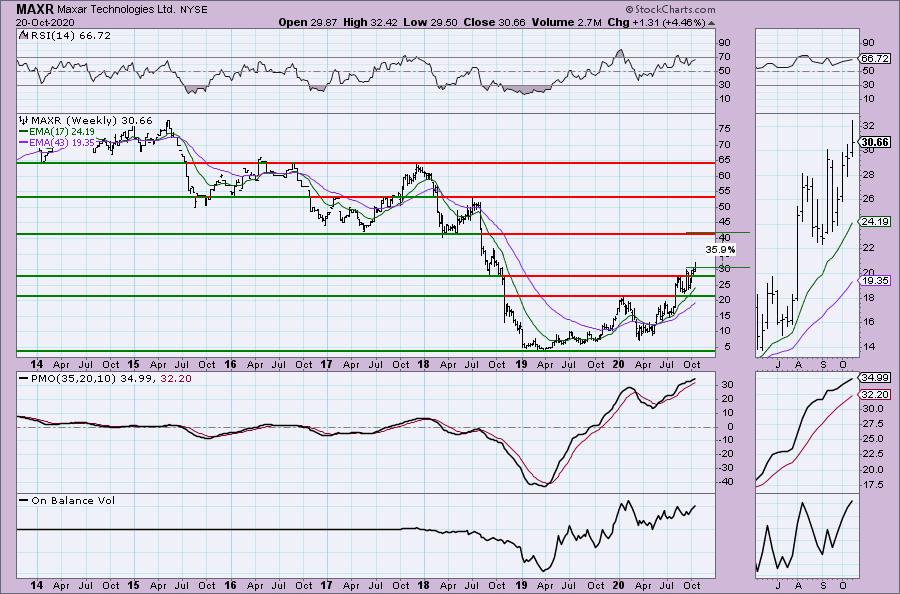
The weekly chart looks great. PMO is rising and the RSI is positive. This is a great breakout and leaves us with upside potential over 35%.
Penske Automotive Group Inc (PAG)
EARNINGS: 10/22/2020 (BMO)
Penske Automotive Group, Inc. operates as an international transportation services company, which engages in the distribution of commercial vehicles, diesel engines, gas engines, power systems and related parts & services. It operates through the following segments: Retail Automotive, Retail Commercial Truck, Non-Automotive Investments and Other. The Retail Automotive segment consists of retail automotive dealership operations. The Retail Commercial Truck segment is the dealership operations of commercial trucks in the U.S. and Canada. The Other segment is comprised of commercial vehicle and power systems distribution operation and other non-automotive consolidated operations. The Non-Automotive Investments segment is the equity method investments in non-automotive operations. The company was founded in October 1992 and is headquartered in Bloomfield Hills, MI.
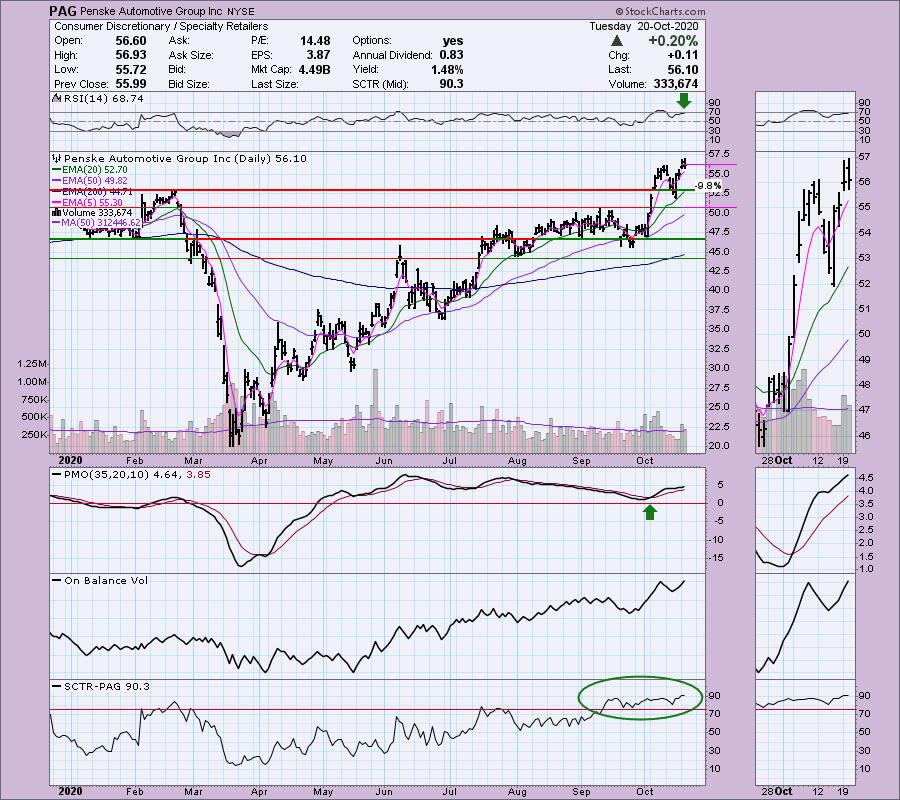
We have a tiny breakout above $56. This could be a reverse island, but the RSI is positive and not really overbought and the PMO is rising nicely after bottoming above its signal line. The SCTR is strong. If it does reverse, you can set a stop at the mid-October low, or wait a bit longer for it to move just under it. The reason being, we would now a double-top formation and you definitely don't want it if that bearish pattern were to execute.
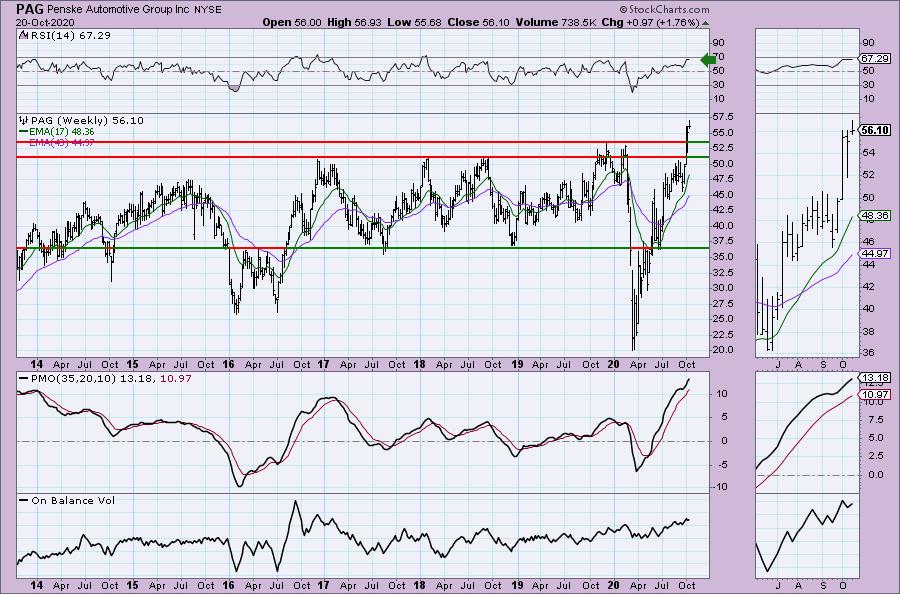
Here's yet another stock breaking out of a very long-term trading range. On the breakout, the PMO is accelerating higher and the RSI remains positive and not overbought.
Virgin Galactic Holdings Inc (SPCE)
EARNINGS: 11/5/2020 (AMC)
Virgin Galactic Holdings, Inc. engages in the manufacture of advanced air and space vehicles, and provision of spaceflight services for private individuals and researchers. It designs spaceships which can fly anyone to space safely without the need for expertise or exhaustive time consuming training. The company was founded on May 5, 2017 and is headquartered in Las Cruces, NM.
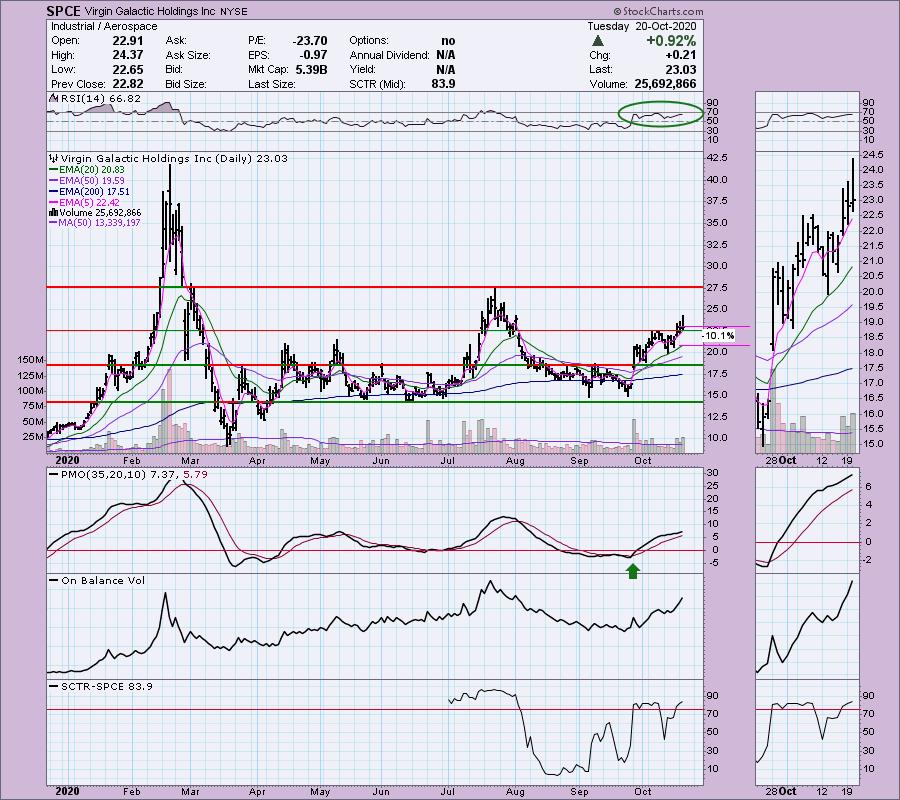
Up +0.95% in after hours trading, SPCE will be a topic of conversation as they approach their October 22nd launch, the first of two before they send up their founder Sir Richard Branson. I suspect they will see an influx of cash and interest. The best part is that the chart looks great. PMO is rising after an oversold BUY signal. It is now in positive territory. The RSI is positive and not overbought. I would set my stop at the 20-EMA or even 50-EMA. If it drops below those April and May tops, I wouldn't want it.
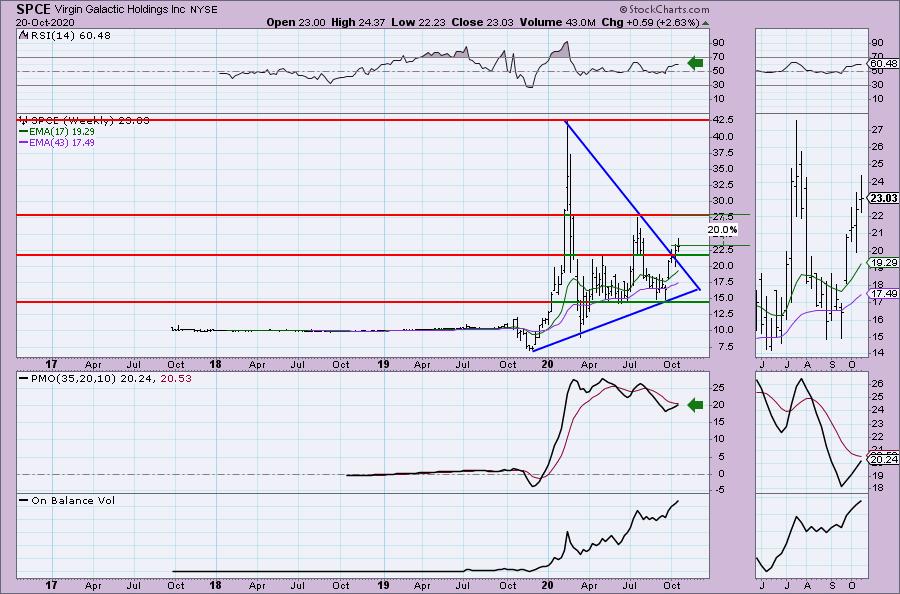
It's a strange weekly chart for sure. Main points are the positive RSI and PMO nearing a BUY signal. There is a reverse divergence as higher volume has not pushed price back up to the prior two 2020 tops. I think a 20% gain to that July top is completely reasonable and that would be a 20% gain.
Full Disclosure: I won't be adding to my positions for now. Sure wishing I had added SFIX last week! I had more stops trigger so I'm about 45% invested and 55% is in 'cash', meaning in money markets and readily available to trade with.
Current Market Outlook:
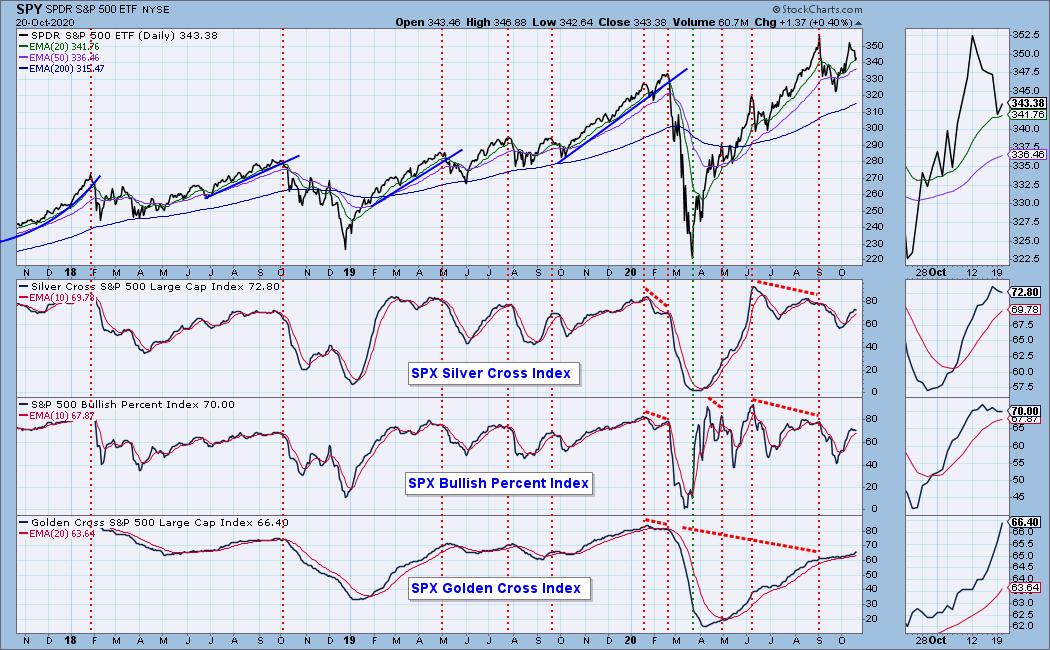
Market Environment: It is important to consider the odds for success by assessing the market tides. The following chart uses different methodologies for objectively showing the depth and trend of participation for intermediate- and long-term time frames.
- The Silver Cross Index (SCI) shows the percentage of SPX stocks on IT Trend Model BUY signals (20-EMA > 50-EMA)
- The Golden Cross Index (GCI) shows the percentage of SPX stocks on LT Trend Model BUY signals (50-EMA > 200-EMA)
- The Bullish Percent Index (BPI) shows the percentage of SPX stocks on Point & Figure BUY signals.
Don't forget that as a "Diamonds" member, you have access to our GCI/SCI curated ChartList on DecisionPoint.com. You'll find it under "Members Only" links on the left side on the Blogs and Links Page.
Here is the current chart:
Diamond Index 10/13:
- Diamond Scan Results: 1
- Diamond Dog Scan Results: 67
- Diamond Bull/Bear Ratio: 0.01
Technical Analysis is a windsock, not a crystal ball.
Happy Charting!
- Erin
erin@decisionpoint.com
Watch the latest episode of DecisionPoint with Carl & Erin Swenlin on Mondays 7:00p EST or on the DecisionPoint playlist on the StockCharts TV YouTube channel here!
NOTE: The stocks reported herein are from mechanical trading model scans that are based upon moving average relationships, momentum and volume. DecisionPoint analysis is then applied to get five selections from the scans. The selections given should prompt readers to do a chart review using their own analysis process. This letter is not a call for a specific action to buy, sell or short any of the stocks provided. There are NO sure things or guaranteed returns on the daily selection of "diamonds in the rough."
Helpful DecisionPoint Links:
DecisionPoint Shared ChartList and DecisionPoint Chart Gallery
Price Momentum Oscillator (PMO)
Swenlin Trading Oscillators (STO-B and STO-V)
For more links, go to DecisionPoint.com!