
I'm going to present six "diamonds in the rough" today. I had quite a few selections from my various scans including two "bottom fish". I consider bottom fish to be stocks that are very beatdown but are showing positive signs of life. It is an opportunity to get in early. However, the risk is higher as the EMAs are typically configured quite negatively. For example, bottoms fish have their 50-EMA below the 200-EMA. This tells us that there is a bearish bias and we shouldn't necessarily expect bullish results. These stocks usually do turn it around so when we bottom fish, we are looking for the reversal that will take it out of the "bottom fish" category. If you are risk averse or the stock is priced very low, just remember to position size accordingly.
Today's "Diamonds in the Rough" are: AFYA, BEP, FR, PG, PSTI and TRIL.
** HOLIDAY SCHEDULE 12/28 - 1/1 **
Diamonds:
Monday & Tuesday --Eleven Diamonds in the Rough (no reader requests).
Wednesday: Diamonds Recap & LIVE Diamond Mine Trading Room at 9:00a PT
DecisionPoint Alert:
Publishing Monday - Wednesday
Weekly Wrap - Thursdays
** No reports will be sent 1/1 **
 Diamond Mine Information:
Here is today's (12/23/2020) recording link. Access Passcode: 89JUgya&
Register in advance for the next "DecisionPoint Diamond Mine" trading room on Wednesday (12/30/2020) 12:00p ET:
Here is the registration link for WEDNESDAY, 12/30/2020. Registration & Entry Password: new-year
Please do not share these links! They are for Diamonds subscribers ONLY!
Save the registration confirmation email with login instructions in case Zoom doesn't notify you in time.

It's Free!
***Click here to register for this recurring free DecisionPoint Trading Room on Mondays at Noon ET!***
Did you miss the 12/28 free trading room? Here is a link to the recording. Access Code: #=5dJp=G
For best results, copy and paste the access code to avoid typos.
Welcome to DecisionPoint Daily Diamonds, wherein I highlight five "diamonds in the rough." These are selected from the results of my DecisionPoint scans, which search for stocks that could benefit from the trend and condition of the market. Remember, these are not recommendations to buy or sell, but are the most interesting of the stocks that surfaced in my scans. My objective is to save you the work of the initial, tedious culling process, but you need to apply your own analysis to see if these stocks pique your interest as well. There are no guaranteed winners here!
Afya Ltd. (AFYA)
EARNINGS: 3/25/2021 (AMC)
Afya Ltd. is a medical education group in Brazil. It delivers an end-to-end physician-centric ecosystem that serves and empowers students to be lifelong medical learners through their medical residency preparation, post-graduate programs and continuing medical education activities. The company operates through the following two segments: Education Services and Residency Preparatory & Specialization Programs. The Education Services segment provides educational services through undergraduate and graduate courses related to medicine, other health sciences and other undergraduate programs. The Residency Preparatory & Specialization Programs segment provides residency preparatory courses and medical post-graduate specialization programs, delivering printed and digital content, an online medical education platform and practical medical training. Afya was founded on March 22, 2019 and is headquartered in Nova Lima, Brazil.
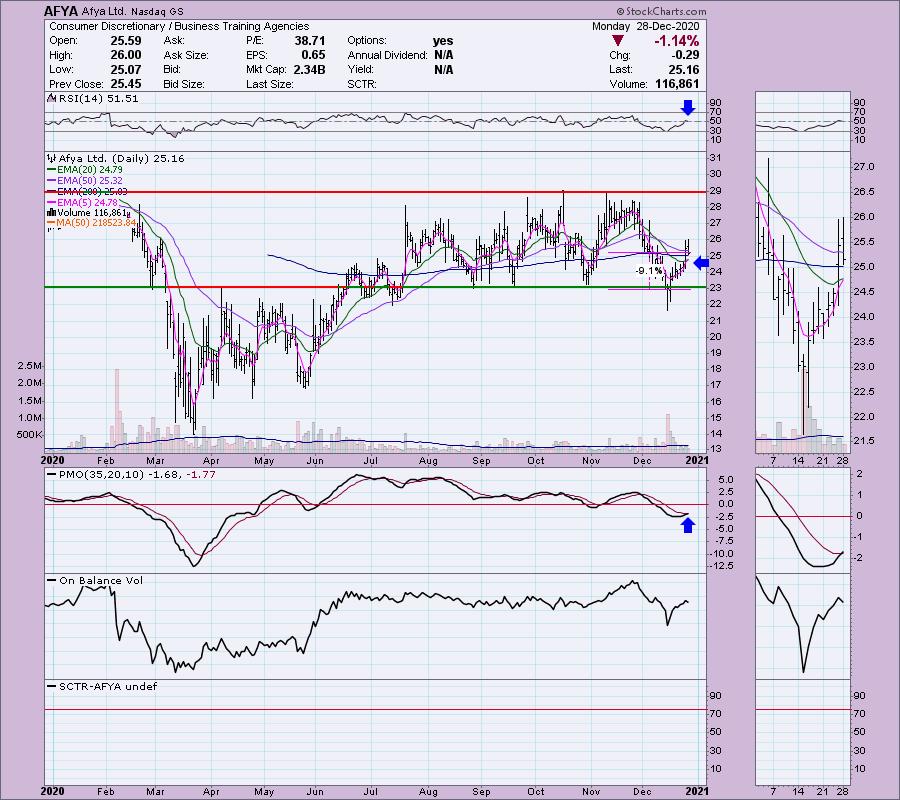
You'll note that AFYA has been in a longer-term trading range. It is currently sitting just below the center. This is the type of set-up I like to see with the RSI just now moving into positive territory and the PMO just giving us a positive crossover. If you've been in my trading rooms, you know this is what I look for on a 5-minute candlestick chart-- a PMO crossover BUY signal and an RSI that is just crossing above net neutral (50). Today it pulled back after a strong rally on Thursday. On the pullback, price remained above the 200-EMA. Additionally, the 5-EMA is just about ready to cross above the 20-EMA which gives us a Short-Term Trend Model BUY signal. I think you can make a case for a "V" bottom chart pattern. It has now retraced 1/3 of the pattern on the way up, so that means it has executed. The expectation is a breakout above the left top of the "V".
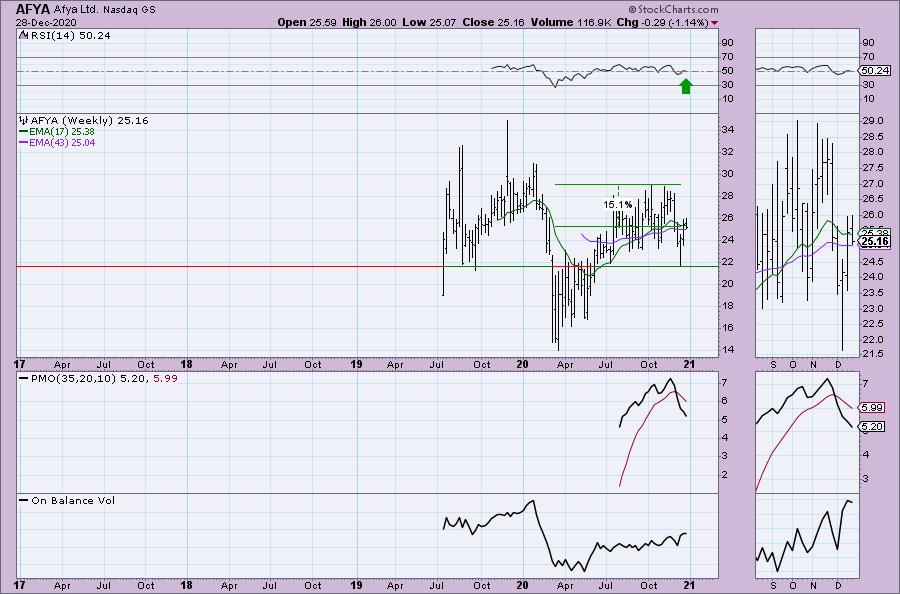
I really wish the weekly chart looked as bullish. The RSI is staying positive, but clearly the PMO is telling us this is a short-term investment.
Brookfield Renewable Partners LP (BEP)
EARNINGS: 2/4/2021 (BMO)
Brookfield Renewable Partners LP engages in owning a portfolio of renewable power generating facilities primarily in North America, Colombia, Brazil, Europe, India, and China.. It operates through following segments: Hydroelectric; Wind; Solar; Storage and Other; and Corporate. The company was founded on June 27, 2011 and is headquartered in Hamilton, Bermuda.
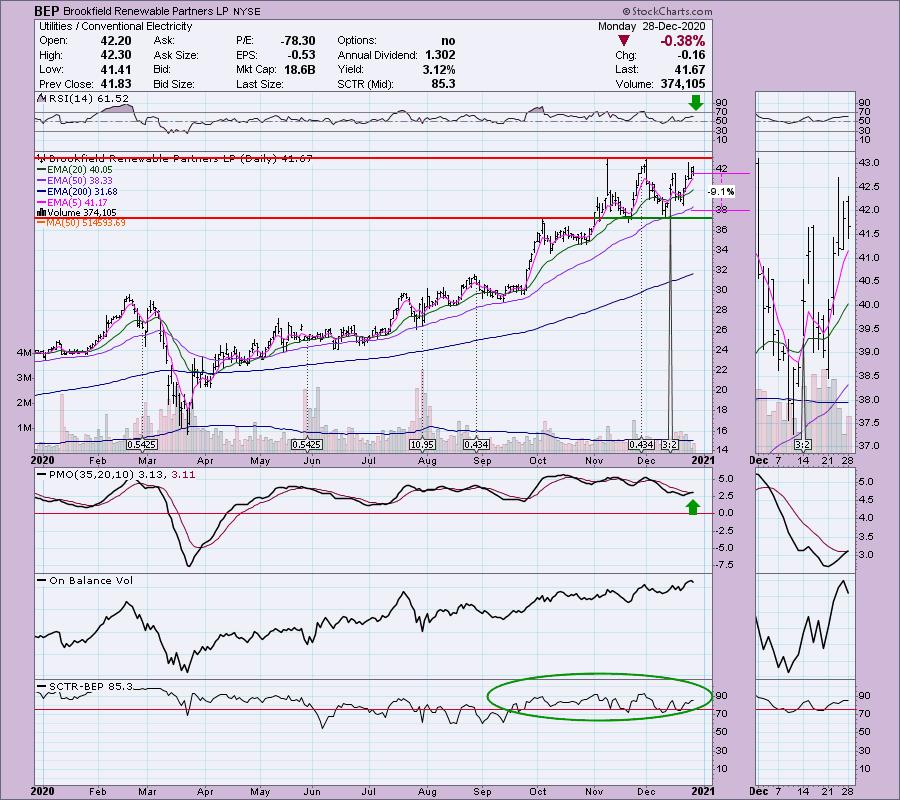
BEP is up +1.27% in after hours trading, so we may be onto something here. This one recently had a 3 for 2 stock split. It did what normally happens after a split, it declined. We are now looking at the rally off that decline. The RSI is positive and not overbought. The PMO just gave us a crossover BUY signal. At issue would be that price was stopped just under overhead resistance when it decided to pause. Price remains over the 5-EMA. I'm expecting the breakout based on the RSI and PMO. It also helps that the SCTR is in the "hot zone" above 75. This means that BEP is in the top quartile of mid-cap stocks. It is a limited partnership (LP) and that can pose tax issues so you may want to investigate that further.
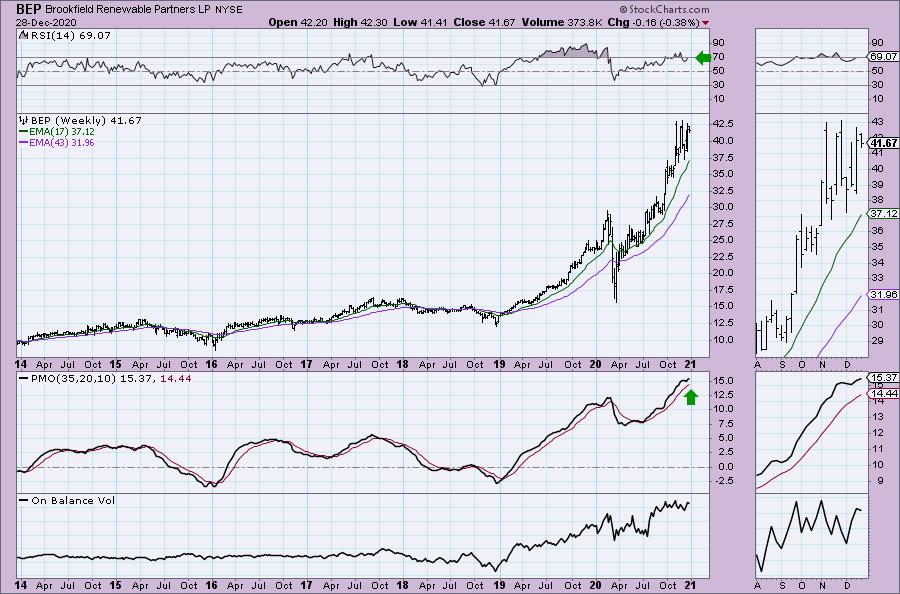
This weekly chart looks good, although the PMO is quite overbought. It has bottomed above its signal line which is usually especially bullish. The RSI is somewhat overbought, but not enough that I would worry just yet in the intermediate term.
First Industrial Realty T (FR)
EARNINGS: 2/10/2021 (AMC)
First Industrial Realty Trust, Inc. operates as a real estate investment trust. It engages in the ownership, management, acquisition, sale, development and redevelopment of industrial real estate. The firm product portfolio includes warehouse and light industrial properties. The company was founded by Johannson L. Yap, Robert L. Denton, Sr., and Jay H. Shidler in 1993 and is headquartered in Chicago, IL.
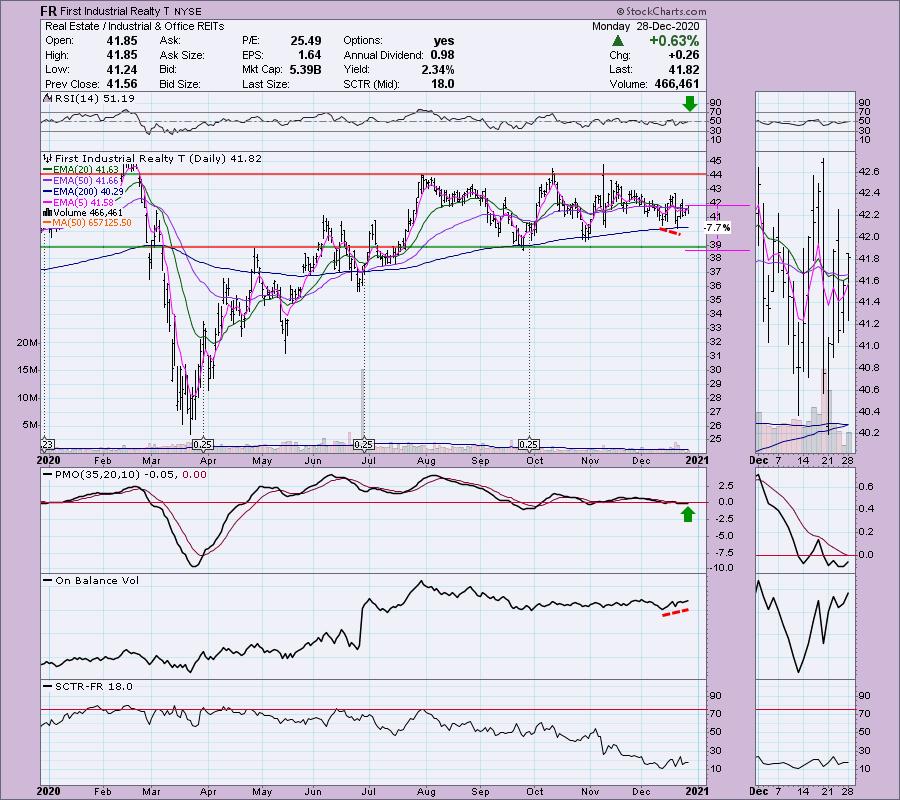
I actually covered FR as a reader request in the February 13th Diamonds Report (down -8.8% since). I did say that I didn't like it. Well, right now I do like it. It has been in a rather boring trading range so we could see more of the same. However, here is an opportunity to see if it is ready to finally break out. The PMO is rising, albeit below the zero line. The RSI is positive, but mostly neutral and flat. I decided to pick this one for two main reasons. First it has bounced off the 200-EMA and there is a positive divergence with OBV bottoms. Price did just close above all of the EMAs. I have a stop set at 7.7%, but if it doesn't hold the 200-EMA, it likely isn't ripe yet.
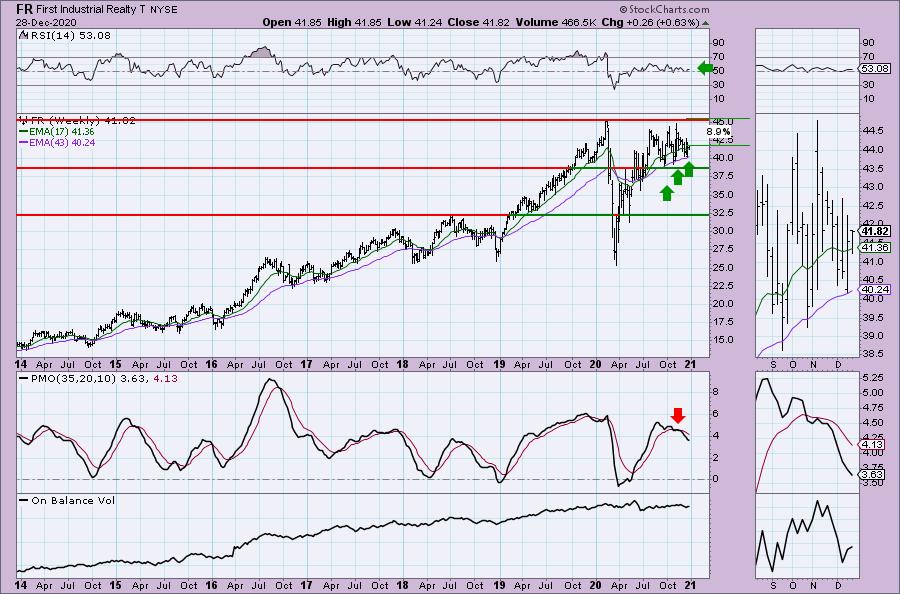
The PMO is negative, but may be decelerating somewhat. The RSI is positive. I have all of those green arrows to show you how price has hugged the 43-week EMA consistently and it is bouncing off it once again.
Don't forget, on Thursdays I look at reader-requested symbols, so shoot me an email at erin@decisionpoint.com. I read every email I receive and try to answer them all!
Procter & Gamble Co. (PG)
EARNINGS: 1/20/2021 (BMO)
Procter & Gamble Co. engages in the provision of branded consumer packaged goods. It operates through the following segments: Beauty; Grooming; Health Care; Fabric & Home Care; and Baby, Feminine & Family Care. The Beauty segment offers hair, skin, and personal care. The Grooming segment comprises of shave care like female and male blades and razors, pre and post shave products, and appliances. The Health Care segment includes oral care products like toothbrushes, toothpaste, and personal health care such as gastrointestinal, rapid diagnostics, respiratory, and vitamins, minerals, and supplements. The Fabric and Home Care segment consist of fabric enhancers, laundry additives and detergents, and air, dish, and surface care. The Baby, Feminine and Family Care segment sells baby wipes, diapers, and pants, adult incontinence, feminine care, paper towels, tissues, and toilet paper. The company was founded by William Procter and James Gamble in 1837 and is headquartered in Cincinnati, OH.
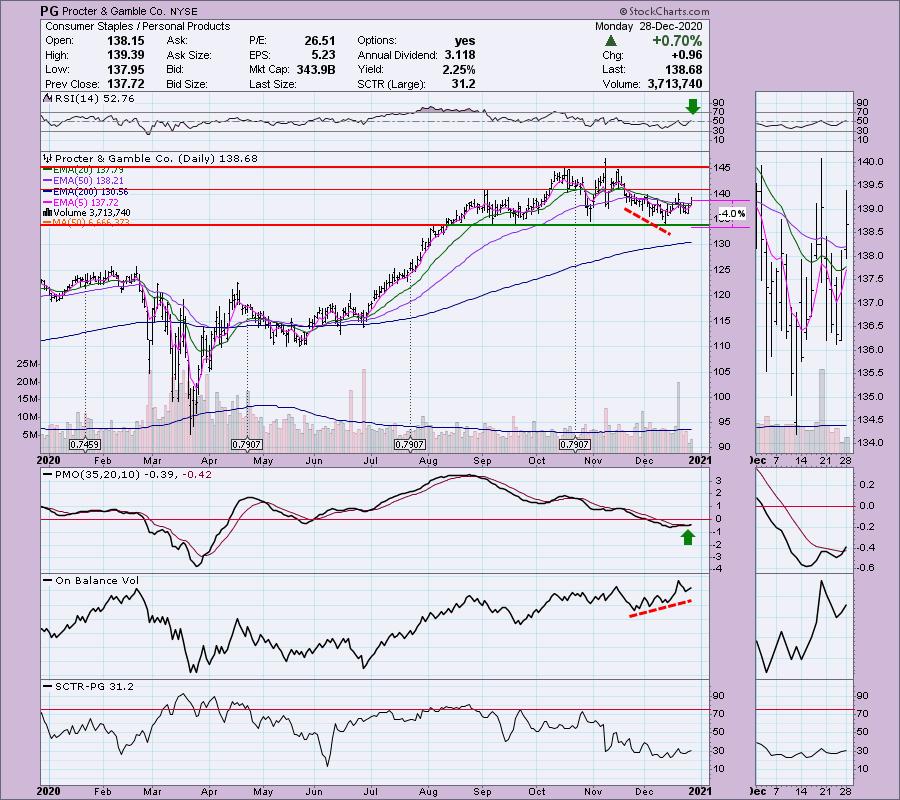
PG is currently up +0.22% in after hours trading. I covered PG back in the April 23rd Diamond Report (up 16.1% since). It's a Consumer Staple and therefore isn't always going to be the most 'sexy' investment, but with the market softening up in preparation for January, this may be an area to 'mine'. Unlike the last time it rallied in mid-December, we have an actual PMO BUY signal along with an RSI that just reached positive territory. Last time the PMO hadn't had the crossover. The 5-EMA is about to cross above the 20-EMA which would give us a Short-Term Trend Model BUY signal. Looking in the thumbnail, I believe you can make a case for a short-term reverse head and shoulders (bullish). Price closed above the 20/50-EMAs. I love that the stop level is very tight and obvious.
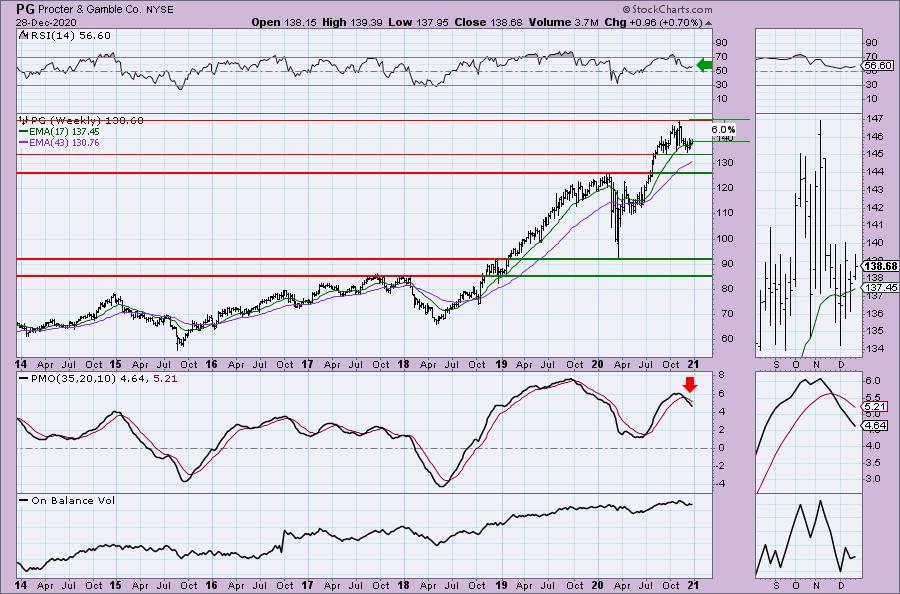
The RSI is positive on the weekly chart, but we are seeing a PMO crossover SELL signal. Price does look like it is topping in the intermediate term, so that 4% tight stop will serve you well.
Pluristem Life Systems Inc. (PSTI)
EARNINGS: 2/4/2021 (AMC)
Pluristem Therapeutics, Inc. is a clinical stage company, which engages in cell therapy development. It develops placenta-based cell therapy product candidates for the treatment of multiple ischemic, inflammatory and hematologic conditions. The firm focuses on the development, clinical trials and manufacturing of cell therapeutics and related technologies. Its products include Clinical Pipeline, PLX-Immune, PLX-PAD, and PLX-R18. The company was founded by Doron Shorrer on May 11, 2001 and is headquartered in Haifa, Israel.
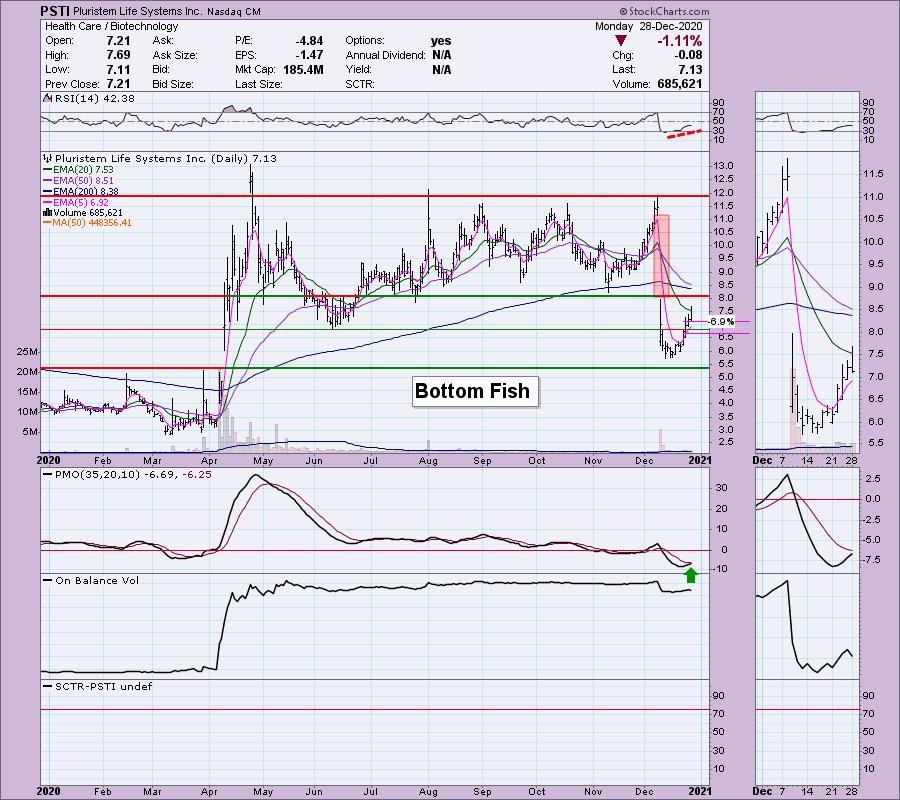
I am identifying this one as a bottom fish. It looks like this could be the move that will reunite price with its prior trading range. The RSI is negative, but it is rising. The PMO is bottoming in very oversold territory and is nearing a crossover BUY signal. I'd be careful given price didn't close above the 20-EMA, but it is holding above the 5-EMA and it managed to penetrate the 20-EMA which is bullish.
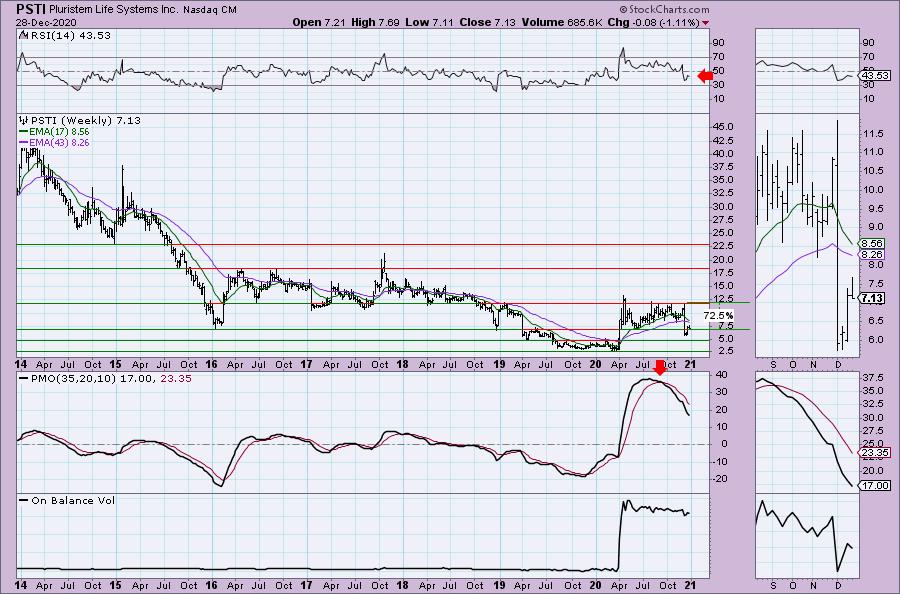
When looked at on the weekly chart, we can see that price overcame resistance at the 2016 and 2018 lows. Neither the PMO nor the RSI are positive, but this is a bottom fish after all.
Trillium Therapeutics Inc. (TRIL)
EARNINGS: 3/10/2021 (BMO)
Trillium Therapeutics Inc. is a clinical stage immuno-oncology company, which engages in the research and development of therapies for the treatment of cancer. Its pipeline is comprised of TTI-621, TTI-622, and TTI-10001 (Sting Agonist). The company was founded on March 31, 2004 and is headquartered in Mississauga, Canada.
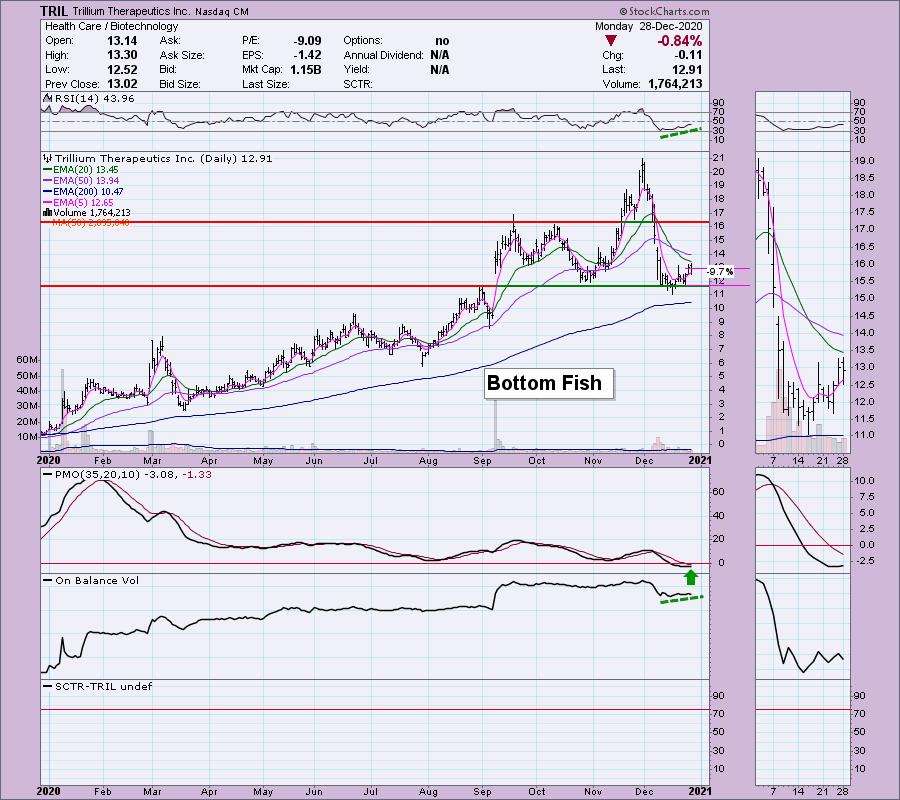
TRIL is down -0.47% in after hours trading, so a better entry could be had. This is another bottom fish. The RSI is improving and the PMO is turning up. I prefer to wait for the PMO to turn up more definitively before getting in. Price is above the 5-EMA but is now coming up to possible resistance at the 20/50-EMAs. A stop is necessary on bottom fish. You could set a 10% stop that would take you close to the second price bottom.
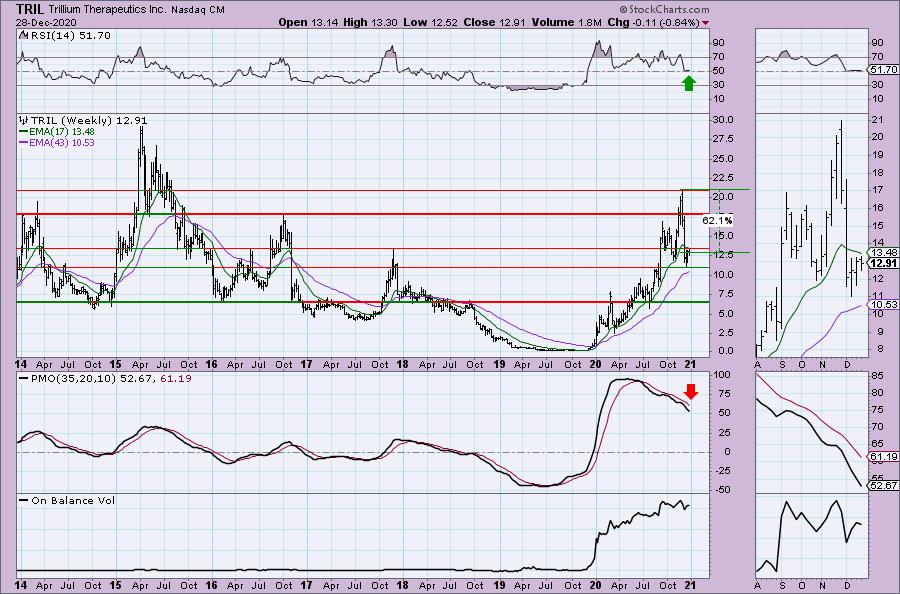
Right now price is coming up against resistance at the 2017 top. The PMO isn't looking good, but the RSI is still in positive territory which gives the weekly chart a slight bullish bias. If price could recapture its 2020 high, that would be a sizable 62%+ gain. Not so sure it will make it that far, but there is still an excellent gain to be had if it can get to the 2016 top.
Full Disclosure: I'm about 50% invested and 50% is in 'cash', meaning in money markets and readily available to trade with. I'm holding off adding any positions right now.
Current Market Outlook:
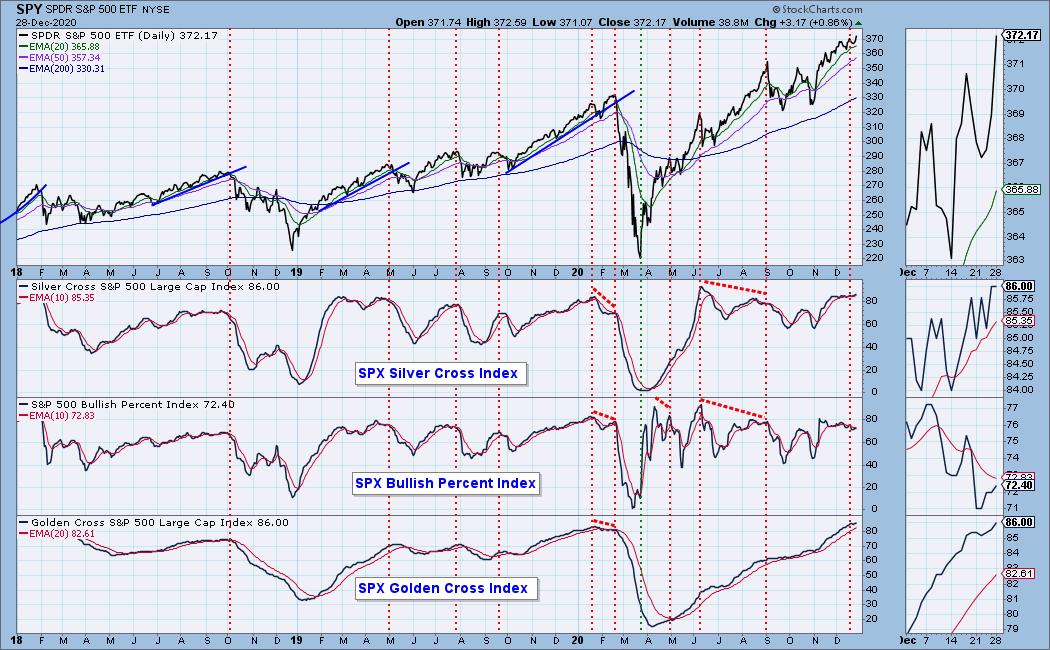
Market Environment: It is important to consider the odds for success by assessing the market tides. The following chart uses different methodologies for objectively showing the depth and trend of participation for intermediate- and long-term time frames.
- The Silver Cross Index (SCI) shows the percentage of SPX stocks on IT Trend Model BUY signals (20-EMA > 50-EMA)
- The Golden Cross Index (GCI) shows the percentage of SPX stocks on LT Trend Model BUY signals (50-EMA > 200-EMA)
- The Bullish Percent Index (BPI) shows the percentage of SPX stocks on Point & Figure BUY signals.
Don't forget that as a "Diamonds" member, you have access to our GCI/SCI curated ChartList on DecisionPoint.com. You'll find it under "Members Only" links on the left side on the Blogs and Links Page.
Here is the current chart:
Diamond Index:
- Diamond Scan Results: 9
- Diamond Dog Scan Results: 1
- Diamond Bull/Bear Ratio: 9.00
I'm in the process of trying to plot the Diamond Index, but with time at a premium, it is on the back burner.
Technical Analysis is a windsock, not a crystal ball.
Happy Charting!
- Erin
erin@decisionpoint.com
Watch the latest episode of DecisionPoint with Carl & Erin Swenlin on Mondays 7:00p EST or on the DecisionPoint playlist on the StockCharts TV YouTube channel here!
NOTE: The stocks reported herein are from mechanical trading model scans that are based upon moving average relationships, momentum and volume. DecisionPoint analysis is then applied to get five selections from the scans. The selections given should prompt readers to do a chart review using their own analysis process. This letter is not a call for a specific action to buy, sell or short any of the stocks provided. There are NO sure things or guaranteed returns on the daily selection of "diamonds in the rough."
Helpful DecisionPoint Links:
DecisionPoint Shared ChartList and DecisionPoint Chart Gallery
Price Momentum Oscillator (PMO)
Swenlin Trading Oscillators (STO-B and STO-V)
For more links, go to DecisionPoint.com!