
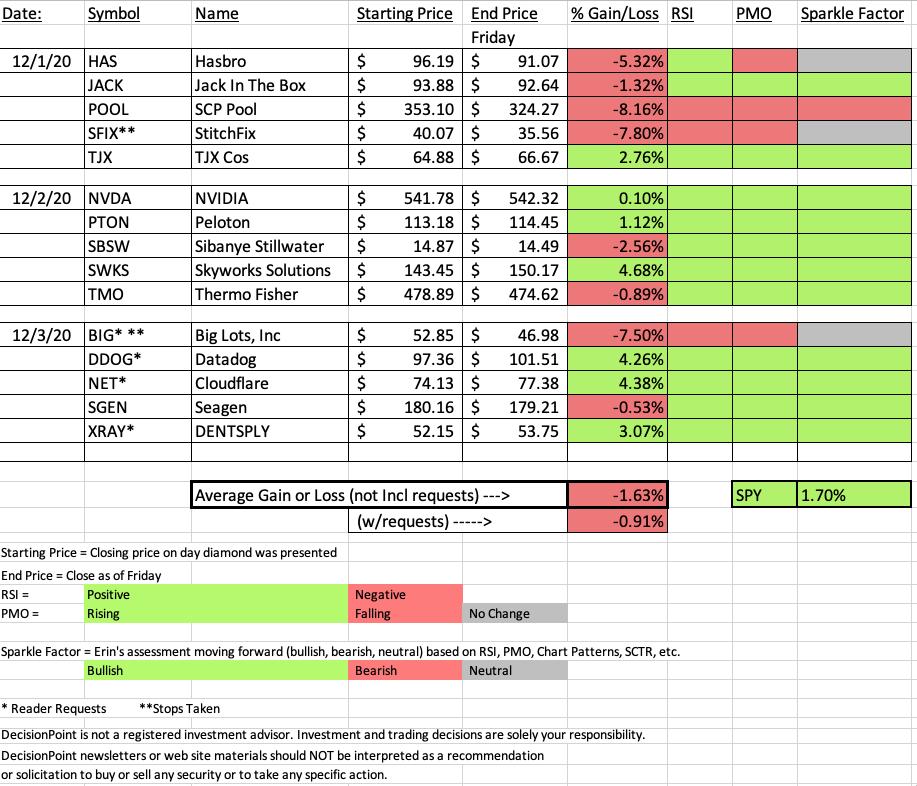
I wanted to talk more about the "Sparkle Factor" on the Recap spreadsheet. Since I clean the slate on Fridays, many of you want to know what my thoughts are going forward on some of these Diamonds, especially if you happen to own one. In the spreadsheet's final column, I have a color code that gives you my overall impression going forward. If I list it as "neutral" or gray, that means it could go either way based on the price action and indicators. I find that I rarely have a "red" or bearish Sparkle Factor. Many Diamonds in the Rough I seem to catch a little too early and being stuck with a one week deadline on performance, they finish down for the week, but still look good. This is why sometimes you will see a negative RSI and/or PMO and yet still have a bullish Sparkle Factor.
The Diamonds Recap spreadsheet did improve since I presented it in this morning's Diamond Mine trading room (the recording link is below) which added some additional "green". Unfortunately it wasn't enough to beat the SPY. I did go back and look and in November, we beat the SPY 3 out of 4 times.
It may appear on the spreadsheet that the biggest loser or Diamond Dog is POOL. It's not, it is SFIX which hit its stop and continued lower. So in actuality it is the biggest loser. POOL is definitely a dog this week and I do not see any potential moving forward on it. It nearly hit its 9.2% stop level. I decided to cover SFIX as this week's "Dud" since I know it truly was the Diamond Dog of the week.
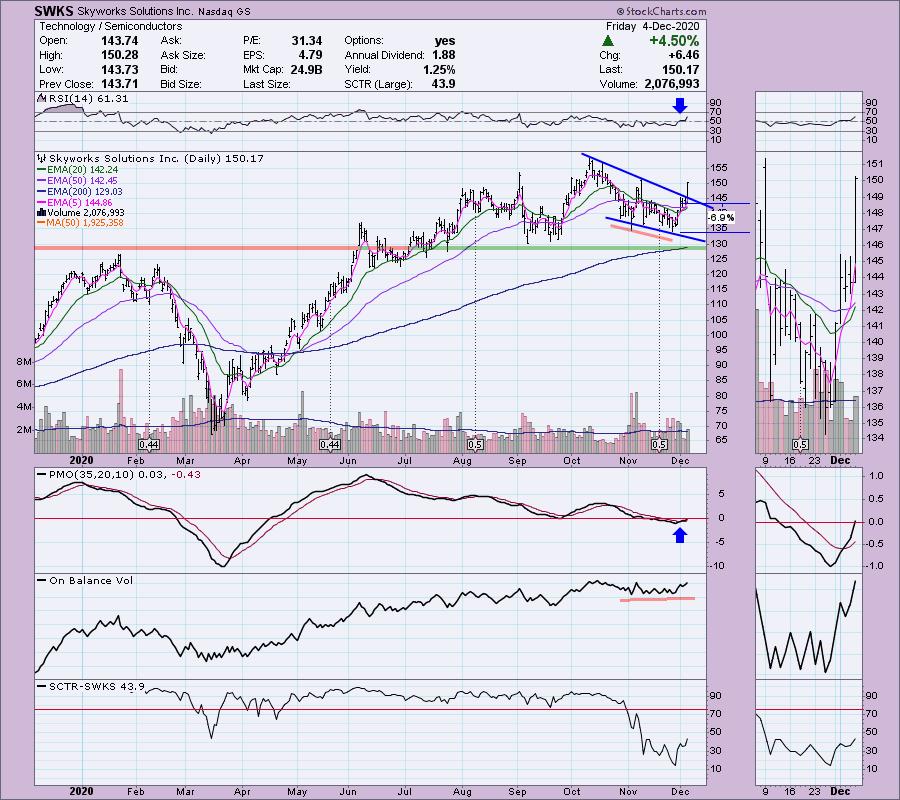
The big winner was Skyworks (SWKS) which was up 4.68%. This one still looks great. I'm not covering it today, but I really like the reader request, XRAY moving forward. I will likely add it to my portfolio next week. I will give you notice if I do in the "Full Disclosure" statement at the bottom of all reports.
The new Diamond Mine registration link is available below. Remember to save your confirmation email from Zoom. It has all of the information needed to join the room. Many times Zoom doesn't send out the one-hour reminder email on time.
 Diamond Mine Information:
Here is today's (12/4/2020) recording link. Access Passcode: FrA8@Q9=
Register in advance for the next "DecisionPoint Diamond Mine" trading room on Friday (12/11/2020) 12:00p ET:
Here is the registration link for Friday, 12/4/2020. Registration & Entry Password: holiday
Please do not share these links! They are for Diamonds subscribers ONLY!
Save the registration confirmation email with login instructions in case Zoom doesn't notify you in time.
A few items about the spreadsheet: I decided it only fair to denote "reader requests" as I shouldn't get to take credit if they turn out great! I've put on the spreadsheet whether the RSI is positive (green) or negative (red). The PMO column tells you if it is rising (green) or falling (red). Finally I've added my own "Sparkle Factor" that gives you my assessment going forward, bullish (green), bearish (red) or neutral (gray). The Sparkle Factor is basically my thoughts on whether I expect it to rise or fall. A neutral means it could really go either way so it could be added to a watch list. If you're in a stock I consider "neutral" going forward, the ball is in your court.

It's FREE!
***Click here to register for this recurring free DecisionPoint Trading Room!***
Did you miss the 11/30 trading room with Julius de Kempenaer? We put all of the symbol requests into an RRG and analyzed them from there! Here's a link to the recording with Passcode: 9&vn0w^g
For best results, copy and paste the password to avoid typos.
DUD:
Stitch Fix, Inc. (SFIX)
EARNINGS: 12/7/2020 (AMC)
Stitch Fix, Inc. is an online personal styling service that delivers personalized fixes of apparel and accessories to men, women and kids. The company was founded by Katrina Lake and Erin Morrison Flynn in February 2011 and is headquartered in San Francisco, CA.
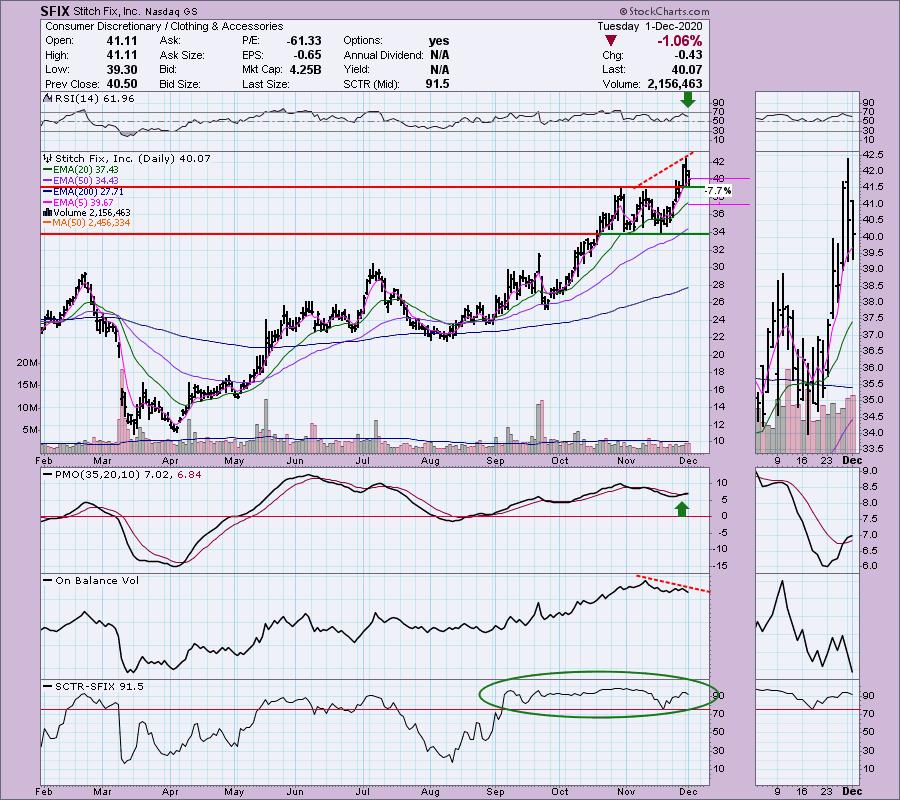
Here is the chart and commentary from Tuesday, 12/1:
"If this one sounds familiar that's because I covered it in the October 15th Diamonds Report. Since then it is up +23.5%! It looks like there is another entry available for SFIX right now on this pullback. Support is holding at the October/November highs. The PMO gave us a BUY signal last week. The RSI is positive and the SCTR is in the "hot zone". The one thing I do not like is the negative OBV divergence, but given the bullishness on the rest of the chart, I'm picking it."
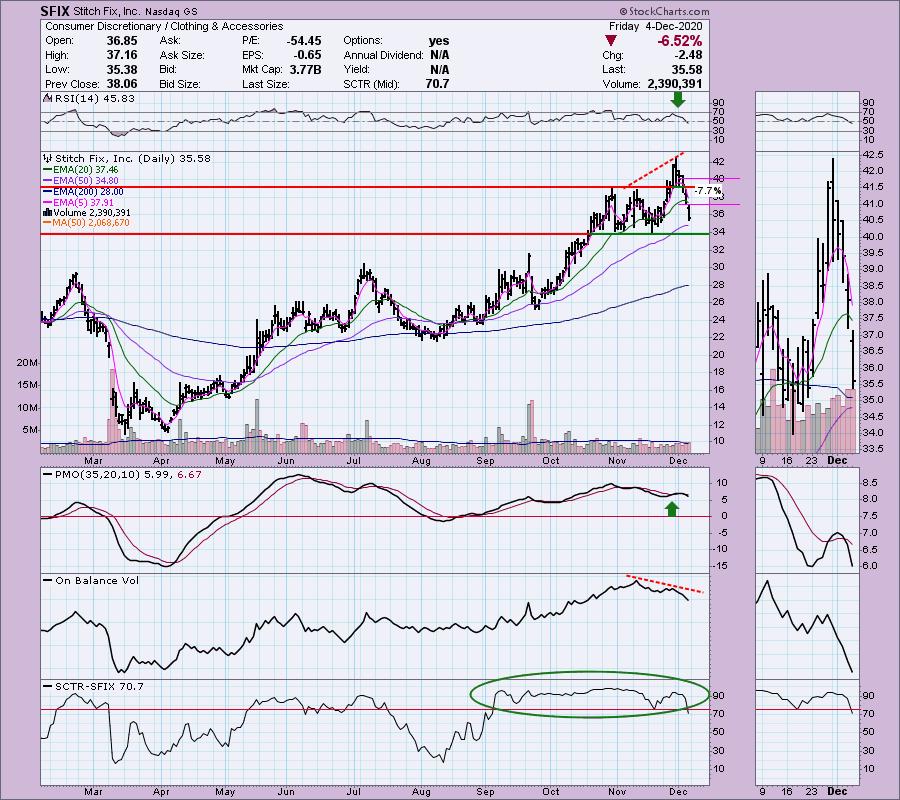
Here is today's chart. They report earnings next week and it appears the street is anticipating bad news as SFIX fell from the sky as soon as it made the Diamonds Report. There was a negative OBV divergence to give me a hint this one could be a problem but as I commented above, I felt the indicator setup and price movement so far made it a Diamond. I've listed it with a "neutral" Sparkle Factor going forward. Although the indicators are very negative right now, it is nearing an important support level. I'm keeping it in my watch list unless earnings are underwhelming.
Don't forget, on Thursdays I look at reader-requested symbols, so shoot me an email at erin@decisionpoint.com. I read every email I receive and try to answer them all!
Darling:
Skyworks Solutions Inc. (SWKS)
EARNINGS: 1/21/2021 (AMC)
Skyworks Solutions, Inc. engages in the design, development, and manufacture of proprietary semiconductor products. Its product portfolio includes amplifiers, attenuators, circulators, demodulators, detectors, diodes, directional couplers, front-end modules, hybrids, isolators, lighting and display solutions, mixers, modulators, optocouplers, optoisolators, phase shifters, synthesizers, power dividers and combiners, receivers, switches, and technical ceramics. The company was founded in 1962 and is headquartered in Woburn, MA.
Here is the chart and my commentary from 12/2:
"Well here is a Diamond that I haven't covered this year. This is my second Semiconductor. There is a bullish falling wedge and price is getting ready to test the top of it. The expectation for the pattern is an upside breakout. The 5-EMA just crossed above the 20-EMA which triggered a ST Trend Model BUY signal. The RSI just moved into positive territory and the PMO generated a crossover BUY signal today. The stop level is shallow at only 7%. It is lined up with support at that most recent low. There is a slight positive divergence with the OBV that is coming as price is beginning to rally again."
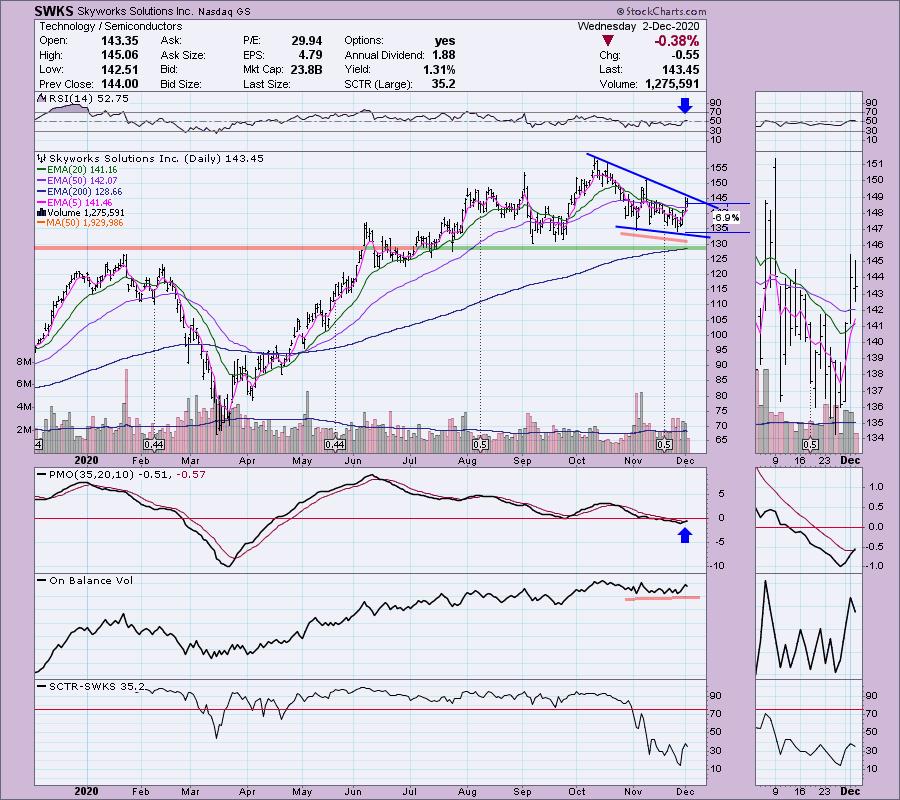
Below is today's chart which continues to look even more bullish. The bullish falling wedge executed as expected in a big way today. The indicators are still strong and not at all overbought. There is some overhead resistance at the September top to contend with, but this chart is very bullish so I have given it a bullish Sparkle Factor. I don't think it is too late for entry on this one. I expect a bit of a pullback on Monday which could offer a better entry.
THIS WEEK's Sector Performance:
CONCLUSION:
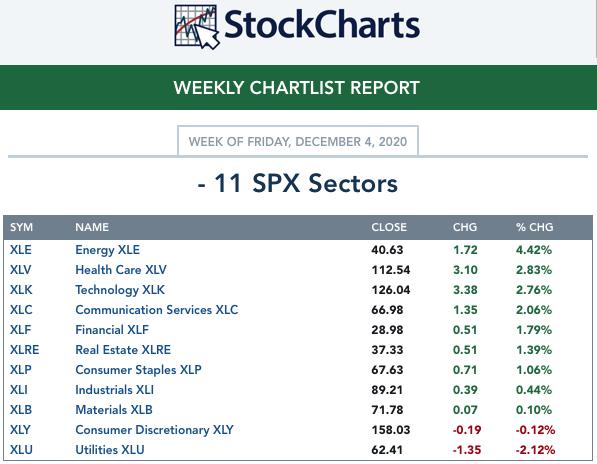
Last week's sector to watch was Consumer Discretionary (XLY). While I still like this sector, I'm going to likely surprise you with my sector to watch this week. The Real Estate (XLRE) sector chart looks really good right now. Indicators aren't overbought and they are rising. If we get a breakout here, I believe this sector will have legs to run. As far as an industry group to watch, in Real Estate, I would watch Hotels and Lodging REITs.
Sector to Watch: Real Estate (XLRE)
Industry Group to Watch: Hotels & Lodging REITs ($DJUSHL)
Go to our Sector ChartList on DecisionPoint.com to get an in depth view of all the sectors.
Have a great weekend! Happy Charting!
- Erin
erin@decisionpoint.com
Full Disclosure: I'm about 70% invested right now and 30% is in 'cash', meaning in money markets and readily available to trade with. I will continue to add to my portfolio next week if the market outlook remains bullish in the short term. I will be considering entries into SGEN and XRAY next week.
Technical Analysis is a windsock, not a crystal ball.
Watch the latest episode of DecisionPoint with Carl & Erin Swenlin on Mondays 7:00p EST or on the DecisionPoint playlist on the StockCharts TV YouTube channel here!
NOTE: The stocks reported herein are from mechanical trading model scans that are based upon moving average relationships, momentum and volume. DecisionPoint analysis is then applied to get five selections from the scans. The selections given should prompt readers to do a chart review using their own analysis process. This letter is not a call for a specific action to buy, sell or short any of the stocks provided. There are NO sure things or guaranteed returns on the daily selection of "diamonds in the rough."
Helpful DecisionPoint Links:
DecisionPoint Shared ChartList and DecisionPoint Chart Gallery
Price Momentum Oscillator (PMO)
Swenlin Trading Oscillators (STO-B and STO-V)
For more links, go to DecisionPoint.com!