
I thoroughly enjoy looking through the many requests sent in by readers to determine the four that either look the best or have a 'teachable moment' available. This week I believe the four reader requests have excellent potential, although one is fairly overbought.
Today I had difficulty selecting my pick. Miners are still popping in my scans but I covered my favorite yesterday so I went out on a limb a little bit with a Biotech that has great short-term potential.
If you haven't registered for tomorrow's Diamond Mine, the information is below. Remember to save the confirmation email as it has the instructions and link to get into the room. I think I'll open your mics tomorrow for questions or comments! As always I will take questions and symbol requests in the Q&A box as well.
Today's "Diamonds in the Rough" are: BIG, DDOG, NET, SGEN and XRAY.
 Diamond Mine Information:
Here is Friday's (11/20) recording link. Use Access Passcode: @f#x+6qP
Register in advance for the next "DecisionPoint Diamond Mine" trading room on Friday (12/4/2020) 12:00p ET:
Here is the registration link for Friday, 12/4/2020. Password: turkey
Please do not share these links! They are for Diamonds subscribers ONLY!

It's Free!
***Click here to register for this recurring free DecisionPoint Trading Room on Mondays at Noon ET!***
Did you miss the 11/30 free trading room with Julius de Kempenaer? It's a must-see! Here is a link to the recording. Access Code: 9&vn0w^g
For best results, copy and paste the access code to avoid typos.
Welcome to DecisionPoint Daily Diamonds, wherein I highlight five "diamonds in the rough." These are selected from the results of my DecisionPoint scans, which search for stocks that could benefit from the trend and condition of the market. Remember, these are not recommendations to buy or sell, but are the most interesting of the stocks that surfaced in my scans. My objective is to save you the work of the initial, tedious culling process, but you need to apply your own analysis to see if these stocks pique your interest as well. There are no guaranteed winners here!
Big Lots, Inc. (BIG)
EARNINGS: 12/4/2020 (BMO)
Big Lots, Inc. engages in the operation of retail stores. It operates through the Discount Retailing segment which includes merchandising categories such as furniture, seasonal, soft home, food, consumables, hard home, and electronics, toys, and accessories. The company was founded by Sol A. Shenk in 1967 and is headquartered in Columbus, OH.
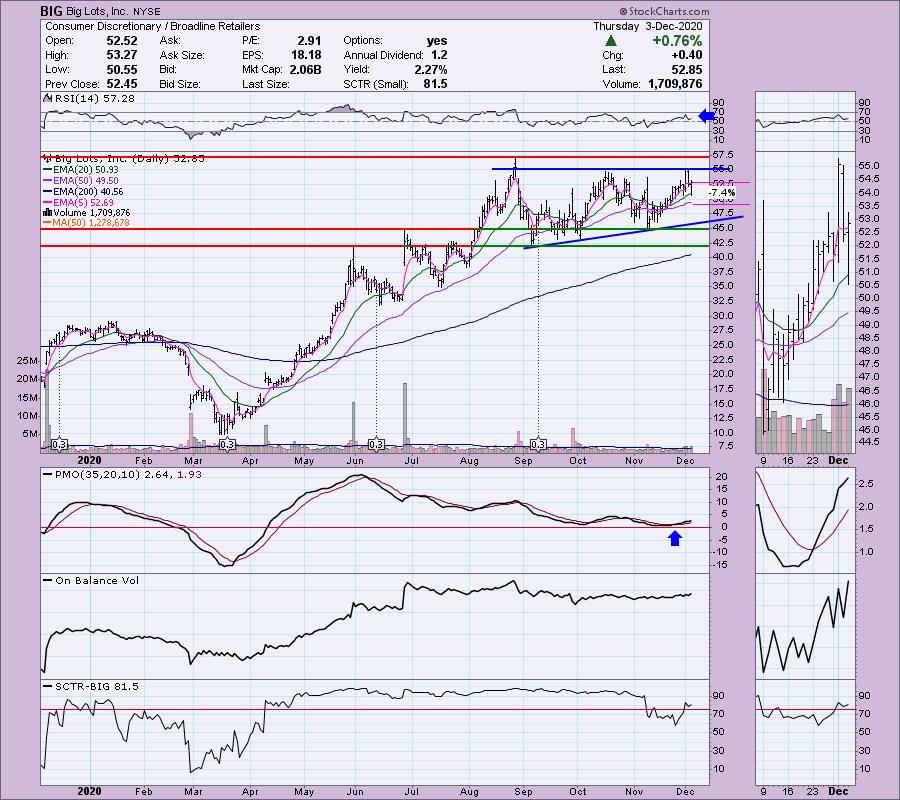
First, BIG reports earnings tomorrow and it is currently down -1.23% in after hours trading. I covered BIG in the July 1st Diamonds Report (it's up 25.9% since). If this one is interesting to you, I believe you will have a better entry tomorrow than today's closing price. I would set a shallow stop, although if your entry is lower, you could certainly lengthen it. I have the stop at the 50-EMA right now. Currently there is a bullish ascending triangle. Price failed to breakout and is now pulling back. The chart looks strong in any case with a positive RSI, a PMO rising out of an oversold BUY signal. The SCTR is in the "hot zone" above 75.
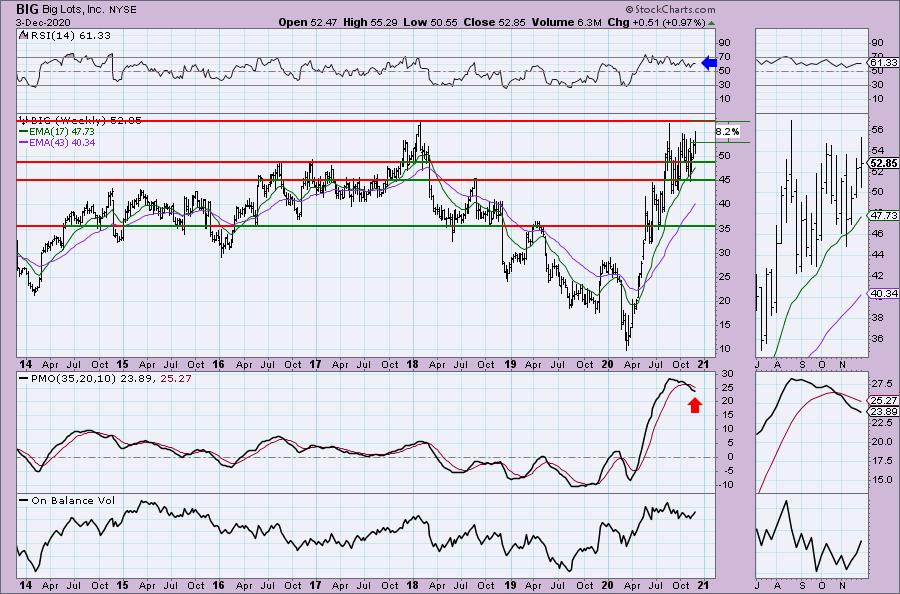
The weekly chart could look better as the PMO has triggered a SELL signal in overbought territory. We can also see that overhead resistance is looming at the 2018 top. The PMO is flattening and not accelerating, so that's good and the RSI is in positive territory which is also bullish.
Datadog Inc. (DDOG)
EARNINGS: 2/11/2021 (AMC)
Datadog, Inc. engages in the development of monitoring and analytics platform for developers, information technology operations teams and business users. Its platform integrates and automates infrastructure monitoring, application performance monitoring and log management to provide real-time observability of its customers' entire technology stack. The company was founded by Olivier Pomel and Alexis Lê-Quôc on June 4, 2010 and is headquartered in New York, NY.
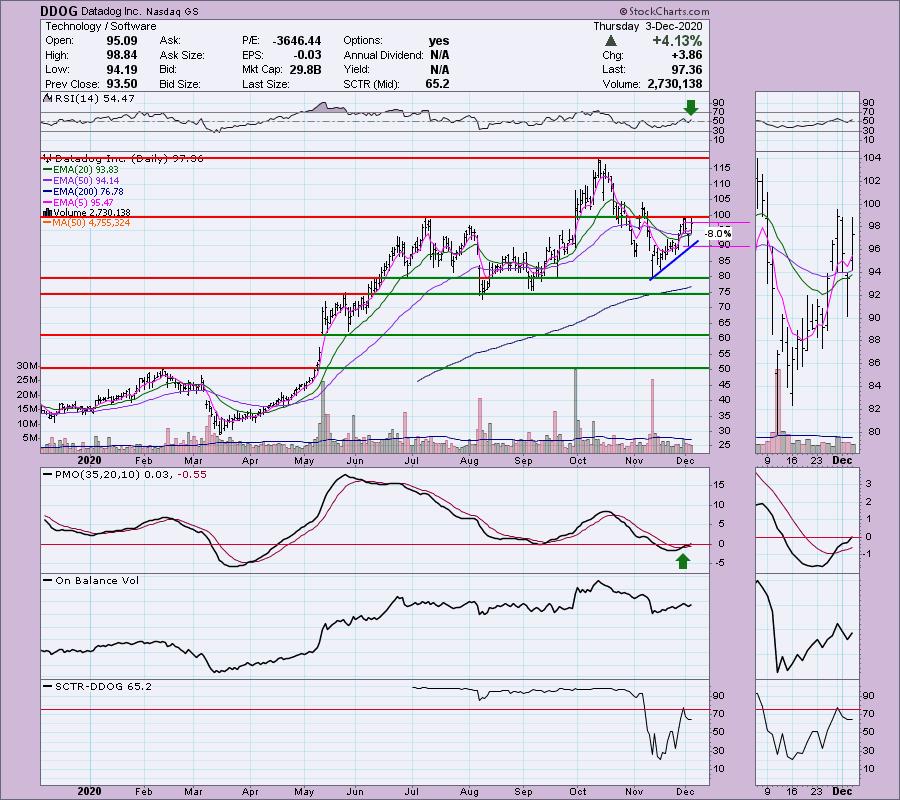
Salvador requested this one last week and I'm wishing I had presented it to you then, but so it goes, I can only pick four. DDOG is up +0.63% in after hours trading despite rallying over 4% today. Momentum is behind this one. The PMO triggered a BUY signal in oversold territory and it is now above zero. The RSI is positive. Currently DDOG is holding its short-term rising trend. It's going to be fighting against overhead resistance at the July top or even the November top, but given the bullishness of this chart, I doubt it will struggle too much.
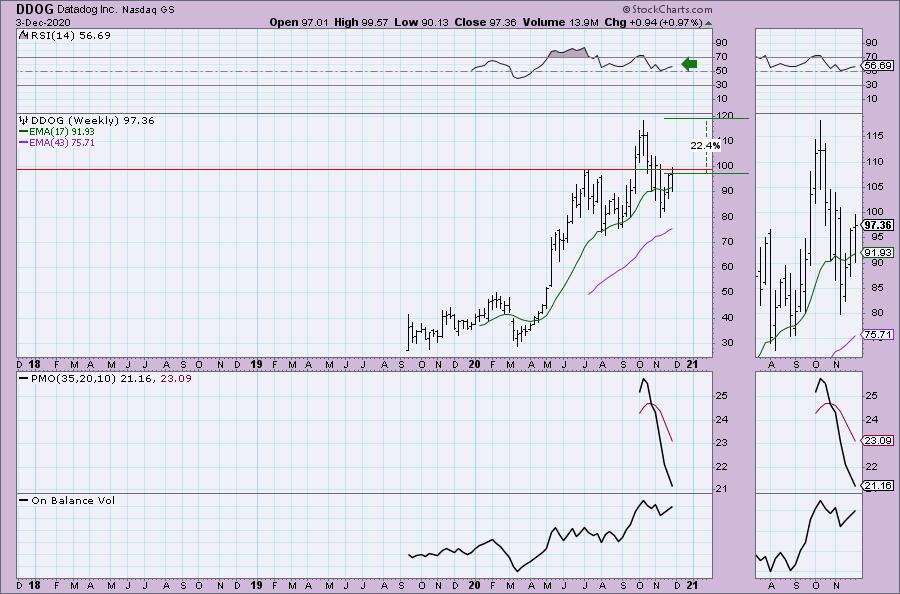
We don't have much more data on the weekly chart than on the daily chart, but it does compress it for a different view. Don't get too tangled up with the PMO, it is only now beginning to calculate and may take some time to find its range. The RSI is positive, but be careful if it doesn't manage to breakout soon.
Don't forget, on Thursdays I look at reader-requested symbols, so shoot me an email at erin@decisionpoint.com. I read every email I receive and try to answer them all!
Cloudflare Inc. (NET)
EARNINGS: 2/11/2021 (AMC)
Cloudflare, Inc. engages in the provision of cloud-based services to secure websites. It offers various products for performance and reliability, video streaming and delivery, advanced security, insights, cloudflare for developers, domain registration and cloudflare marketplace. The company was founded by Matthew Prince, Michelle Zatlyn and Lee Holloway in 2009 and is headquartered in San Francisco, CA.
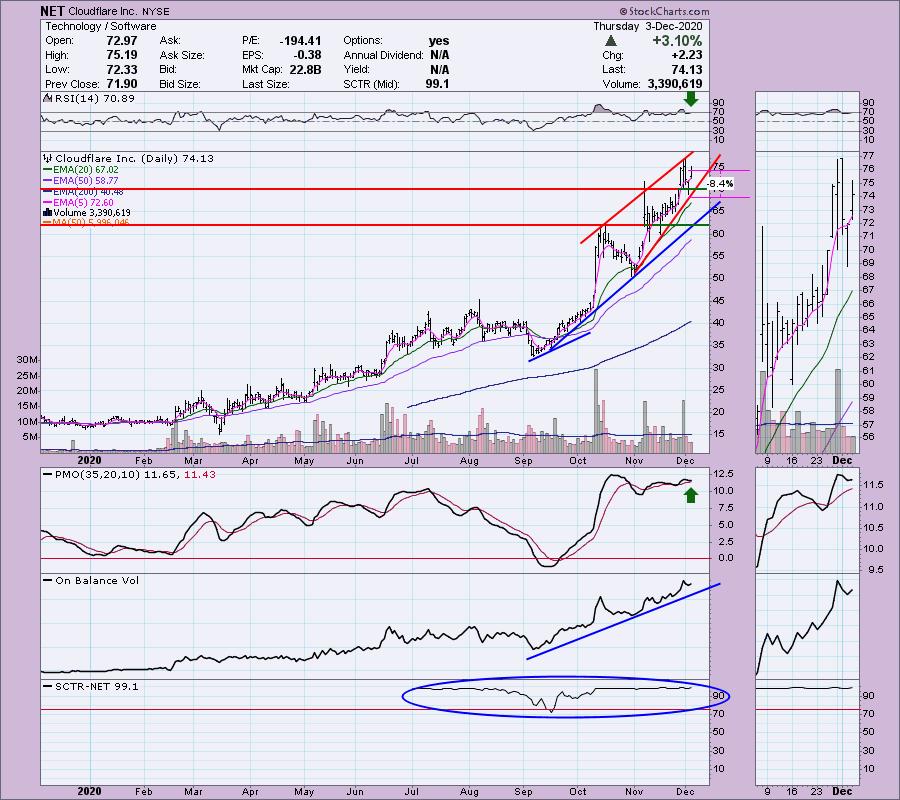
NET is up +0.17% in after hours trading. I like this chart and the cloud stocks in general. The rising trend has been accelerating and when that happens it generally gets harder to maintain. Additionally, there is a bearish rising wedge. The RSI is on the overbought side. The PMO had turned over, but it is looking like it will bottom above the signal line which is very bullish. Volume is coming in and supporting this rally and the SCTR is strong. Bottom line: I am bullish on NET, but would keep on top of it to make sure that bearish rising wedge doesn't execute with a breakdown. It's very overbought.
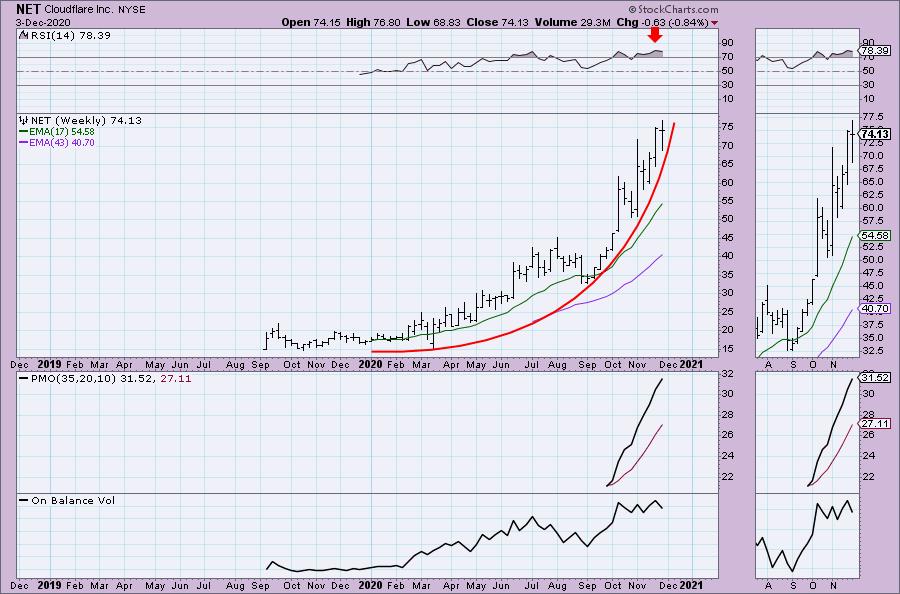
This one also is has a thin database. The PMO is positive. The RSI is very overbought and there is a parabolic rally happening. Parabolics are great fun and it should continue higher. However, protect yourself with a trailing stop because when these formations break down, they BREAK DOWN, typically with a downside price shock. We know this one is overbought on the daily chart as well. I'd ride the wave higher, but I would be very firm about my stop level.
Seagen (SGEN)
EARNINGS: 2/4/2021 (AMC)
Seagen Inc. is a biotechnology company, which engages in the development and commercialization of antibody-based therapies for the treatment of cancer. Its products include Adcetris and Padcev. The firm is also advancing a pipeline of novel therapies for solid tumors and blood-related cancers. The company was founded by Clay B. Siegall and H. Perry Fell on July 15, 1997 and is headquartered in Bothell, WA.
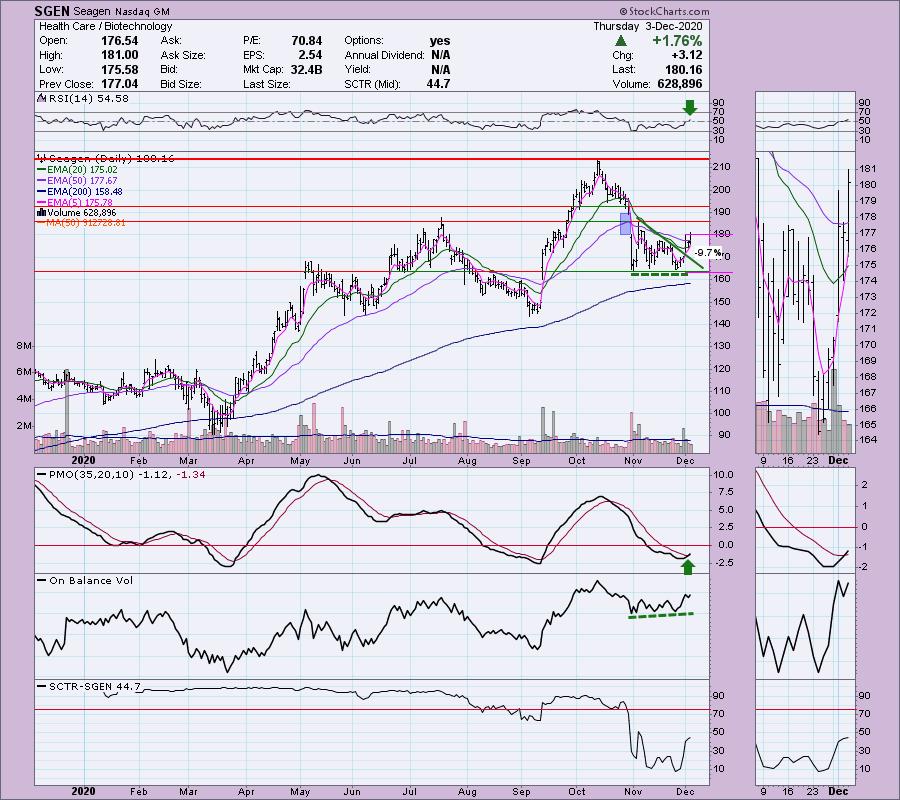
This is my pick today. It is currently down -0.20% in after hours trading. The PMO and RSI are exactly where I like them. The PMO just triggered a BUY signal in oversold territory. It looks like a "clean" crossover so far (no whipsaw). Price just vaulted the 20/50-EMAs. It has broken out of a short-term declining trend that actually forms the top of a bearish descending triangle. Whenever I see a bullish resolution to a bearish chart pattern, I consider it especially bullish. The main issue I have is that gap resistance has been holding and could be difficult to break through. The OBV has a slight positive divergence with price bottoms and the SCTR is improving.
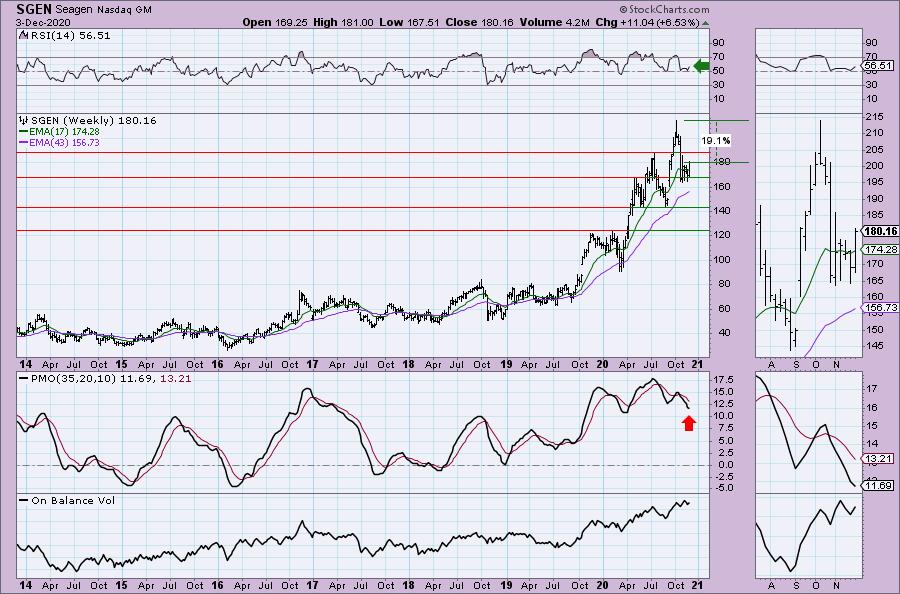
Looking at the weekly chart, momentum isn't positive, but the RSI is positive. The OBV is rising and confirming the longer-term rally. If it can get above resistance, there is a potential 19% gain ahead.
DENTSPLY Intl Inc. (XRAY)
EARNINGS: 3/1/2021 (BMO)
Dentsply Sirona, Inc. engages in the design, manufacture, sales, and distribution of professional dental products and technologies. It operates through the Technologies and Equipment, and Consumables segments. The Technologies and Equipment segments comprises dental technology, equipment, and healthcare consumable products such as dental implants, laboratory dental products, computer-aided design and computer-aided manufacturing systems, imaging systems, treatment centers, and consumable medical device products. The Consumables segment offers preventive, restorative, instruments, endodontic, and orthodontic dental products. The company was founded in 2016 and is headquartered in Charlotte, NC.
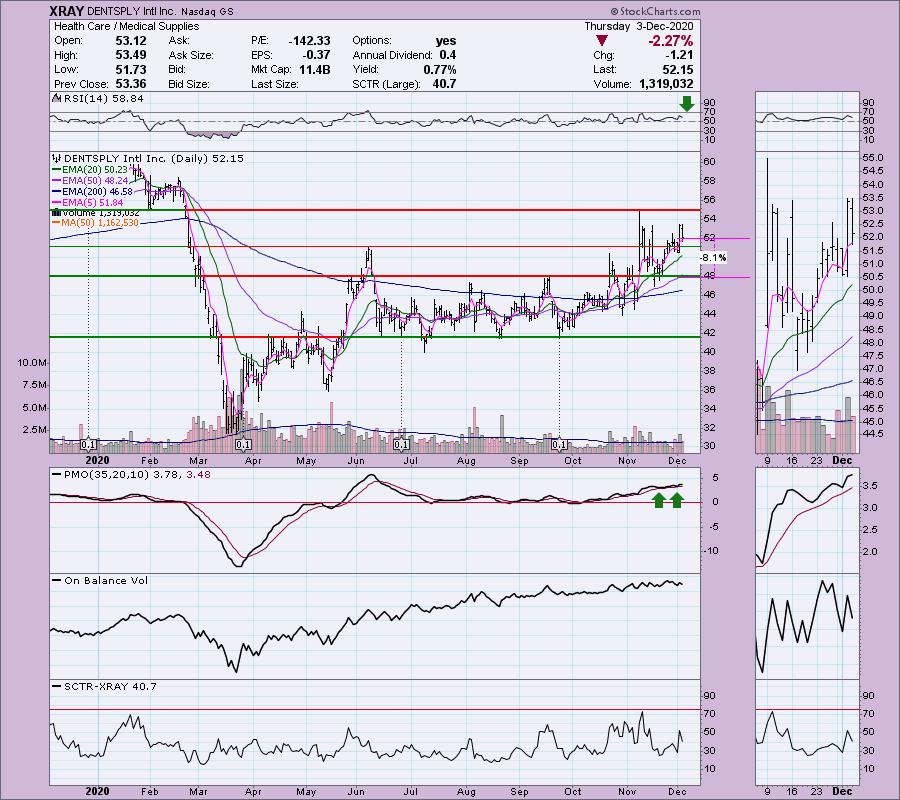
I really like XRAY, Fred. The RSI is positive, the PMO is not only rising but it has made two bottoms above its signal line which is especially bullish. The OBV bottoms are rising with price. I set the stop level near the 50-EMA and the top of the summer trading range. $55 seems difficult resistance, but it should push through.
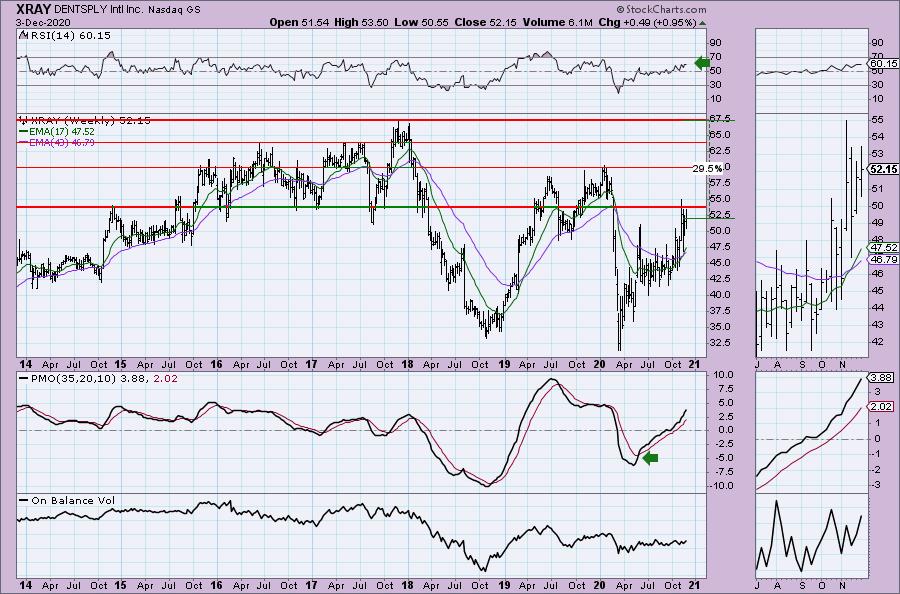
This is probably the best looking weekly chart of the bunch. The PMO is on a BUY signal and the RSI is in positive territory. This is a difficult resistance level given the numerous "touches" by price highs and lows. However, with both the daily and the weekly charts so positive, I would look for a move to at least the 2020 high, but it could certainly move further.
Full Disclosure: I'm about 70% invested and 30% is in 'cash', meaning in money markets and readily available to trade with.
Current Market Outlook:
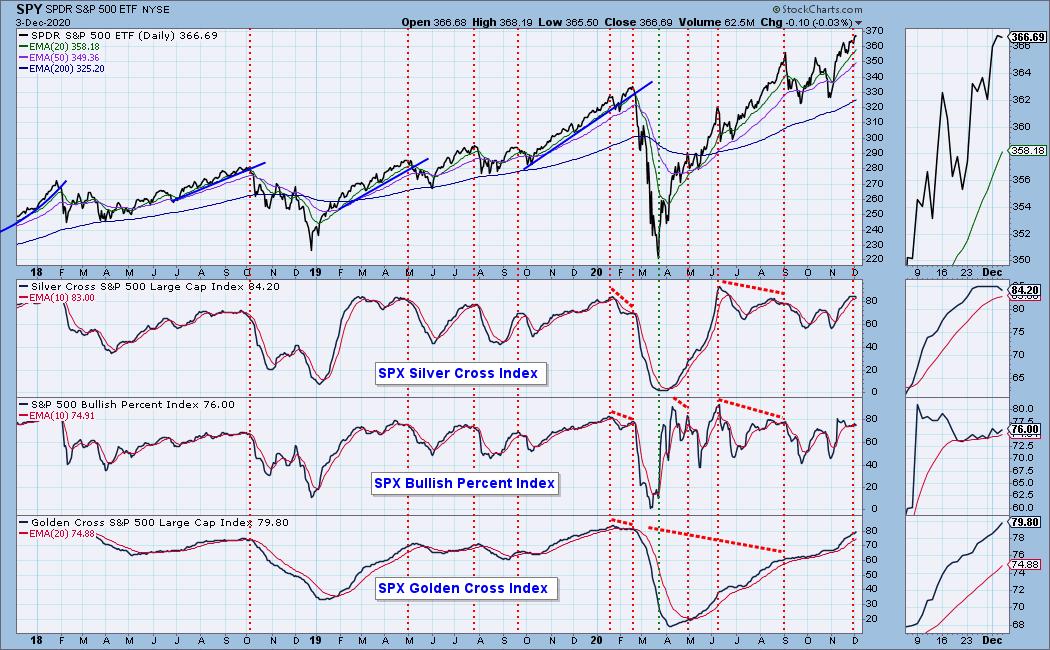
Market Environment: It is important to consider the odds for success by assessing the market tides. The following chart uses different methodologies for objectively showing the depth and trend of participation for intermediate- and long-term time frames.
- The Silver Cross Index (SCI) shows the percentage of SPX stocks on IT Trend Model BUY signals (20-EMA > 50-EMA)
- The Golden Cross Index (GCI) shows the percentage of SPX stocks on LT Trend Model BUY signals (50-EMA > 200-EMA)
- The Bullish Percent Index (BPI) shows the percentage of SPX stocks on Point & Figure BUY signals.
Don't forget that as a "Diamonds" member, you have access to our GCI/SCI curated ChartList on DecisionPoint.com. You'll find it under "Members Only" links on the left side on the Blogs and Links Page.
Here is the current chart:
Diamond Index:
- Diamond Scan Results: 2
- Diamond Dog Scan Results: 7
- Diamond Bull/Bear Ratio: 0.29
I'm in the process of trying to plot the Diamond Index, but with time at a premium, it is on the back burner.
Technical Analysis is a windsock, not a crystal ball.
Happy Charting!
- Erin
erin@decisionpoint.com
Watch the latest episode of DecisionPoint with Carl & Erin Swenlin on Mondays 7:00p EST or on the DecisionPoint playlist on the StockCharts TV YouTube channel here!
NOTE: The stocks reported herein are from mechanical trading model scans that are based upon moving average relationships, momentum and volume. DecisionPoint analysis is then applied to get five selections from the scans. The selections given should prompt readers to do a chart review using their own analysis process. This letter is not a call for a specific action to buy, sell or short any of the stocks provided. There are NO sure things or guaranteed returns on the daily selection of "diamonds in the rough."
Helpful DecisionPoint Links:
DecisionPoint Shared ChartList and DecisionPoint Chart Gallery
Price Momentum Oscillator (PMO)
Swenlin Trading Oscillators (STO-B and STO-V)
For more links, go to DecisionPoint.com!