
Today an ETF appeared on my scans that I think you'll like. It's a "juiced" ETF which generally is not my cup of tea due to the volatility that you have swallow when you choose to invest. However, this one could take advantage of an area of the market that has caught our attention once again.
If you read Carl's article this morning, you'll know that what I'm hinting at is Natural Gas. (Remember, since the first sentence or two is previewed in our blog roll, I need to protect YOUR investment in Diamonds by not giving away anything).
Two "Diamonds in the Rough" are presented with what looks like an early entry on newly found strength.
I figured out that embedding links into these blog articles is an issue when I update the link. This is why some of you are having registration issues. To fix the problem, I'm just going to put the invitation directly into the articles.
Today's "Diamonds in the Rough" are: BOIL, CTAS, FCPT, MUSA and PSTX.
 Diamond Mine Registration Information:
When: Feb 5, 2021 09:00 AM Pacific Time (US and Canada) Topic: DecisionPoint Diamond Mine (2/5/2021) LIVE Trading Room Register in advance for this webinar: https://zoom.us/webinar/register/WN_kIjSNGe5SPysBAEHFGs6YQ
After registering, you will receive a confirmation email containing information about joining the webinar. ===============================================================================
Here is the information for viewing the recording:
Date: Jan 29, 2021 08:58 AM Pacific Time (US and Canada) Meeting Recording: https://zoom.us/rec/share/WQMENRcBm-l5Ioawtb2sjGq6zVeE1Fwg6A82cCFwQCzHIuEkX6WO0iMgjtzEXBKK.ryahtNrhhc23Cgw5 Access Passcode: xqh%L59J

It's Free!
***Click here to register for this recurring free DecisionPoint Trading Room on Mondays at Noon ET!***
+++++++++++++++++++++++++++++++++++++++++++++++++++++++++++++++++++++++++++++++
Here is the information for Monday 2/1/2021 recording. Mark Young, CMT was my guest so you don't want to miss it!
Topic: DecisionPoint Trading Room Date: Feb 1, 2021 08:48 AM Pacific Time (US and Canada) Meeting Recording: https://zoom.us/rec/share/ltsyRoM608nM3zoHC-_kSHu8DeoIDEG-t4W-jta5hpqLvtqzyBnwYkKil22LA747.EBefqdi8r7kDru4o Access Passcode: Lb.9Q$9e
For best results, copy and paste the access code to avoid typos.
Welcome to DecisionPoint Daily Diamonds, wherein I highlight five "diamonds in the rough." These are selected from the results of my DecisionPoint scans, which search for stocks that could benefit from the trend and condition of the market. Remember, these are not recommendations to buy or sell, but are the most interesting of the stocks that surfaced in my scans. My objective is to save you the work of the initial, tedious culling process, but you need to apply your own analysis to see if these stocks pique your interest as well. There are no guaranteed winners here!
ProShares Ultra Bloomberg Natural Gas (BOIL)
EARNINGS: N/A
BOIL provides 2x the daily return of an index that measures the price performance of natural gas as reflected through publicly traded natural gas futures contracts.
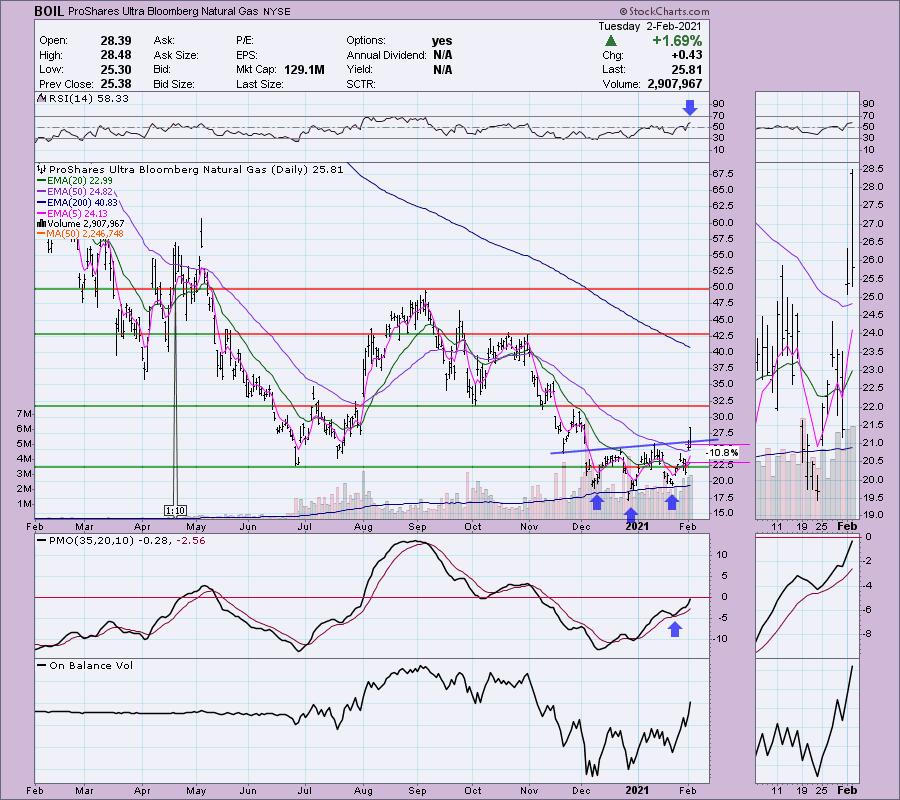
Before talking about BOIL, I just want to be clear that I am not giving you recommendations. This is a 2x ETF. Be cautious and understand exactly what you are investing in. That said, the chart looks great (just like UNG's). We have a bullish reverse head and shoulders bottom that executed today with a break above the neckline. I do note that it did close back below the neckline. The PMO is rising nicely and the RSI just turned positive. Price has traded above the 50-EMA for two days now. Setting a stop is tricky. The best support is at the June low, but that is a 13% stop. I opted to match it close to the 20-EMA and the bottom of the gap from Friday.
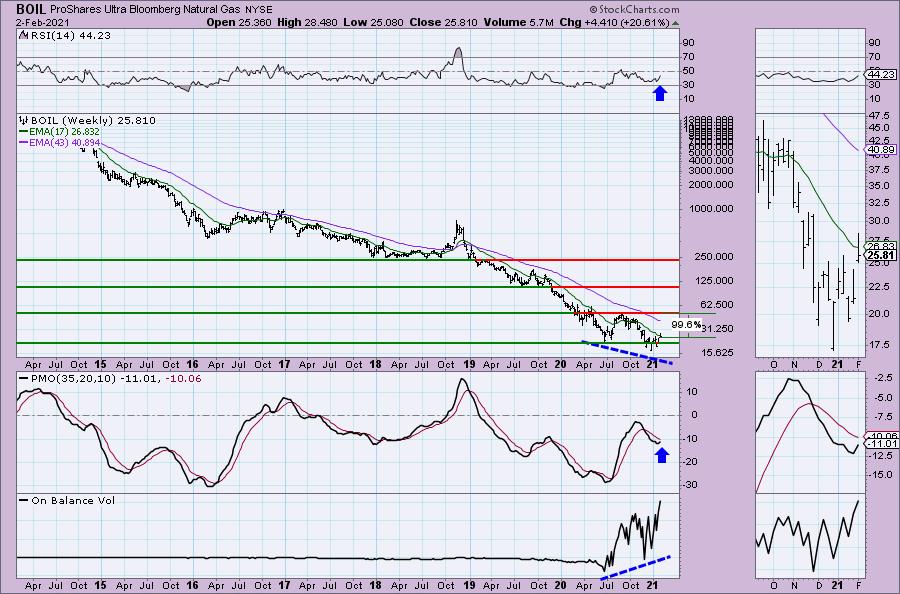
I like the weekly chart despite a negative RSI. I used the log-scale to create this chart so I haven't drawn any trendlines. Support and resistance levels are pretty clear. There is a double-bottom forming and if price can challenge the confirmation line, that would be a nearly 100% gain. I'm not suggesting that will happen, but it is a reasonable upside target when you look at the chart. We also have a positive OBV divergence on that double-bottom that is developing.
Cintas Corp. (CTAS)
EARNINGS: 3/18/2021 (BMO)
Cintas Corp. engages in the provision of corporate identity uniform through rental and sales programs. It operates through the following segments: Uniform Rental and Facility Services, First Aid and Safety Services, All Other, and Corporate. The Uniform Rental and Facility Services segment consists of rental and servicing of uniforms and other garments including flame resistant clothing, mats, mops and shop towels, and other ancillary items. The First Aid and Safety Services segment comprises of first aid and safety products and services. The All Other segment includes fire protection services and its direct sale business. The Corporate segment consists of corporate assets such as cash and marketable securities. The company was founded by Richard T. Farmer in 1968 and is headquartered in Cincinnati, OH.
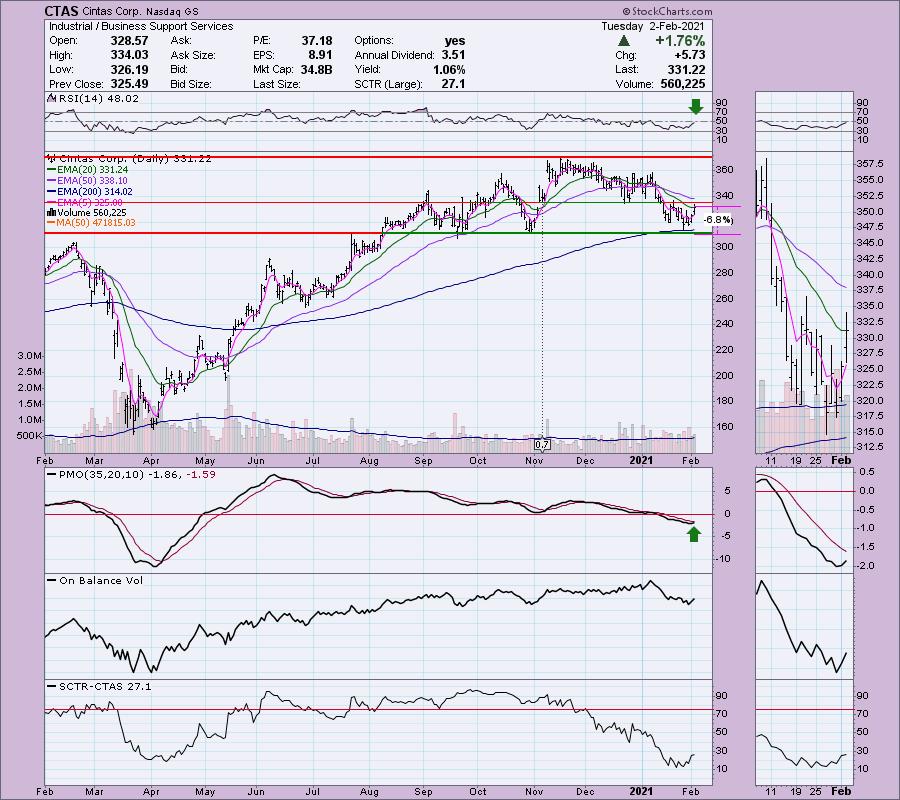
CTAS has created a rounded top which I wasn't happy about, but it appears price will test the top. This is an early lead as the RSI is still negative (though rising) and the PMO has just barely turned up. If you look in the thumbnail, you can see the short-term declining trend has been broken and you could make a case for a double-bottom. I like that you can set a reasonable stop below the 200-EMA.
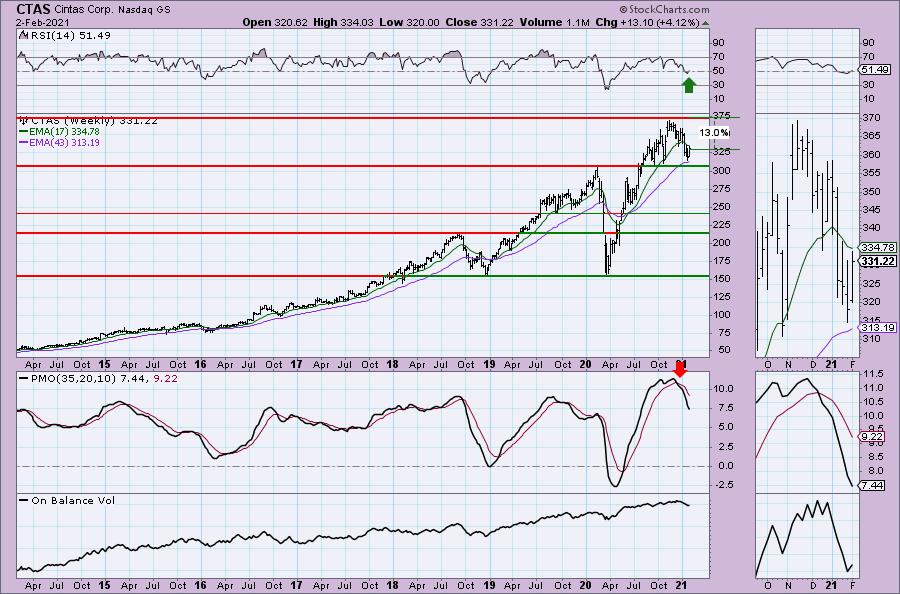
The rounded top looks more ominous on the weekly chart, especially when accompanied by the PMO SELL signal in overbought territory. There is solid support here at the bull market top in 2020 and the 43-week EMA. The PMO appears to be decelerating somewhat. Just don't give it a long leash, stick to that stop above. We don't want to see any prices at $300 or less.
Four Corners Property Trust, Inc. (FCPT)
EARNINGS: 2/17/2021 (AMC)
Four Corners Property Trust, Inc. engages in the owning, acquisition, and leasing of properties for use in the restaurant and food-service related industries. It operates through the Real Estate Operations and Restaurant Operations segments. The Real Estate Operations segment consists of rental revenues generated by leasing restaurant properties. The Restaurant Operations segment comprises of Kerrow Restaurant operating business. The company was founded on July 2, 2015 and is headquartered in Mill Valley, CA.
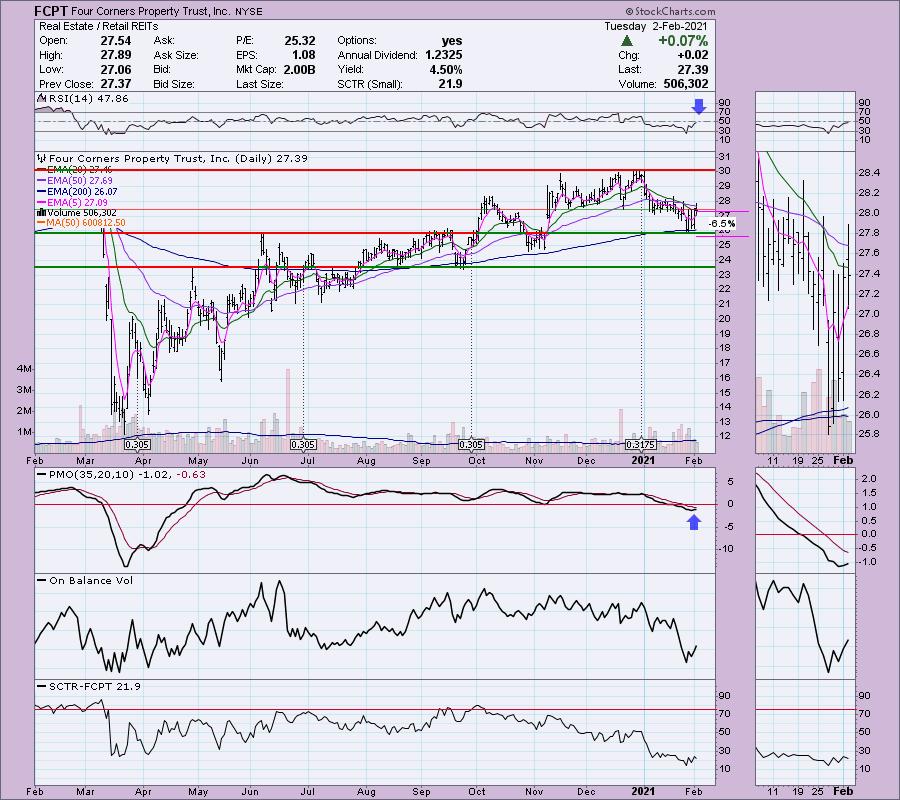
I concentrated on REITs last Wednesday. I still like the Real Estate sector (XLRE) as it is one of the few sectors with positive momentum on its side. Here is an interesting Retail REIT. FCPT bounced off the 200-EMA which also shares support with the June top and September tops. This area needs to hold (hence the stop level). The PMO has turned up and is rising and the RSI is just about in positive territory.
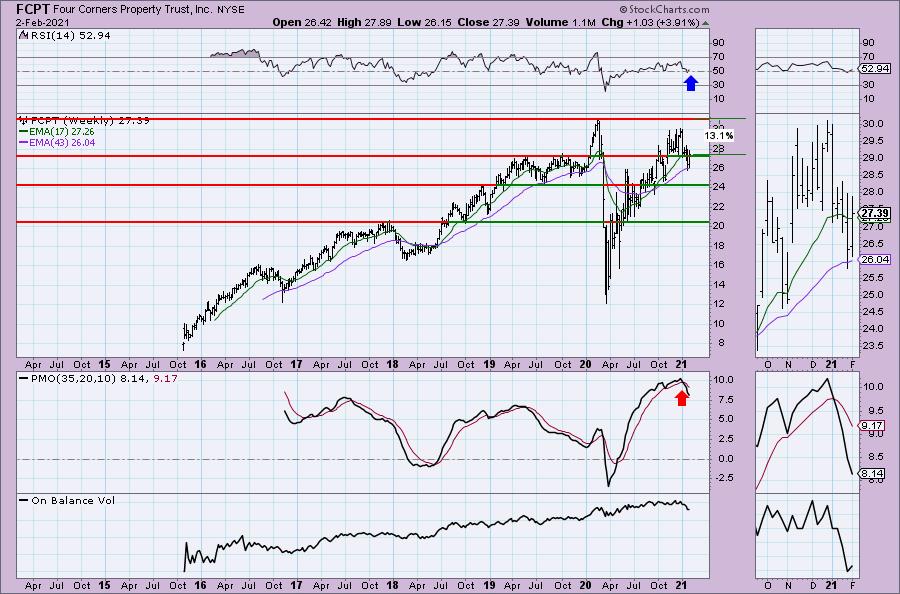
The weekly chart isn't that great with that PMO SELL signal coming in overbought territory. The 43-week EMA needs to hold. The RSI was able to stay in positive territory so that's a plus. Upside target is the 2020 bull market top.
Don't forget, on Thursdays I look at reader-requested symbols, so shoot me an email at erin@decisionpoint.com. I read every email I receive and try to answer them all!
Murphy USA Inc. (MUSA)
EARNINGS: 2/3/2021 (AMC)
Murphy USA, Inc. engages in the motor fuel products and convenience merchandise through retail stores, namely Murphy USA and Murphy Express. It provides Walmart discount program which offers a cents-off per gallon purchased for fuel when using specific payment methods. The company was founded on March 1, 2013 and is headquartered in El Dorado, AR.
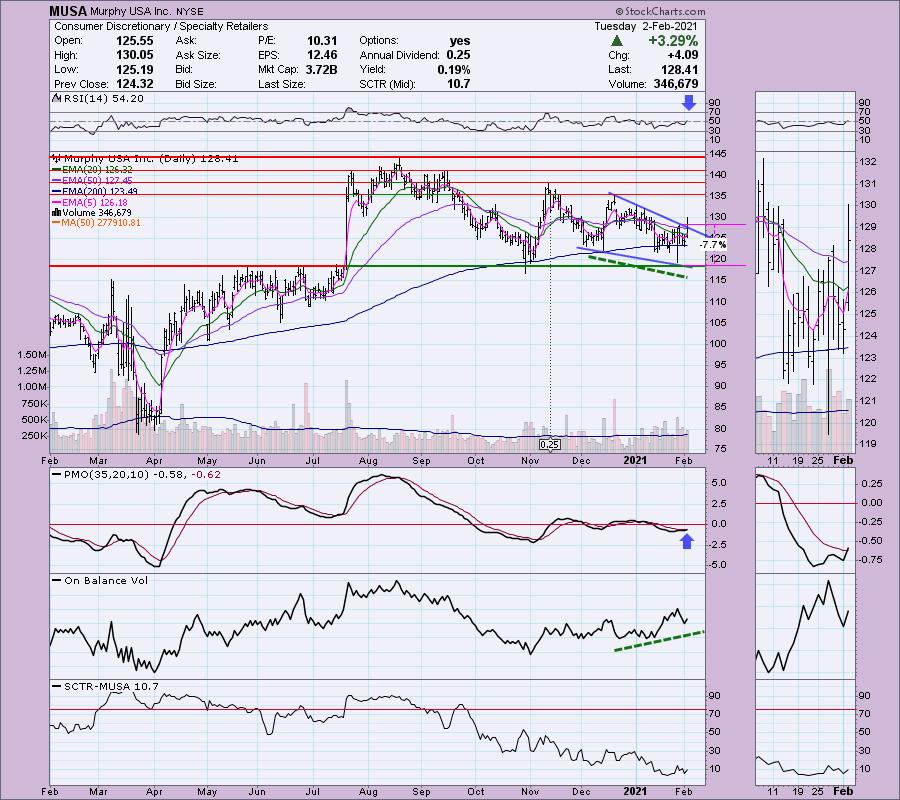
Please note that MUSA reports earnings tomorrow. That likely will skew the Recap this week if something big happens, but the chart is great and it needs to be on your radar regardless of what happens to my Friday spreadsheet. The PMO after topping below its signal line in oversold territory has now given us a positive crossover BUY signal. The RSI just moved into positive territory. We have a bullish falling wedge and a nice positive divergence with the OBV. The stop is set at very important support. If it loses that support, this is not a stock you want to be in.
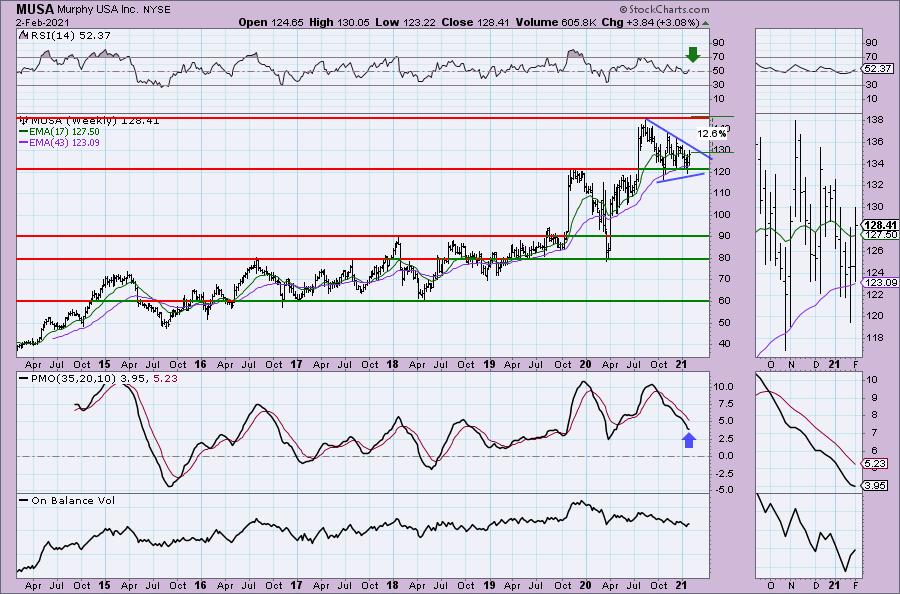
It appears that the weekly PMO is about turn back up in oversold territory. The RSI just reentered positive territory above net neutral (50). I have annotated a symmetrical triangle. The expectation is an upside breakout. A retracement to its all-time time is about 12.5% gain.
Poseida Therapeutics Inc. (PSTX)
EARNINGS: 3/25/2021 (AMC)
Poseida Therapeutics, Inc. is a clinical-stage biopharmaceutical company, which engages in the development of non-viral gene engineering technologies for the treatment of hematological malignancies and solid tumors. Its products pipeline include autologous and allogeneic chimeric antigen receptor T cell, or CAR-T. The company was founded by Eric M. Ostertag in 2014 and is headquartered in San Diego, CA.
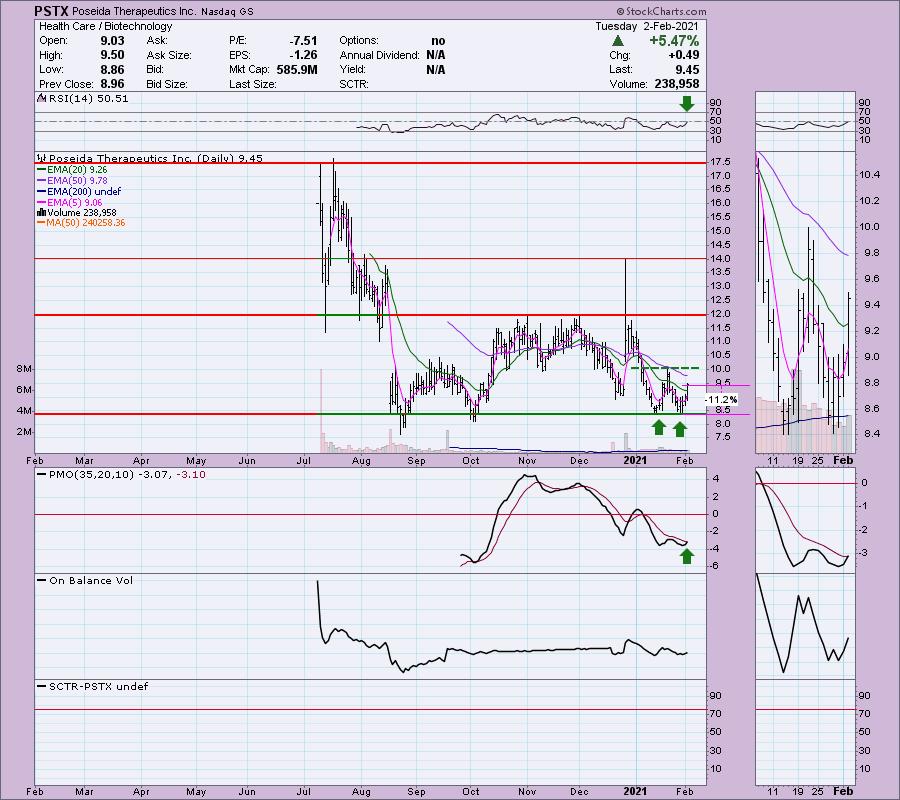
I had quite a few Biotechs hit my scan results today. This was my favorite set-up. The RSI has just turned positive. The PMO just triggered a crossover BUY signal. We have a double-bottom forming on important support. Looking in the thumbnail you can see a positive divergence with OBV rising bottoms and flat price bottoms. It's a deep stop, but it makes the most sense to set it just below the double-bottom.
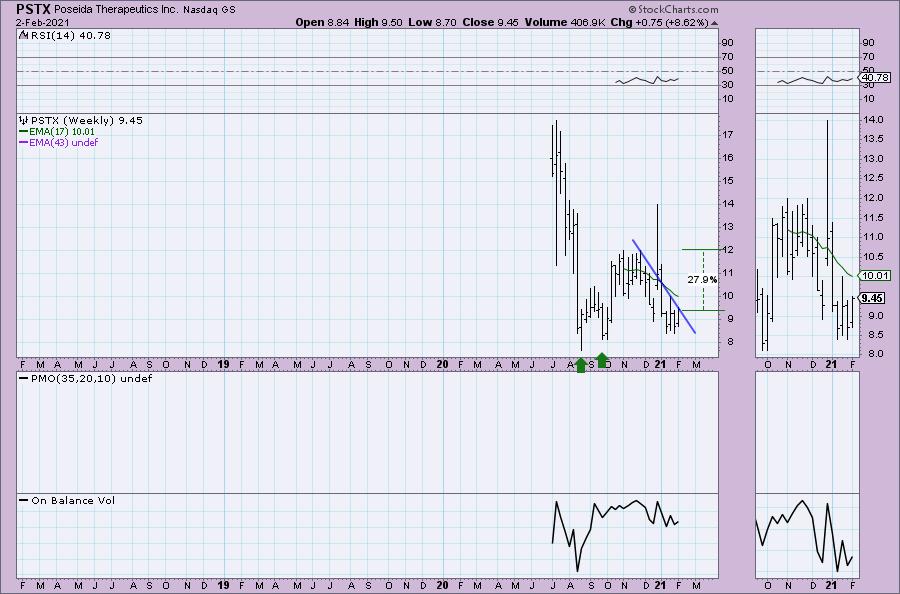
We don't have much info on the weekly chart. I would just note that the last double-bottom didn't amount to that much unless you count the late 2020 spike. We also see that price is in a longer-term declining trend. I think a conservative price target at $12 is reachable.
Full Disclosure: I'm about 80% invested and 20% is in 'cash', meaning in money markets and readily available to trade with. I held PFE into earnings and paid for it. My stop was hit almost immediately this morning. I have UNG so I won't be doing BOIL.
Current Market Outlook:
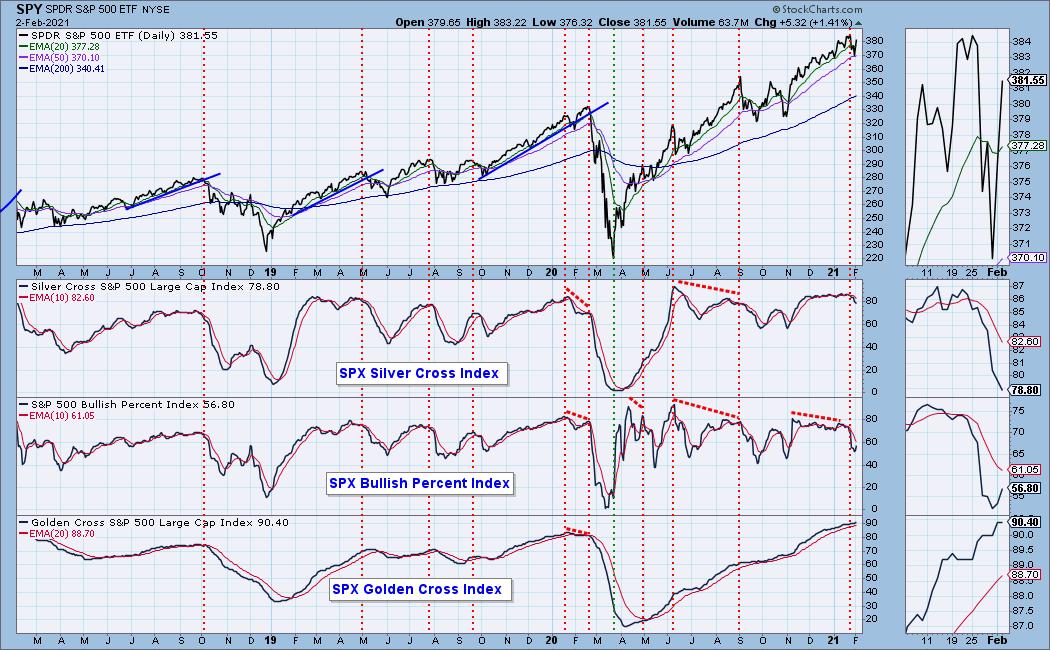
Market Environment: It is important to consider the odds for success by assessing the market tides. The following chart uses different methodologies for objectively showing the depth and trend of participation for intermediate- and long-term time frames.
- The Silver Cross Index (SCI) shows the percentage of SPX stocks on IT Trend Model BUY signals (20-EMA > 50-EMA)
- The Golden Cross Index (GCI) shows the percentage of SPX stocks on LT Trend Model BUY signals (50-EMA > 200-EMA)
- The Bullish Percent Index (BPI) shows the percentage of SPX stocks on Point & Figure BUY signals.
Don't forget that as a "Diamonds" member, you have access to our GCI/SCI curated ChartList on DecisionPoint.com. You'll find it under "Members Only" links on the left side on the Blogs and Links Page.
Here is the current chart:
Diamond Index:
- Diamond Scan Results: 4
- Diamond Dog Scan Results: 3
- Diamond Bull/Bear Ratio: 1.33
I'm in the process of trying to plot the Diamond Index, but with time at a premium, it is on the back burner.
Technical Analysis is a windsock, not a crystal ball.
Happy Charting!
- Erin
erin@decisionpoint.com
Watch the latest episode of DecisionPoint with Carl & Erin Swenlin on Mondays 7:00p EST or on the DecisionPoint playlist on the StockCharts TV YouTube channel here!
NOTE: The stocks reported herein are from mechanical trading model scans that are based upon moving average relationships, momentum and volume. DecisionPoint analysis is then applied to get five selections from the scans. The selections given should prompt readers to do a chart review using their own analysis process. This letter is not a call for a specific action to buy, sell or short any of the stocks provided. There are NO sure things or guaranteed returns on the daily selection of "diamonds in the rough."
Helpful DecisionPoint Links:
DecisionPoint Shared ChartList and DecisionPoint Chart Gallery
Price Momentum Oscillator (PMO)
Swenlin Trading Oscillators (STO-B and STO-V)
For more links, go to DecisionPoint.com!