
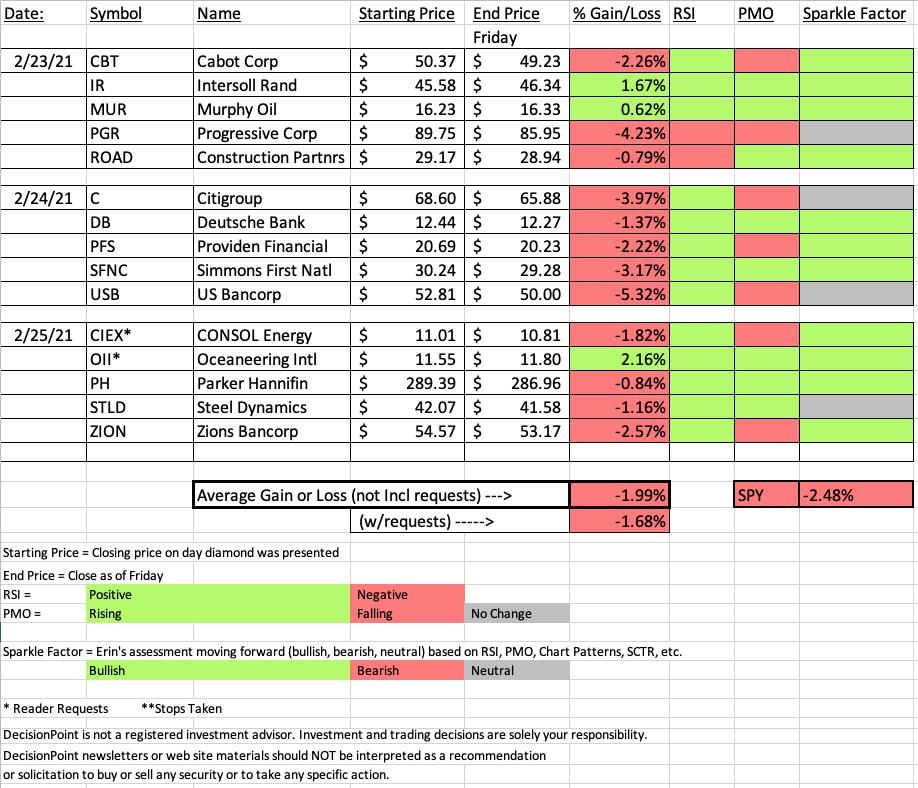
This week is an excellent example that "outperformance" doesn't always mean rising prices. This week we outperformed the SPY by 0.49%. Woo hoo! Oh, wait, we did beat the SPY this week, but we were also down on the week, only we weren't down as far as the SPY. Keep this in mind when you look at relative strength charts.
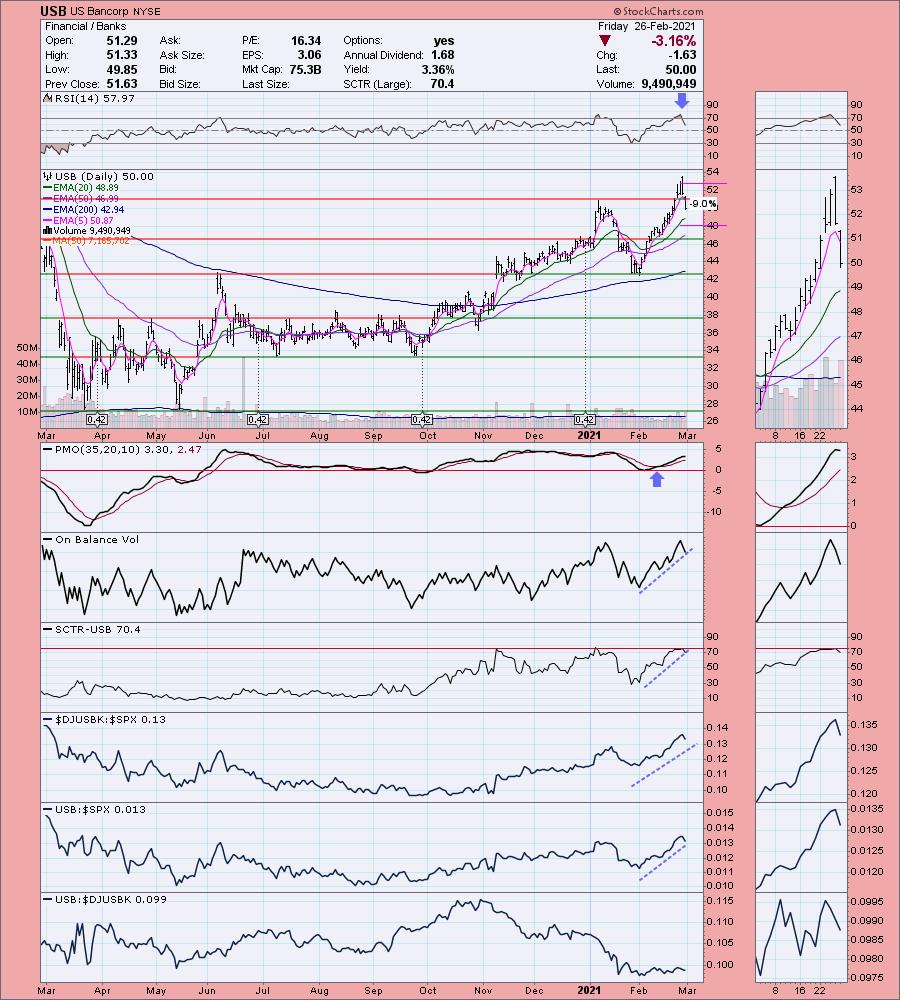
Banks decided to pullback and that definitely hurt our Wednesday numbers. I believe Banks are still bullish overall, but I know I'll be waiting before entering one as I suspect we may be able to get in at a better price point. Our worst performer was US Bancorp (USB).
Reader Request, Oceaneering Intl (OII) was this week's Darling. However, since it is a reader request, I'll look at my best performer which was Ingersoll Rand (IR).
Overall I didn't have any Sparkle Factors that were bearish. There were four neutrals which means it's up to you if you want to ride them out. The charts aren't bearish enough for a "sell", but they are not necessarily a "buy" either.
I'll cover my new favorite sector and show you a few industry groups to watch next week at the end of the report.
Diamond Mine Information:
RECORDING LINK:
Topic: DecisionPoint Diamond Mine (02/26/2021) LIVE Trading Room
Start Time : Feb 26, 2021 09:00 AM
Meeting Recording:
Access Passcode: Ft7Uq!&+
REGISTRATION:
When: Feb 26, 2021 09:00 AM Pacific Time (US and Canada)
Topic: DecisionPoint Diamond Mine (02/26/2021) LIVE Trading Room
Register in advance for this webinar:
https://zoom.us/webinar/register/WN_OFnLCP7ZShOerDECNrb-TA
Please do not share these links! They are for Diamonds subscribers ONLY!
Save the registration confirmation email with login instructions in case Zoom doesn't notify you in time.
FREE WEBINAR APPEARANCES NEXT WEEK!
I'll be presenting at three excellent online conferences next week. I would very much appreciate it if you would register for these events. I will post the third registration link when I get it. If you can't go a recording will be sent and every sign up that I receive adds 'gravitas'.

March 3rd, 2021 at 3:30p ET:
"It's All on the Chart"
- You don't have to make it hard!
- Step up your trading as Erin demonstrates how she uses her exclusive Price Momentum Oscillator and two other primary indicators to find the best trades and entries/exits for short-, intermediate- and long-term investors.
REGISTER HERE for the Traders Exclusive Webinar!
==============================================================================

MARCH 2nd, 2021 at 4:00p ET:
"Using Charts To Improve Your Trading Success"
- How To Identify Powerful Chart Patterns
- Ways To Calculate Upside and Downside Targets
- Top Signal To Know It's Time To Exit
- Best Way To Set Stops To Minimize Losses
REGISTER HERE for the Festival of Traders conference!
==============================================================================


3rd Annual Women Teach Trading and Investing (March 1-5) My Presentation on MARCH 3rd at Noon ET:
"Building Blocks of Technical Analysis"
- Everything you need to know to start using stock charting to improve your portfolio
- Support and Resistance, Overbought v. Oversold and Volume
- Basic Market and Stock indicators
- Trendlines and Chart Patterns
- Stops, Entries and Exits
REGISTER HERE for the TimingResearch.com and TradeOutLoud.com webinar event.
==============================================================================
A few items about the spreadsheet: I decided it only fair to denote "reader requests" as I shouldn't get to take credit if they turn out great! I've put on the spreadsheet whether the RSI is positive (green) or negative (red). The PMO column tells you if it is rising (green) or falling (red). Finally I've added my own "Sparkle Factor" that gives you my assessment going forward, bullish (green), bearish (red) or neutral (gray). The Sparkle Factor is basically my thoughts on whether I expect it to rise or fall. A neutral means it could really go either way so it could be added to a watch list. If you're in a stock I consider "neutral" going forward, the ball is in your court.
Free DecisionPoint Trading Room on Mondays, Noon ET

David Keller, CMT, Chief Technical Analyst at StockCharts.com will be joining Erin in the free DP Trading Room on March 1st! Dave will give us his take on the market and share his trading methodologies as both of us discuss your symbol requests.

David Keller, CMT is Chief Market Strategist at StockCharts.com, where he helps investors minimize behavioral biases through technical analysis. He is a frequent host on StockCharts TV, and he relates mindfulness techniques to investor decision making in his blog, The Mindful Investor. David is also President and Chief Strategist at Sierra Alpha Research LLC, a boutique investment research firm focused on managing risk through market awareness. He combines the strengths of technical analysis, behavioral finance, and data visualization to identify investment opportunities and enrich relationships between advisors and clients.
*Click here to register for this recurring free DecisionPoint Trading Room on Mondays at Noon ET!*
=======================================
BELOW is a link to Monday's recording:
Topic: DecisionPoint Trading Room
Start Time : Feb 16, 2021
Meeting Recording:
https://zoom.us/rec/share/G4hnZKpDiDxpK3jFBaao-qVqCJWjEgJNyWn9lueufB-sO-iomygo7tot1vaFKbu7.6013TODA9_Zlb0Jc
Access Passcode: i^96E7mf
For best results, copy and paste the access code to avoid typos.
Darling:
Ingersoll Rand Inc (IR)
EARNINGS: 5/10/2021 (AMC)
Ingersoll Rand, Inc. provides a broad range of mission critical air, fluid, energy, specialty vehicle and medical technologies, providing services and solutions to increase industrial productivity and efficiency. It operates through the following segments: Industrial Technologies and Services, Precision and Science Technologies, High Pressure Solutions, and Specialty Vehicle Technologies. The Industrial Technologies and Services segment designs, manufactures, markets and services a range of compression and vacuum equipment as well as fluid transfer equipment, loading systems, power tools and lifting equipment. The Precision and Science Technologies segment involves in designing, manufacturing and marketing a range of positive displacement pumps, fluid management equipment and aftermarket parts for medical, laboratory, industrial manufacturing, water and wastewater, chemical processing, energy, food and beverage, agriculture and other markets. The High Pressure Solutions segment includes designing, manufacturing and marketing a diverse range of positive displacement pumps, integrated systems and associated aftermarket parts, consumables and services. The Specialty Vehicle Technologies segment focuses in designing, manufacturing and marketing Club Car golf, utility and consumer low-speed vehicles. The company was founded in 1872 and is headquartered in Davidson, NC.
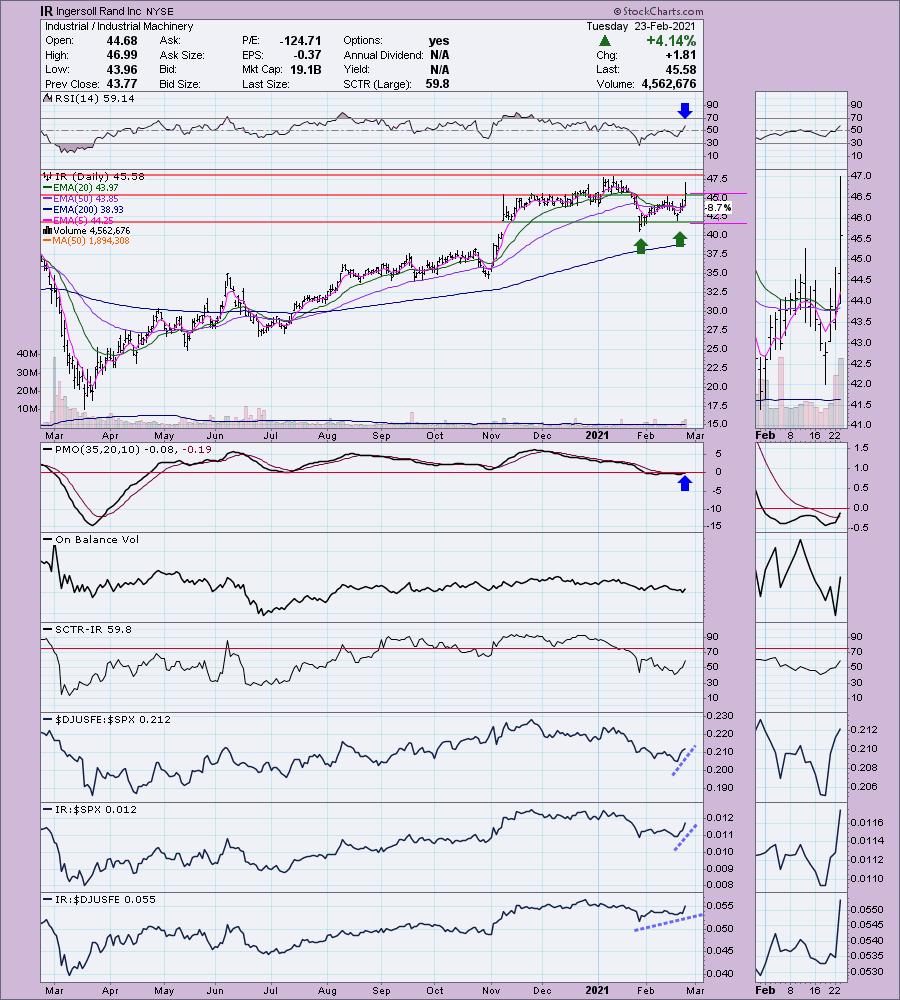
Here is the commentary and chart from Tuesday:
"IR is unchanged in after hours trading. Today it popped on earnings. It settled back down above the confirmation line of the double-bottom pattern The PMO just triggered a crossover BUY signal and the RSI has reached positive territory. This group is beginning to outperform and IR seems a strong candidate as its performance is improving against the SPX and its industry group."
Here is today's chart:
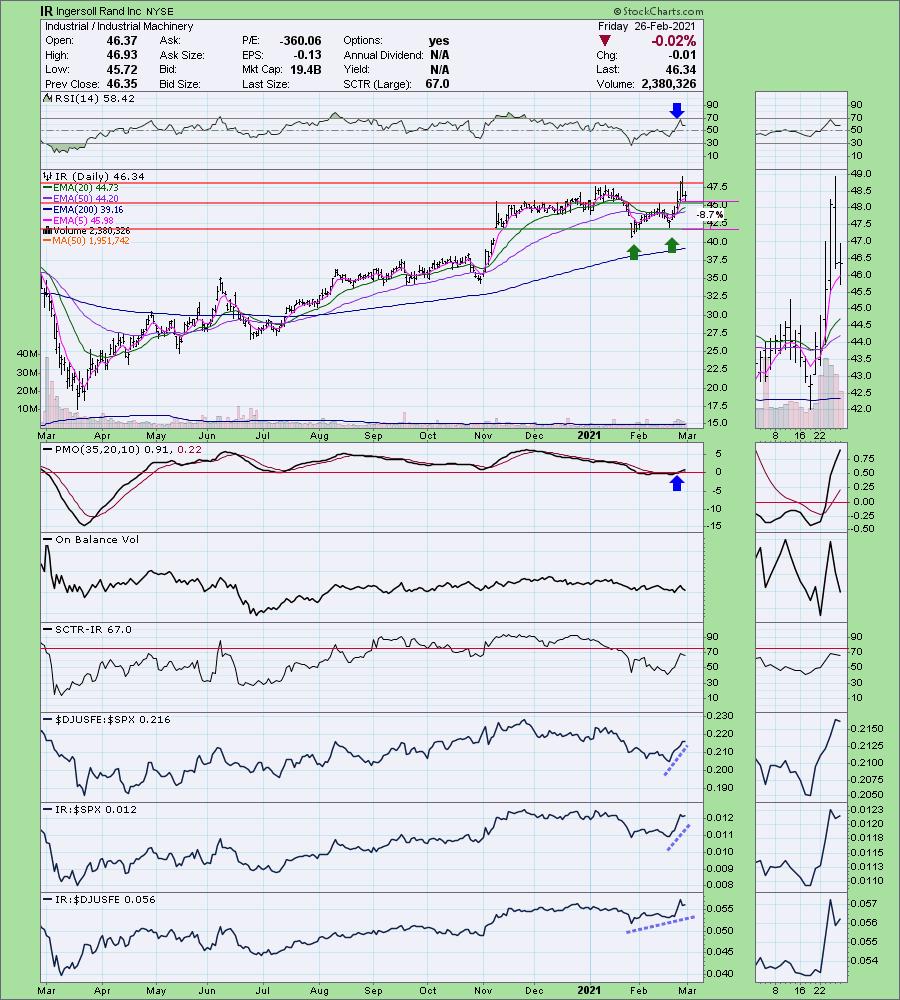
We had a failed breakout on this week's Darling. However, the PMO and RSI were not damaged. In fact, price is still above support. This is my "sleeper" sector and one of the "sleeper" industry groups that should continue to outperform the market. This one actually has become far more attractive on the pullback.
Don't forget, on Thursdays I look at reader-requested symbols, so shoot me an email at erin@decisionpoint.com. I read every email I receive and try to answer them all!
Dud:
US Bancorp (USB)
EARNINGS: 4/15/2021 (BMO)
U.S. Bancorp operates as a bank holding company. It offers financial services, including lending and depository services, cash management, foreign exchange and trust and investment management. The firm also offers mortgage, refinance, auto, boat & RV loans, credit lines, credit card services, merchant, bank, checking & savings accounts, debit cards, online & mobile banking, ATM processing, mortgage banking, insurance, brokerage and leasing services. The company was founded in 1929 and is headquartered in Minneapolis, MN.
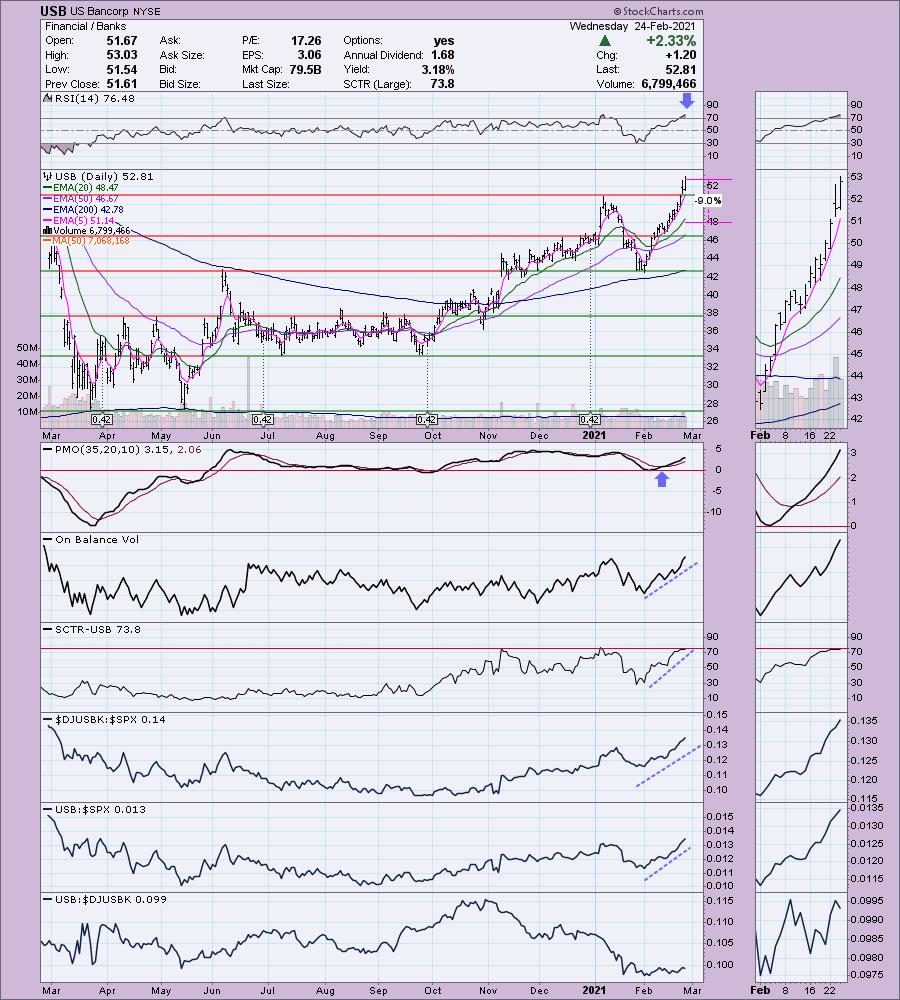
Here is the commentary and chart from Wednesday:
"USB is unchanged in after hours trading. Like most of the Banks, USB has an overbought RSI. The outperformance against the SPX is impressive even if it is an average performer in this industry group. The PMO is on a BUY signal and really isn't overbought yet as it appears a PMO reading of +5 is the top of the its range. The SCTR is rising and is close to the hot zone above 75. We are a little late on this "V" bottom pattern, but I would look for more outperformance. The stop is set below the 20-EMA"
Below is today's chart:
FYI last week's "DUD", Mosaic (MOS), was up +1.10% this week. Sometimes they need more time to marinate. USB broke out and today collapsed, putting price back below support. The RSI is still positive, but the PMO ticked lower. I marked this one as "neutral" for the Sparkle Factor as it could find support at the 20-EMA. This area of the market was highly overbought (one of the reasons I usually avoid presenting stocks with overbought RSIs) and needed a pullback. I expect this area of the market to continue to outperform given yields and interest rates are moving higher. That generally helps the Banks and other Financial sector stocks.
THIS WEEK's Sector Performance:
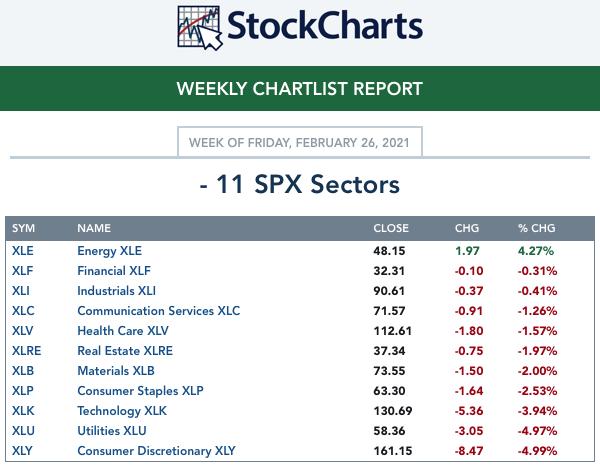
Click Here to view Carl's annotated Sector ChartList!
CONCLUSION:
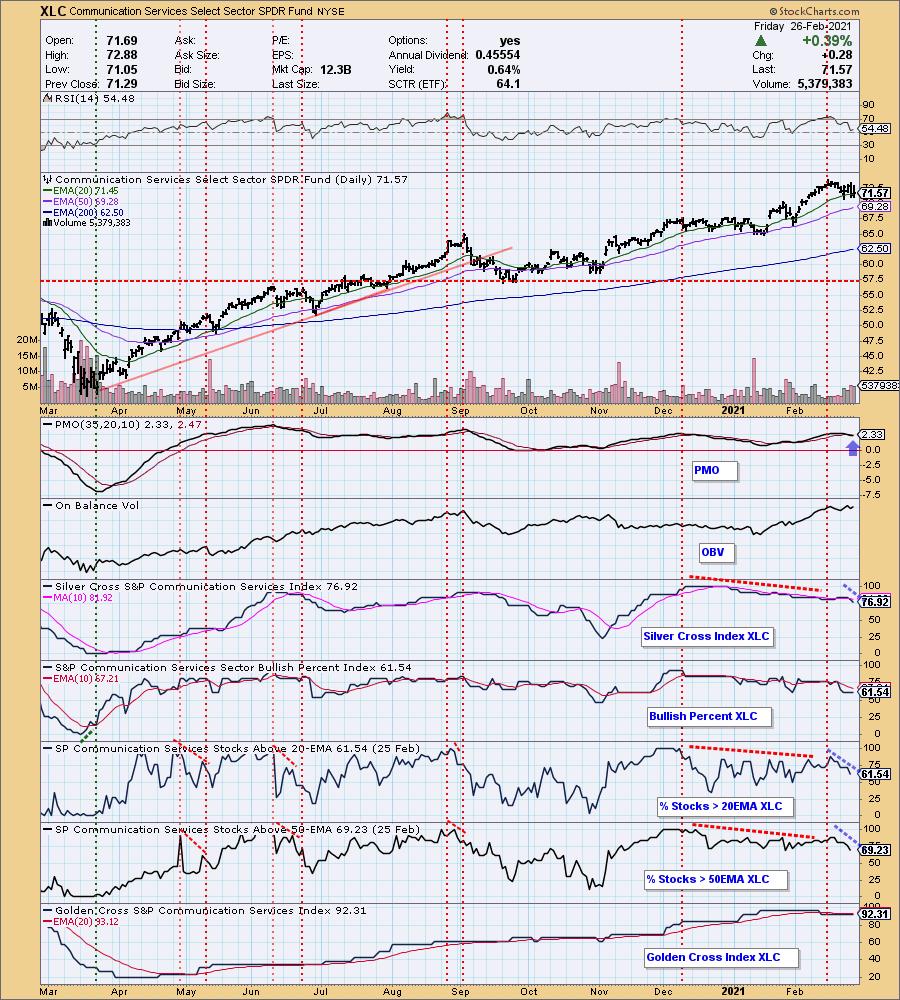
I've been hearing from the grapevine that Communication Services (XLC) is going to be the new outperformer. While it could turn out that way, all of my analysis says 'no'. I recommend you take a look at our Sector ChartList on the website and review all of the sectors. Below is XLC. Notice the decline in participation? There is also a PMO SELL signal on tap. XLC under the hood has indicators that are not flashing bullish.
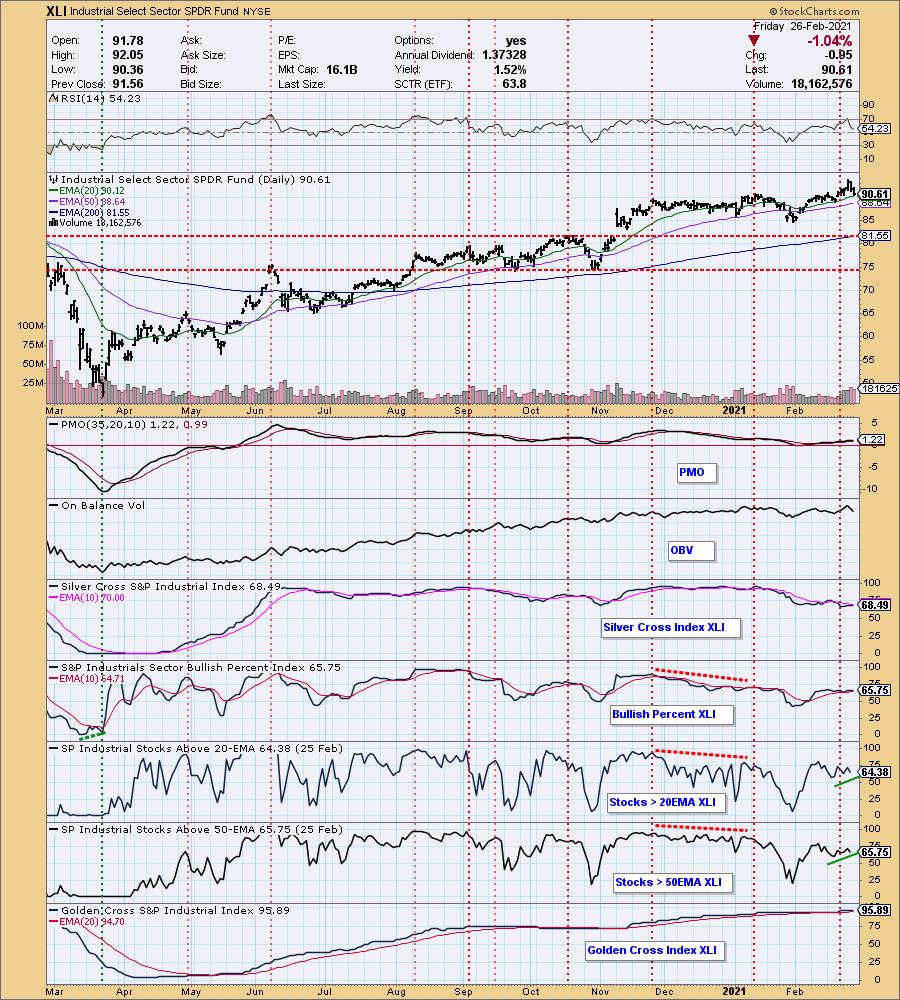
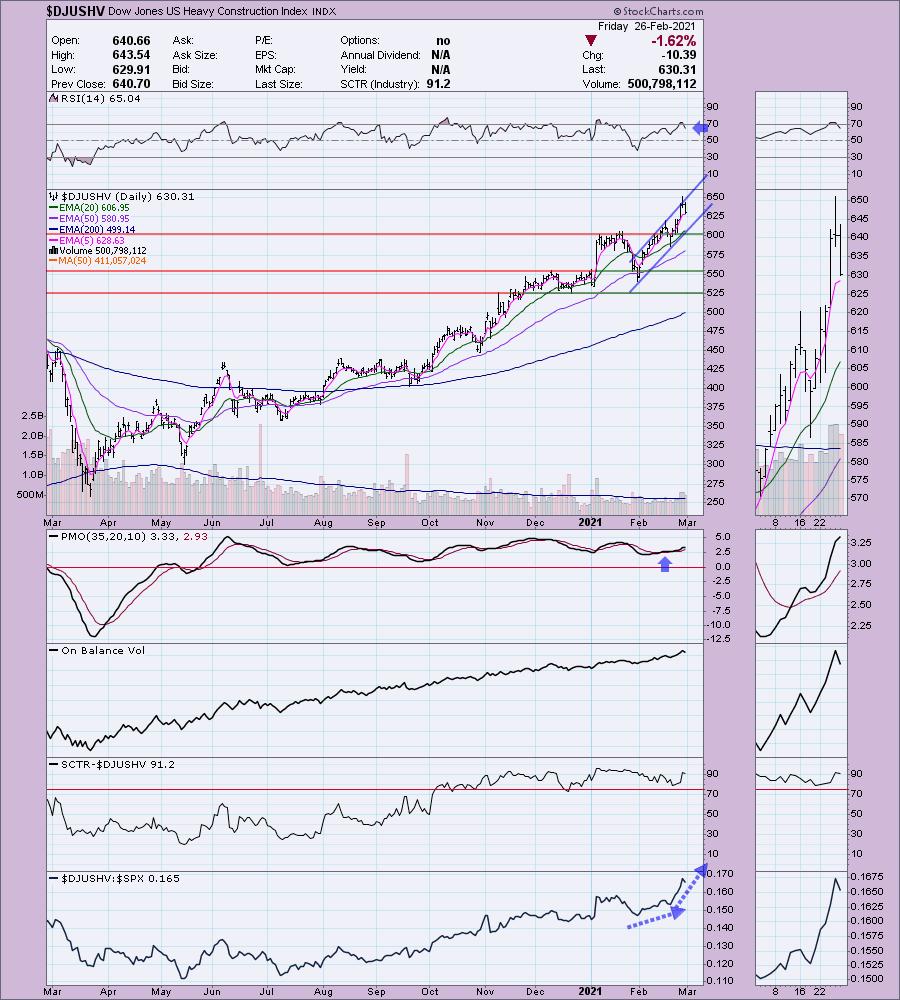
XLB has been my 'darling' sector. It is nearly reaching the "Leading" category. However, I see more promise in the three that our leading right now in the short term, XLE, XLF and XLI. My preference of the three is XLI. A new infrastructure bill is being discussed. We saw how stimulus helped the Financial sector; I am looking for Construction and Machinery areas of XLI to outperform when an infrastructure bill is introduced. Additionally, within Materials, Concrete might be a place to consider. Steel is still outperforming and I expect that to continue too.
In closing, I would recommend treading lightly. Any new positions I open will replace current positions to expose me to the more successful areas of the market. However, I'll be placing hard stops, not mental ones when I open any new positions (if I open new ones!). Just be careful out there!
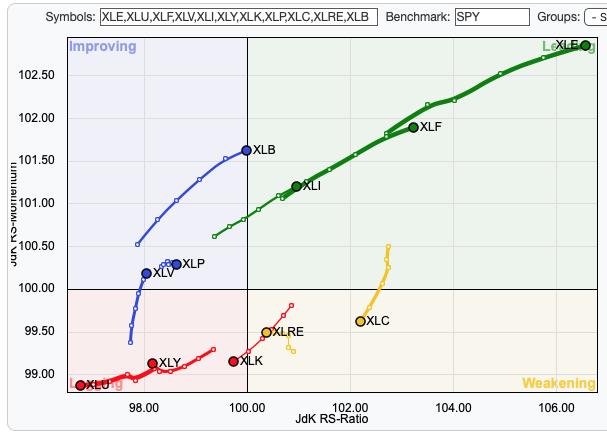
Sector to Watch: Industrials (XLI)
Last week it was a tie between XLB and XLI. I selected XLB. This week I'm going with XLI given the indicators are still healthy and not overbought.
Industry Group to Watch: Heavy Construction ($DJUSAR)
I like this area of the market as noted above. This group is in a strong rising trend. It does appear to be pulling back and it certainly can move lower and remain in this rising trend channel. That's why I say group to "watch". I like PH which was my diamond in the rough yesterday.
Go to our Sector ChartList on DecisionPoint.com to get an in depth view of all the sectors.
Technical Analysis is a windsock, not a crystal ball.
Have a great weekend & Happy Charting!
- Erin
erin@decisionpoint.com
Full Disclosure: I'm about 80% invested right now and 20% is in 'cash', meaning in money markets and readily available to trade with. I will not be adding to my portfolio unless stocks within the defensive sectors are looking positive enough to swap out a more aggressive position for a more defensive position.
Watch the latest episode of DecisionPoint with Carl & Erin Swenlin on Mondays 7:00p EST or on the DecisionPoint playlist on the StockCharts TV YouTube channel here!
NOTE: The stocks reported herein are from mechanical trading model scans that are based upon moving average relationships, momentum and volume. DecisionPoint analysis is then applied to get five selections from the scans. The selections given should prompt readers to do a chart review using their own analysis process. This letter is not a call for a specific action to buy, sell or short any of the stocks provided. There are NO sure things or guaranteed returns on the daily selection of "diamonds in the rough."
Helpful DecisionPoint Links:
DecisionPoint Shared ChartList and DecisionPoint Chart Gallery
Price Momentum Oscillator (PMO)
Swenlin Trading Oscillators (STO-B and STO-V)
