
We have some very interesting Reader Requested symbols today. After today's market pullback, many stocks that had been overbought, pulled back. A few offer some very interesting entries. The stock I picked for you is an Industrial from the Industrial Machinery industry group. The group itself has begun to outperform significantly and I found an outperformer within the group.
Tomorrow morning is the Diamond Mine trading room! You'll find the registration links in today's blog.
I have one more free webinar appearance to add to my list of two already for next week! You'll find the new addition for Traders Exclusive Webinar below. I'll be reprising my YouTube presentation: "It's All on the Chart!". I'll actually be adding the relative performance measures to the webinar so you can understand exactly why I've included them. I'll be talking about entries and exits using 5-minute candlesticks and discussing how to use these indicators in all timeframes. As always I would very much appreciate your support by registering. If you can't go the recording will be sent to you and I get "credit" for bringing in each registration. Your help is appreciated!
Today's "Diamonds in the Rough" are: CEIX, OII, PH, STLD and ZION (bonus: NUE)
FREE WEBINAR APPEARANCES NEXT WEEK!
I'll be presenting at three excellent online conferences next week. I would very much appreciate it if you would register for these events. I will post the third registration link when I get it. If you can't go a recording will be sent and every sign up that I receive adds 'gravitas'.

March 3rd, 2021 at 3:30p ET:
"It's All on the Chart"
- You don't have to make it hard!
- Step up your trading as Erin demonstrates how she uses her exclusive Price Momentum Oscillator and two other primary indicators to find the best trades and entries/exits for short-, intermediate- and long-term investors.
REGISTER HERE for the Traders Exclusive Webinar!
==============================================================================

MARCH 2nd, 2021 at 4:00p ET:
"Using Charts To Improve Your Trading Success"
- How To Identify Powerful Chart Patterns
- Ways To Calculate Upside and Downside Targets
- Top Signal To Know It's Time To Exit
- Best Way To Set Stops To Minimize Losses
REGISTER HERE for the Festival of Traders conference!
==============================================================================


3rd Annual Women Teach Trading and Investing (March 1-5) My Presentation on MARCH 3rd at Noon ET:
"Building Blocks of Technical Analysis"
- Everything you need to know to start using stock charting to improve your portfolio
- Support and Resistance, Overbought v. Oversold and Volume
- Basic Market and Stock indicators
- Trendlines and Chart Patterns
- Stops, Entries and Exits
REGISTER HERE for the TimingResearch.com and TradeOutLoud.com webinar event.
==============================================================================
 Diamond Mine Registration Information:
When: Feb 26, 2021 09:00 AM Pacific Time (US and Canada)
Topic: DecisionPoint Diamond Mine (02/26/2021) LIVE Trading Room
Register in advance for this webinar:
https://zoom.us/webinar/register/WN_MeUlJ9HZRCStunv7yK5-LA
After registering, you will receive a confirmation email containing information about joining the webinar, including the password.
=======================================================================
Recording Link:
Topic: DecisionPoint Diamond Mine (2/19/2021) LIVE Trading Room
Start Time : Feb 19, 2021 08:50 AM
Meeting Recording:
Access Passcode: v^9Yi2.c
David Keller, CMT, Chief Technical Analyst at StockCharts.com will be joining me in the free DP Trading Room on March 1st! Dave will give us his take on the market and share his trading methodologies as both of us discuss your symbol requests.

David Keller, CMT is Chief Market Strategist at StockCharts.com, where he helps investors minimize behavioral biases through technical analysis. He is a frequent host on StockCharts TV, and he relates mindfulness techniques to investor decision making in his blog, The Mindful Investor. David is also President and Chief Strategist at Sierra Alpha Research LLC, a boutique investment research firm focused on managing risk through market awareness. He combines the strengths of technical analysis, behavioral finance, and data visualization to identify investment opportunities and enrich relationships between advisors and clients.
***Click here to register for this recurring free DecisionPoint Trading Room on Mondays at Noon ET!***
+++++++++++++++++++++++++++++++++++++++++++++++++++++++++++++++++++++++++++++++
Here is the information for the Monday 2/22/2021 recording:
Topic: DecisionPoint Trading Room
Start Time : Feb 22, 2021 08:57 AM
Meeting Recording:
Access Passcode: L%tC6D47
For best results, copy and paste the access code to avoid typos.
Welcome to DecisionPoint Daily Diamonds, wherein I highlight five "diamonds in the rough." These are selected from the results of my DecisionPoint scans, which search for stocks that could benefit from the trend and condition of the market. Remember, these are not recommendations to buy or sell, but are the most interesting of the stocks that surfaced in my scans. My objective is to save you the work of the initial, tedious culling process, but you need to apply your own analysis to see if these stocks pique your interest as well. There are no guaranteed winners here!
CONSOL Energy Inc. (CEIX)
EARNINGS: 5/10/2021 (BMO)
CONSOL Energy Inc. engages in the production of bituminous coal. It focuses on the extraction and preparation of coal in the Appalachian basin. It operates through Pennsylvania Mining Complex segment, which consists of mining, preparation, and marketing of thermal coal, sold primarily to power generators. The company operates through the following segments: PAMC and CONSOL Marine Terminal. The PAMC segment includes mining, preparation and marketing of thermal coal. The CONSOL Marine Terminal segment provides coal export terminal services. CONSOL Energy was founded in 1864 and is headquartered in Canonsburg, PA.
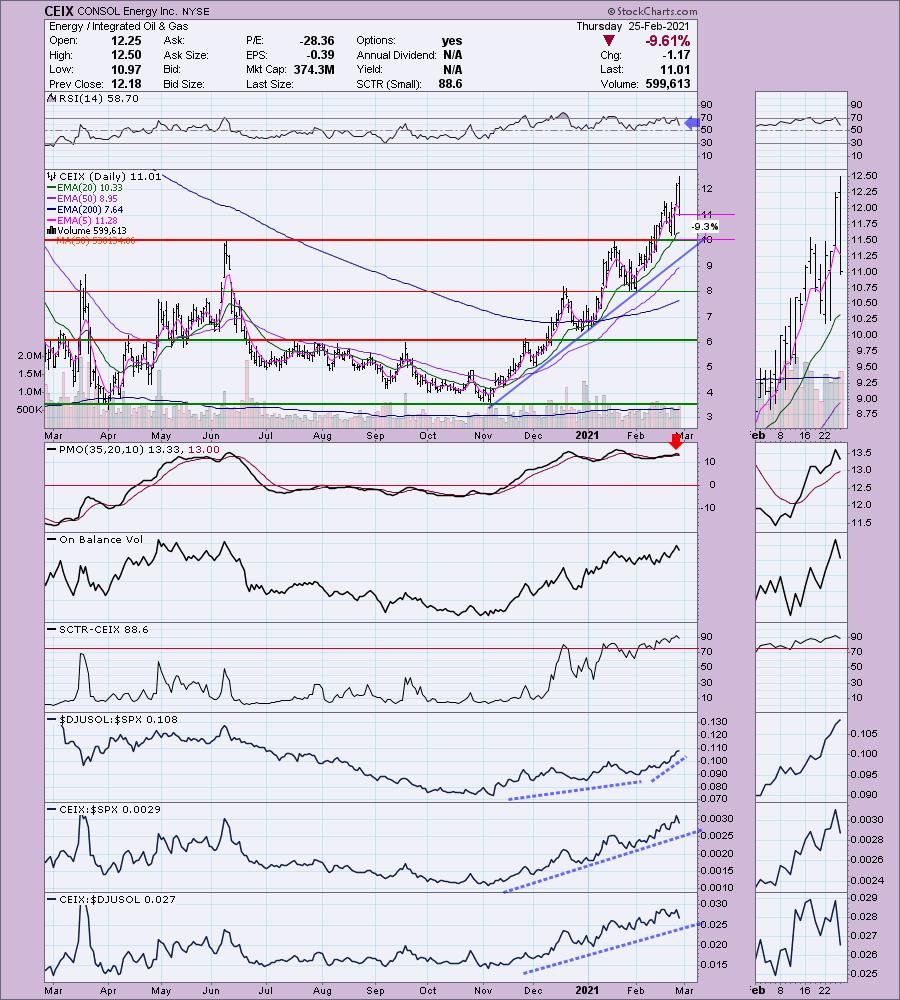
Reader Request #1: CIEX is up +4.18% in after hours trading. Today's large pullback has made this stock more tasty. With the price of crude oil flying higher, this industry group has been enjoying significant outperformance--performance that is increasing against the SPX. CIEX has been a strong performer within the group. We do see that the PMO tipped over, but with that large decline, it almost had no choice. The RSI is no longer overbought. The OBV is confirming the rally and its SCTR moved into the "hot zone" above 75 this month.
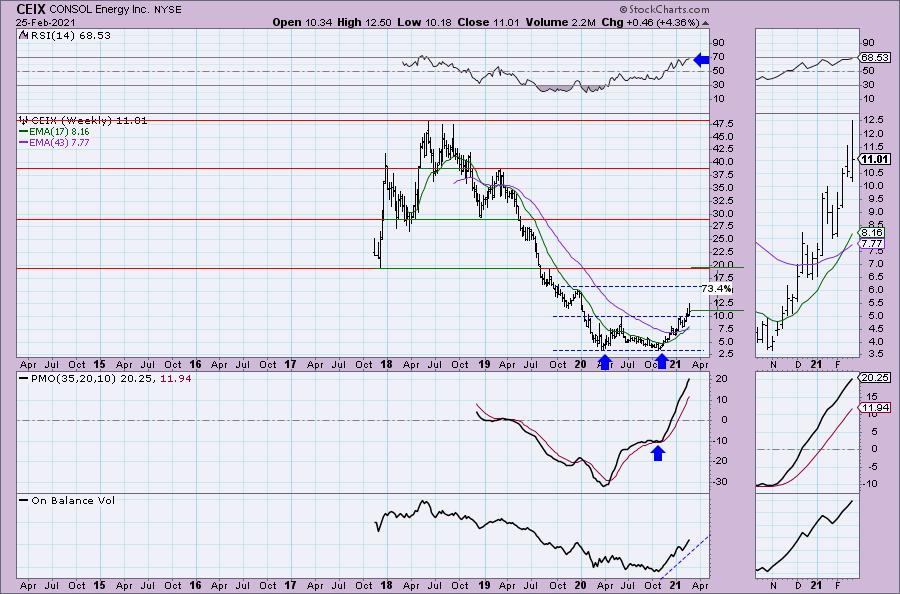
The weekly chart is great. The PMO is rising strongly and the RSI is positive. Best of all it has a double-bottom that just executed last week with the breakout. Currently we are seeing follow-through. The minimum upside target of the pattern would take it to overhead resistance at the end of December top. Note that I said "minimum" upside target. I am looking for a move back toward it opening price in 2017.
Oceaneering Intl, Inc. (OII)
EARNINGS: 5/10/2021 (AMC)
Oceaneering International, Inc. engages in the provision of engineered services and products. It operates through the following business segments: Remotely Operated Vehicles, Subsea Products, Subsea Projects, and Asset Integrity. The Remotely Operated Vehicles segment provides submersible vehicles operated from the surface to support offshore energy exploration, development and production activities. The Subsea Products segment supplies a variety of specialty subsea hardware and related services. The Subsea Projects segment provides multiservice subsea support vessels and oilfield diving and support vessel operations, primarily for inspection, maintenance and repair and installation activities. The Asset Integrity segment refers to the asset integrity management and assessment services and nondestructive testing and inspection. The company was founded in 1969 and is headquartered in Houston, TX.
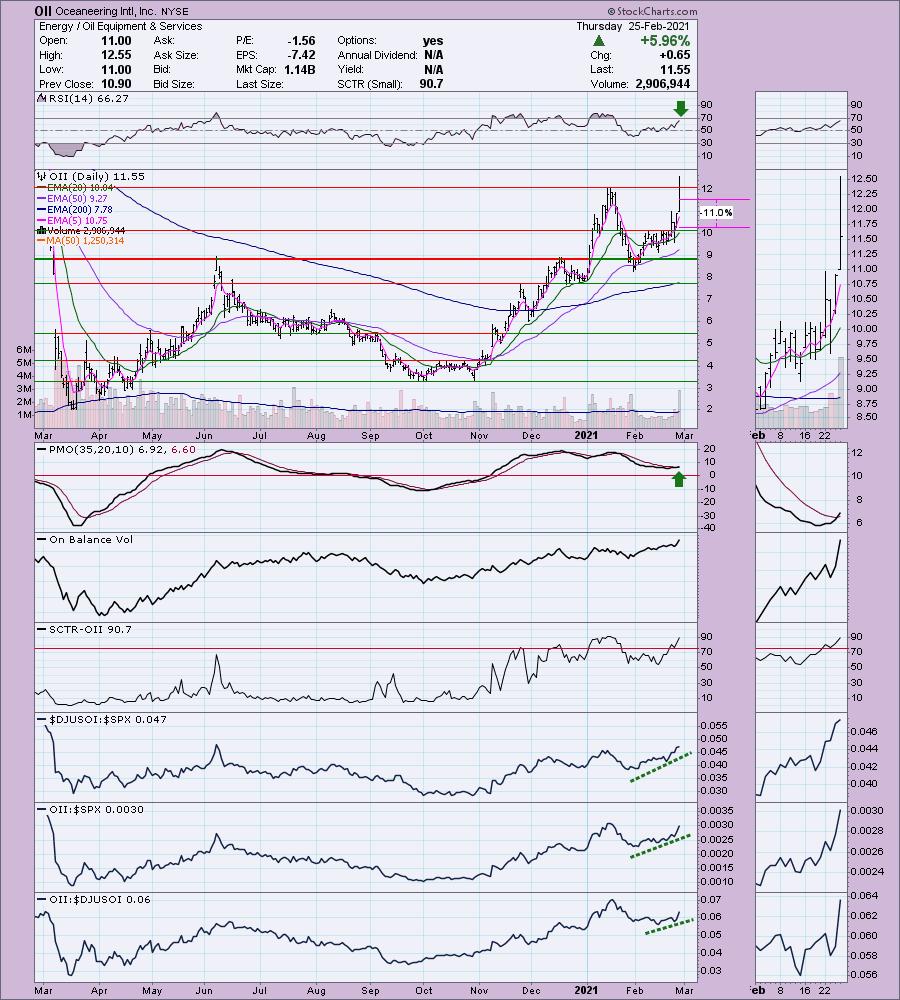
Reader Request #2: OII is up +0.52% in after hours trading. The PMO just triggered a BUY signal. Today's intraday high popped above overhead resistance at the January high. The RSI is positive and not overbought. This industry group is outperforming the SPX and OII is outperforming them both. The SCTR is above 75 and the rising bottoms on the OBV are confirming the rally. I've set a deep stop which is just above current support.
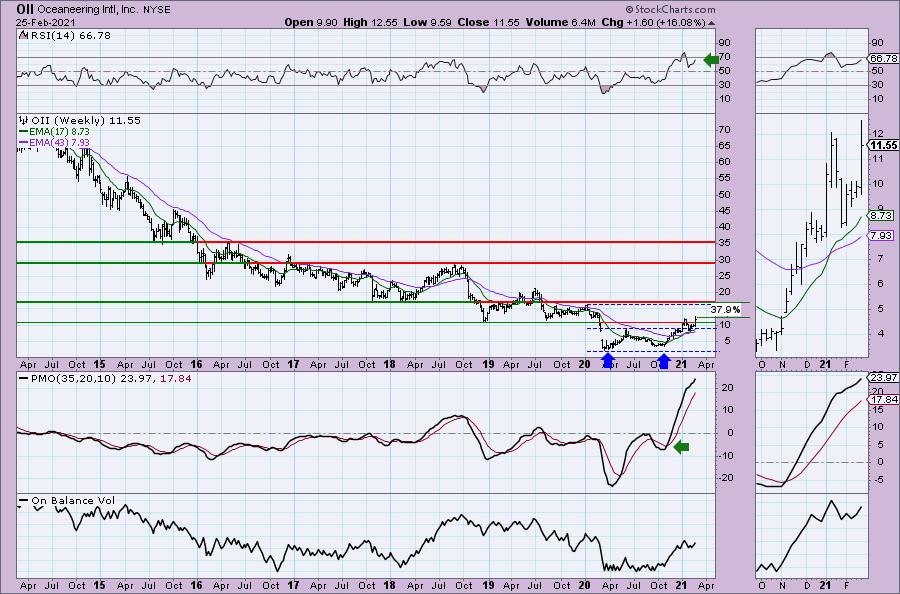
We have another bullish double-bottom pattern on a weekly chart. It did fail the last time when it broke out, but it immediately found support on the EMAs and broke out again above the confirmation line. The weekly PMO is rising, albeit overbought. The RSI is positive and not overbought. The minimum upside target of the pattern puts price right below overhead resistance at the early 2018 low and the 2020 high.
Parker Hannifin Corp. (PH)
EARNINGS: 4/29/2021 (BMO)
Parker-Hannifin Corp. engages in the manufacture of motion and control technologies and systems. The firm also provides engineered solutions for mobile, industrial, and aerospace markets. It operates through the following segments: Diversified Industrial and Aerospace Systems. The Diversified Industrial segment offers products to original equipment manufacturers. The Aerospace Systems segment supplies aftermarket services, commercial transports, engines, helicopters, military aircraft, missiles, and unmanned aerial vehicles. The company was founded by Arthur L. Parker in 1918 and is headquartered in Cleveland, OH.
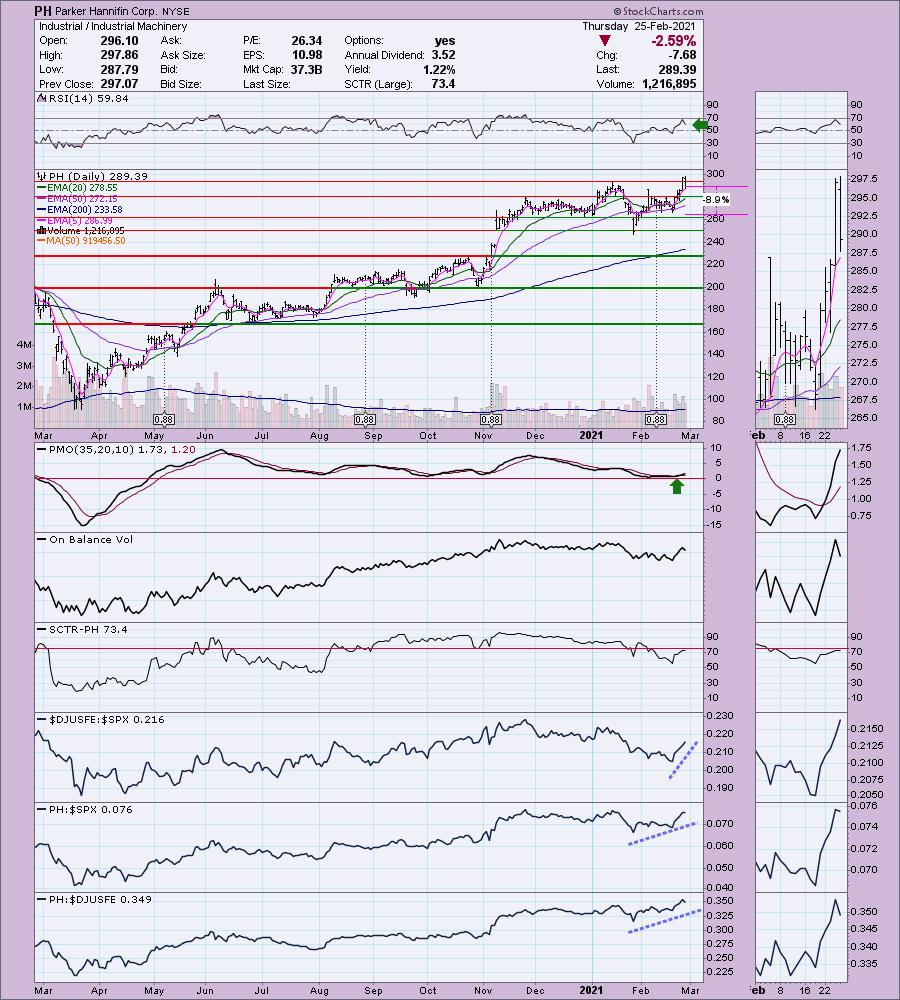
My pick today: PH is unchanged in after hours trading. I like yesterday's breakout and I also like today's pullback. The PMO is rising strongly on a new crossover BUY signal. The RSI is positive and with today's decline it isn't overbought anymore. It is outperforming in every way. Industrials appear to be doing well, but they have been outshined by recovery stocks and banks. The stop is set at support at the February lows.
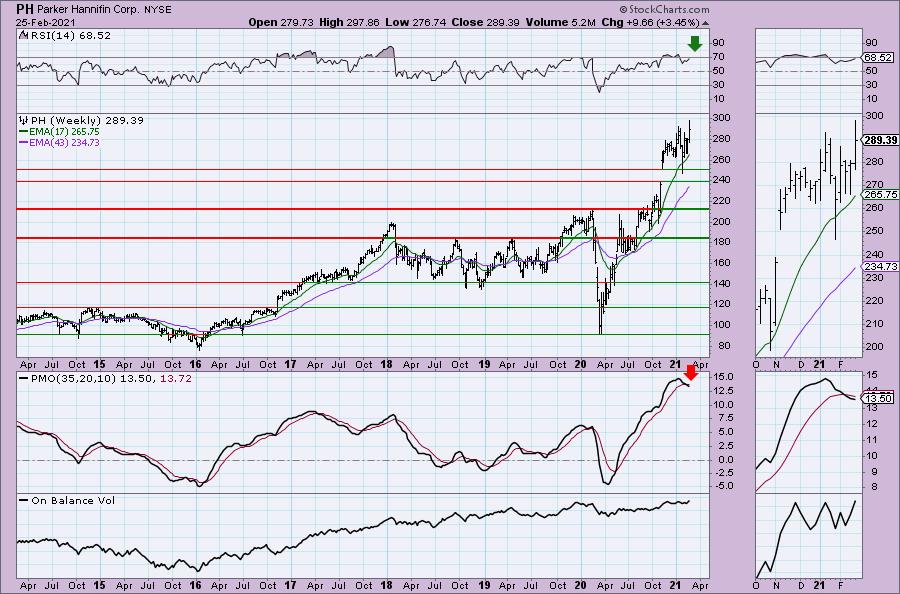
This could be a short-term trade given the weekly PMO has turned over. However with this week's breakout the PMO is already bottoming. The OBV is confirming the move and the RSI is positive.
Don't forget, on Thursdays I look at reader-requested symbols, so shoot me an email at erin@decisionpoint.com. I read every email I receive and try to answer them all!
Steel Dynamics, Inc. (STLD)
EARNINGS: 4/19/2021 (AMC)
Steel Dynamics, Inc. engages in the manufacture of steel products and metal recycling. It operates through the following segments: Steel Operations, Metals Recycling Operations, Steel Fabrication Operations, and Other. The Steel Operations segment consists of sheet products including hot roll, cold roll, and coated steel; long products including structural steel beams, pilings, and standard and premium grade rail; and steel finishing services such as turning, polishing, straightening, chamfering, threading, and precision saw-cutting. The Metals Recycling Operations segment provides an array of both ferrous and non-ferrous scrap recycling, scrap management, transportation, and brokerage products and services. The Steel Fabrication Operations segment offers steel joists, girders, and steel deck, including specialty deck. The Other segment comprises of subsidiary operations and certain unallocated corporate accounts. The company was founded by Keith E. Busse, Mark D. Millett, Richard P. Teets and John C. Bates in August 1993 and is headquartered in Fort Wayne, IN.
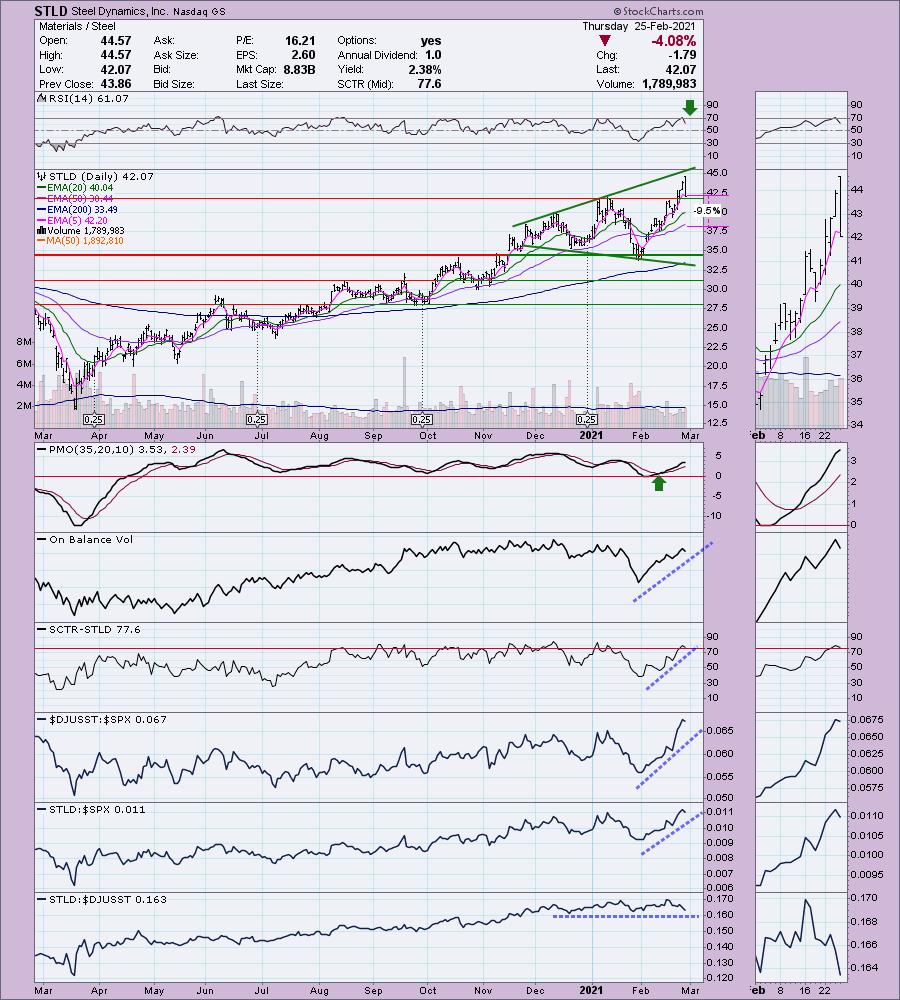
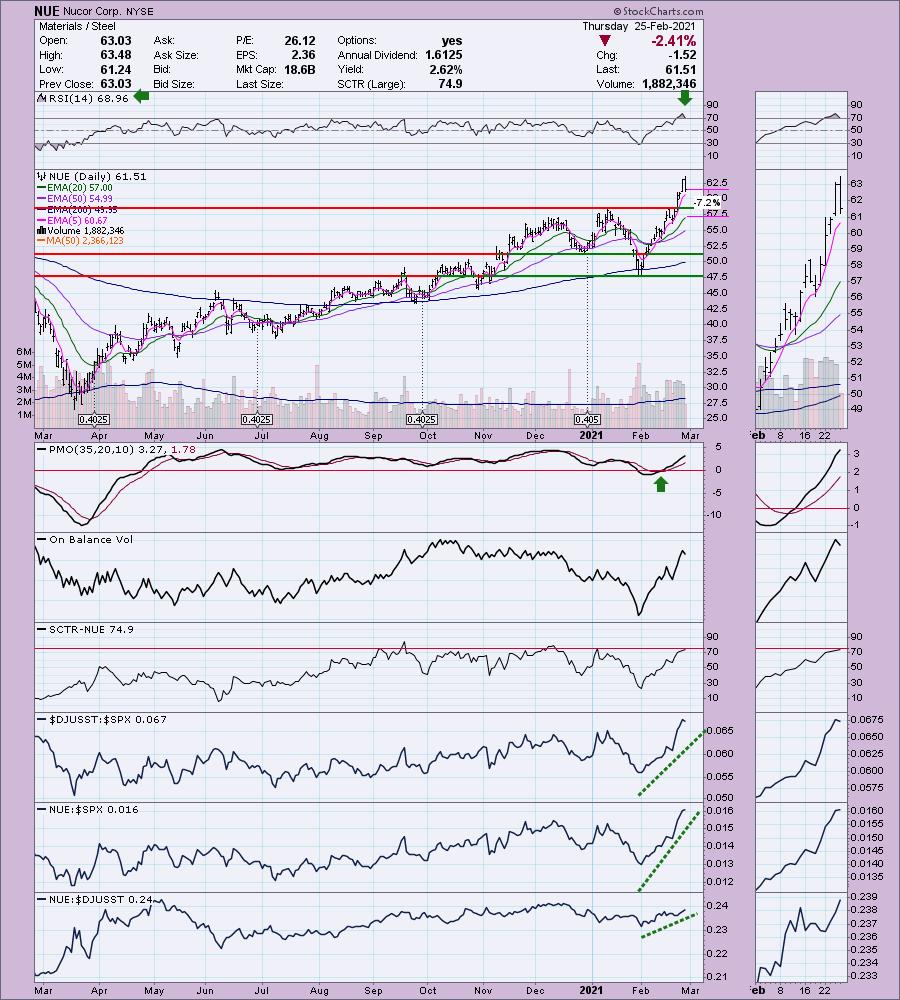
Reader Request #3: STLD is down -1.02% in after hours trading. Steel is still a strong area of the market but I have to say this isn't my favorite choice in that industry. As you can see, while it is outperforming the SPX, it only keeping up with its brothers and sisters. I prefer NUE (which I'll put as a quick bonus under STLD's charts). The price pattern is a broadening or megaphone pattern. These are bearish formations. Steel is doing so well though, this one may not take the normal trip down to the bottom of the pattern. Look at the weekly SPY chart in our annotated DPA ChartList on our website. You'll note a very large long-term megaphone. However, it broke out above it. The PMO on STLD is still positive and on an oversold BUY signal. The OBV is confirming the current rally and the RSI is positive. If you choose this one, you'll want a deeper stop at the 50-EMA.
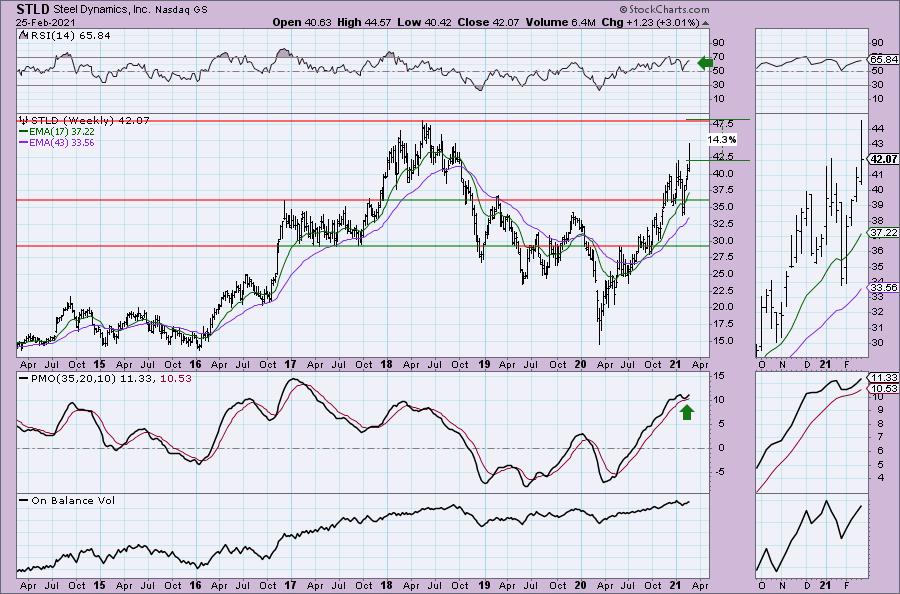
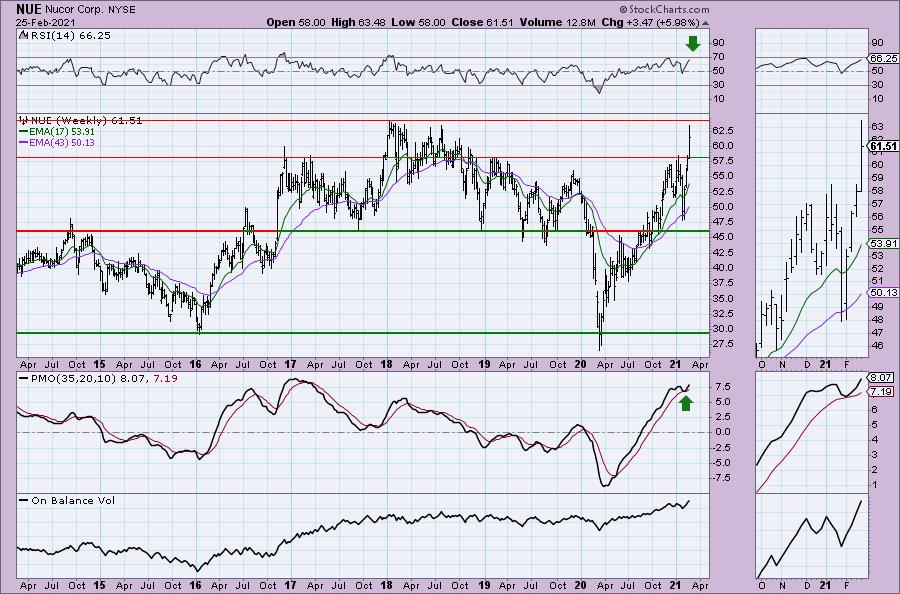
I do like the PMO bottom above the signal line, but you'll see the same on the NUE weekly chart as well. There is still nice upside potential and the RSI is also positive.
NUE was overbought but today's pullback cleared that condition. The PMO is on a BUY signal and rising nicely. You can see there is better performance against the industry group in comparison to STLD.
Zions Bancorp (ZION)
EARNINGS: 4/19/2021 (AMC)
Zions Bancorporation is one of the nation's premier financial services companies with total assets exceeding $75 billion. Zions operates under local management teams and distinct brands in 11 western states: Arizona, California, Colorado, Idaho, Nevada, New Mexico, Oregon, Texas, Utah, Washington and Wyoming. The company is a national leader in Small Business Administration lending and public finance advisory services, and is a consistent top recipient of Greenwich Excellence awards in banking. In addition, Zions is included in the S&P 500 and NASDAQ Financial 100 indices.
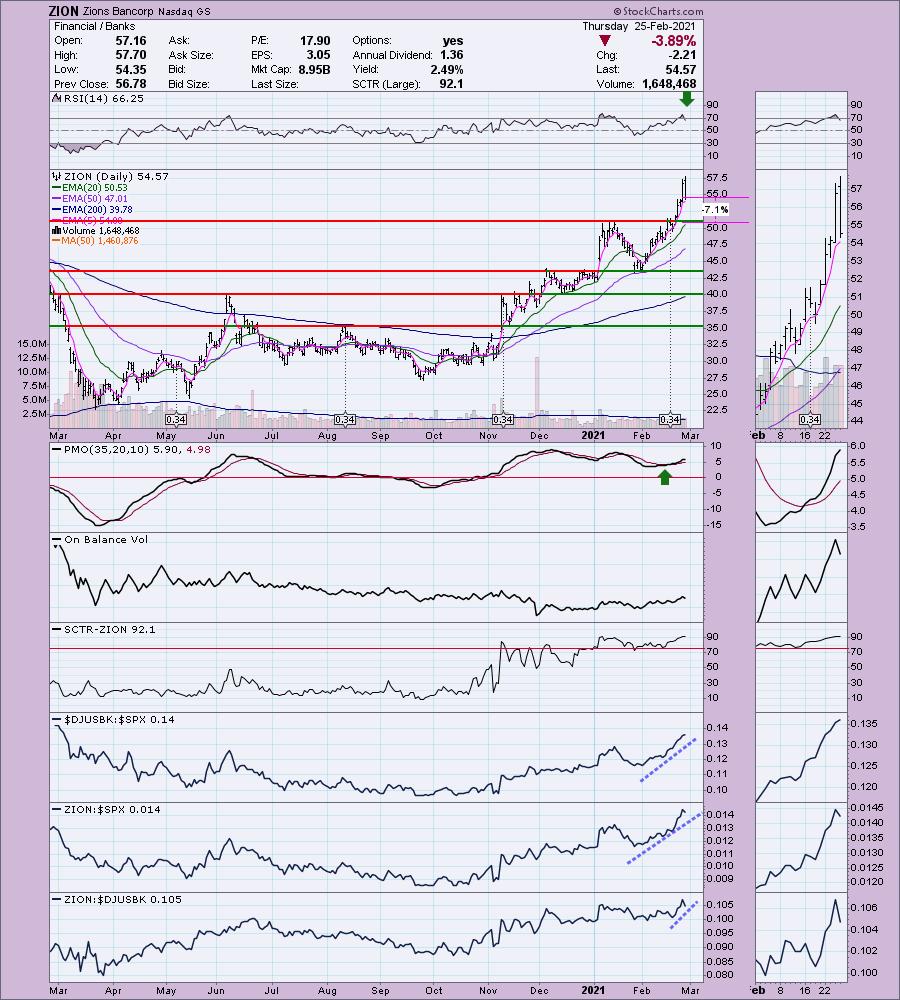
Reader Request #4: ZION is unchanged in after hours trading. I covered ZION on February 10th 2021. The stop was never challenged and so ZION is up 10.1% since then. I still like it. Today's pullback was needed. It took the RSI out of overbought territory. The PMO wasn't really damaged at all with today's nearly 4% decline which tells you there is still plenty of momentum under the surface here. It's a clear outperformer among Banks since we picked it. I believe it is still a "hold" and on this pullback it could be considered a "buy". Set the stop just below the January top.
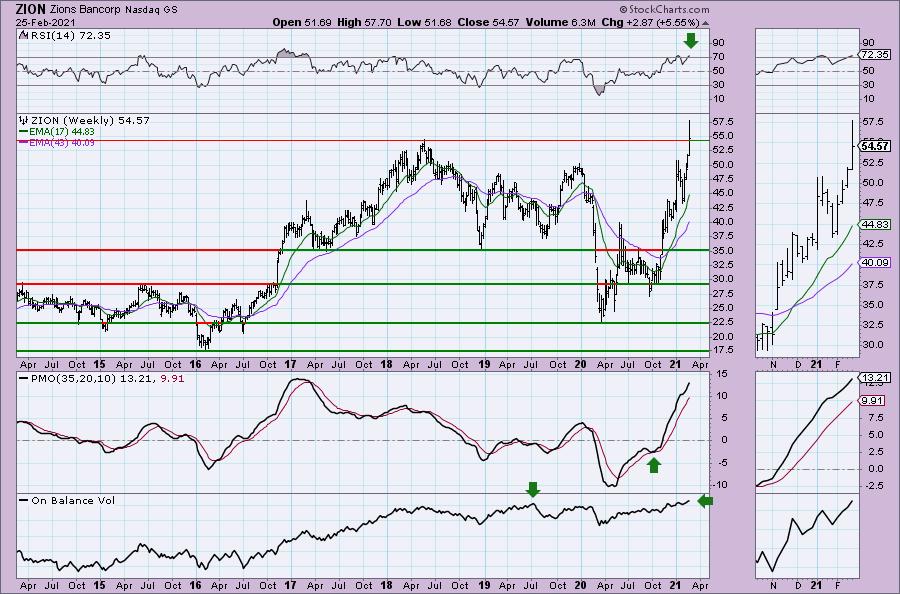
The weekly chart shows a powerful upside breakout this week. It's not at all-time highs, it's all-time high was hit back in 2007 before the financial crisis where it was above $70. The RSI is positive but somewhat overbought. I like the PMO bottom above the signal line that preceded the November/December rally. The newest OBV top is higher than its previous so there isn't a negative divergence.
Full Disclosure: I'm about 80% invested and 10% is in 'cash', meaning in money markets and readily available to trade with. I forgot to let you know that I did end up adding XME on Monday.
Current Market Outlook:
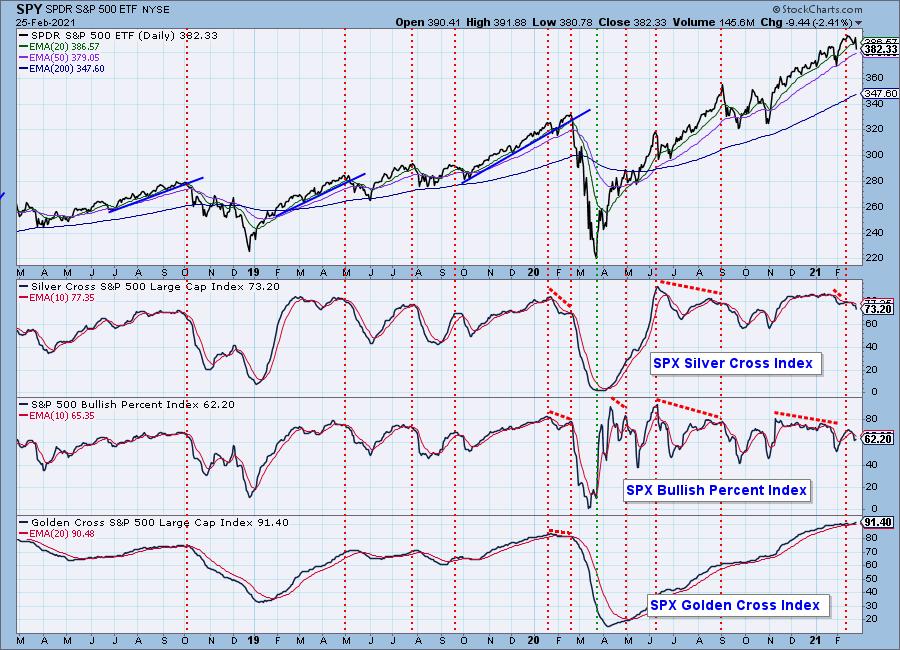
Market Environment: It is important to consider the odds for success by assessing the market tides. The following chart uses different methodologies for objectively showing the depth and trend of participation for intermediate- and long-term time frames.
- The Silver Cross Index (SCI) shows the percentage of SPX stocks on IT Trend Model BUY signals (20-EMA > 50-EMA)
- The Golden Cross Index (GCI) shows the percentage of SPX stocks on LT Trend Model BUY signals (50-EMA > 200-EMA)
- The Bullish Percent Index (BPI) shows the percentage of SPX stocks on Point & Figure BUY signals.
Don't forget that as a "Diamonds" member, you have access to our GCI/SCI curated ChartList on DecisionPoint.com. You'll find it under "Members Only" links on the left side on the Blogs and Links Page.
Here is the current chart:
Diamond Index:
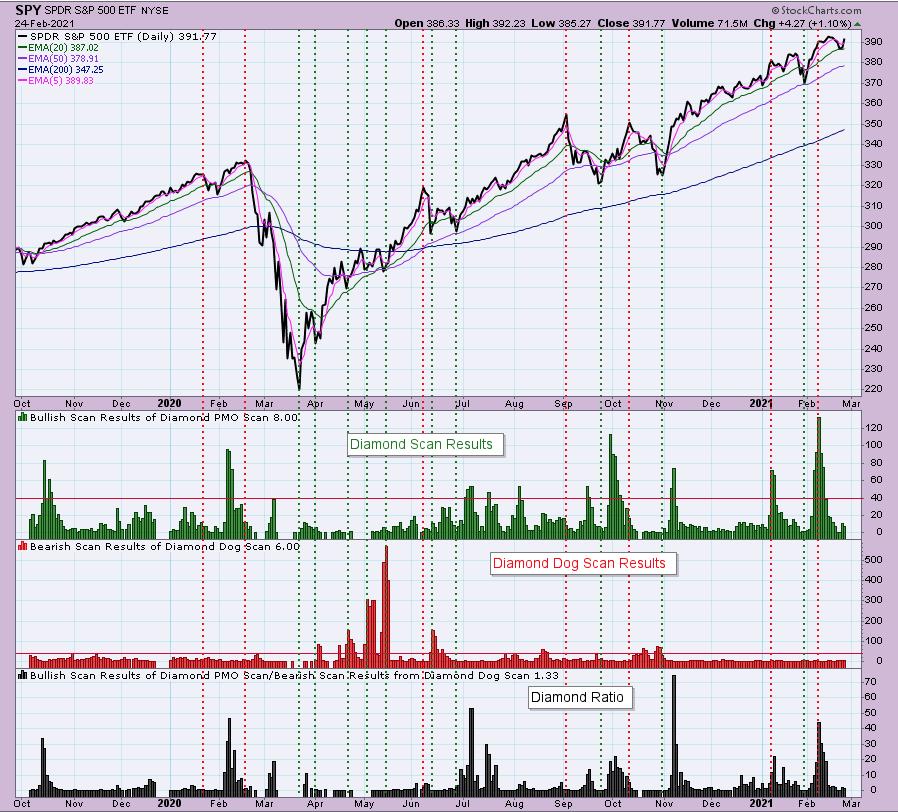
The Diamond Index chart looks at the number of scan results from my bullish Diamond PMO Scan and the number of scan results from the inverse Diamond Dog Scan. The Diamond Ratio divides the bullish results by the bearish results.
I only have data going back to October 2019 so I won't make any sweeping conclusions about the Diamond Index chart. I have marked cardinal tops with red dotted vertical lines and cardinal price bottoms with green dotted vertical lines. I believe that when the Diamond Dog results spike, it usually comes at a price bottom, or marks a strong continuation of the rising trend.
Unfortunately, the Diamond PMO Scan result numbers aren't providing much insight. The Diamond Ratio has promise, but again I don't see a clear correlation to the market tops/bottoms right now. I need to study and manipulate the data some more. Keep you posted!
Technical Analysis is a windsock, not a crystal ball.
Happy Charting!
- Erin
erin@decisionpoint.com
Watch the latest episode of DecisionPoint with Carl & Erin Swenlin on Mondays 7:00p EST or on the DecisionPoint playlist on the StockCharts TV YouTube channel here!
NOTE: The stocks reported herein are from mechanical trading model scans that are based upon moving average relationships, momentum and volume. DecisionPoint analysis is then applied to get five selections from the scans. The selections given should prompt readers to do a chart review using their own analysis process. This letter is not a call for a specific action to buy, sell or short any of the stocks provided. There are NO sure things or guaranteed returns on the daily selection of "diamonds in the rough."
Helpful DecisionPoint Links:
DecisionPoint Shared ChartList and DecisionPoint Chart Gallery
Price Momentum Oscillator (PMO)
Swenlin Trading Oscillators (STO-B and STO-V)
For more links, go to DecisionPoint.com!
