
One of those strange days where four of my selections start with the same letter. Today that would be "I". It's never anything I do on purpose, sometimes it just happens. I also have a big name Restaurant and Bars stock that is breaking out to new all-time highs.
Overall the market is soft and a downturn will be upon us assuredly before we are ready for it. The best protection out there is a stop. If you're uncomfortable adding positions, I get it...so am I. I'm using Diamonds in the Rough to build my watch list up. Last week's Diamond of the Week, Parker Hannifin (PH) still looks bullish and is certainly enticing me to add a position (among others), but I am practicing discipline by sticking to my analysis process. Just be careful out there.
I would ask a favor. I finished the first of my three appearances this week today and it was great fun! I have two more tomorrow. I would VERY much appreciate it if you could register, particularly for the Traders Exclusive event. I'm short on my registrations right now and could use a boost! Thank you to those who registered and attended today's event where I went over Chart Patterns. The next two presentations will also be top notch. Best of all they will send you the recording after the event.
Today's "Diamonds in the Rough" are: IP, IPG, IRM, ITT and SBUX.
FREE WEBINAR APPEARANCES TOMORROW!
I'll be presenting at three excellent online conferences next week. I would very much appreciate it if you would register for these events. I will post the third registration link when I get it. If you can't go a recording will be sent and every sign up that I receive adds 'gravitas'.

March 3rd, 2021 at 3:30p ET:
"It's All on the Chart"
- You don't have to make it hard!
- Step up your trading as Erin demonstrates how she uses her exclusive Price Momentum Oscillator and two other primary indicators to find the best trades and entries/exits for short-, intermediate- and long-term investors.
REGISTER HERE for the Traders Exclusive Webinar!
==============================================================================


3rd Annual Women Teach Trading and Investing (March 1-5) My Presentation on MARCH 3rd at Noon ET:
"Building Blocks of Technical Analysis"
- Everything you need to know to start using stock charting to improve your portfolio
- Support and Resistance, Overbought v. Oversold and Volume
- Basic Market and Stock indicators
- Trendlines and Chart Patterns
- Stops, Entries and Exits
REGISTER HERE for the TimingResearch.com and TradeOutLoud.com webinar event.
==============================================================================
 Diamond Mine Registration Information:
When: Mar 5, 2021 09:00 AM Pacific Time (US and Canada)
Topic: DecisionPoint Diamond Mine (3/5/2021) LIVE Trading Room
Register in advance for this webinar:
https://zoom.us/webinar/register/WN_OFnLCP7ZShOerDECNrb-TA
After registering, you will receive a confirmation email containing information about joining the webinar, including the password.
=======================================================================
Recording Link:
Topic: DecisionPoint Diamond Mine (02/26/2021) LIVE Trading Room
Start Time : Feb 26, 2021 08:58 AM
Meeting Recording:
Access Passcode: Ft7Uq!&+
***Click here to register for this recurring free DecisionPoint Trading Room on Mondays at Noon ET!***
+++++++++++++++++++++++++++++++++++++++++++++++++++++++++++++++++++++++++++++++
DAVID KELLER joined me for the last DP Trading Room on March 1st. Below you'll find the recording link. We had a great time discussing the markets and the various symbol requests.
RECORDING LINK:
Topic: DecisionPoint Trading Room
Start Time : Mar 1, 2021 09:00 AM
Meeting Recording:
Access Passcode: tdd*4nNS
For best results, copy and paste the access code to avoid typos.
Welcome to DecisionPoint Daily Diamonds, wherein I highlight five "diamonds in the rough." These are selected from the results of my DecisionPoint scans, which search for stocks that could benefit from the trend and condition of the market. Remember, these are not recommendations to buy or sell, but are the most interesting of the stocks that surfaced in my scans. My objective is to save you the work of the initial, tedious culling process, but you need to apply your own analysis to see if these stocks pique your interest as well. There are no guaranteed winners here!
International Paper Co. (IP)
EARNINGS: 4/29/2021 (BMO)
International Paper Co. engages in the manufacture of paper and packaging products. It operates through the following segments: Industrial Packaging, Global Cellulose Fibers, and Printing Papers. The Industrial Packaging segment involves in the manufacturing of containerboards, which include linerboard, medium, whitetop, recycled linerboard, recycled medium, and saturating kraft. The Global Cellulose Fibers segment offers cellulose fibers product portfolio includes fluff, market, and specialty pulps. The Printing Papers segment includes manufacturing of the printing and writing papers. The company was founded by Hugh J. Chisholm in 1898 and is headquartered in Memphis, TN.
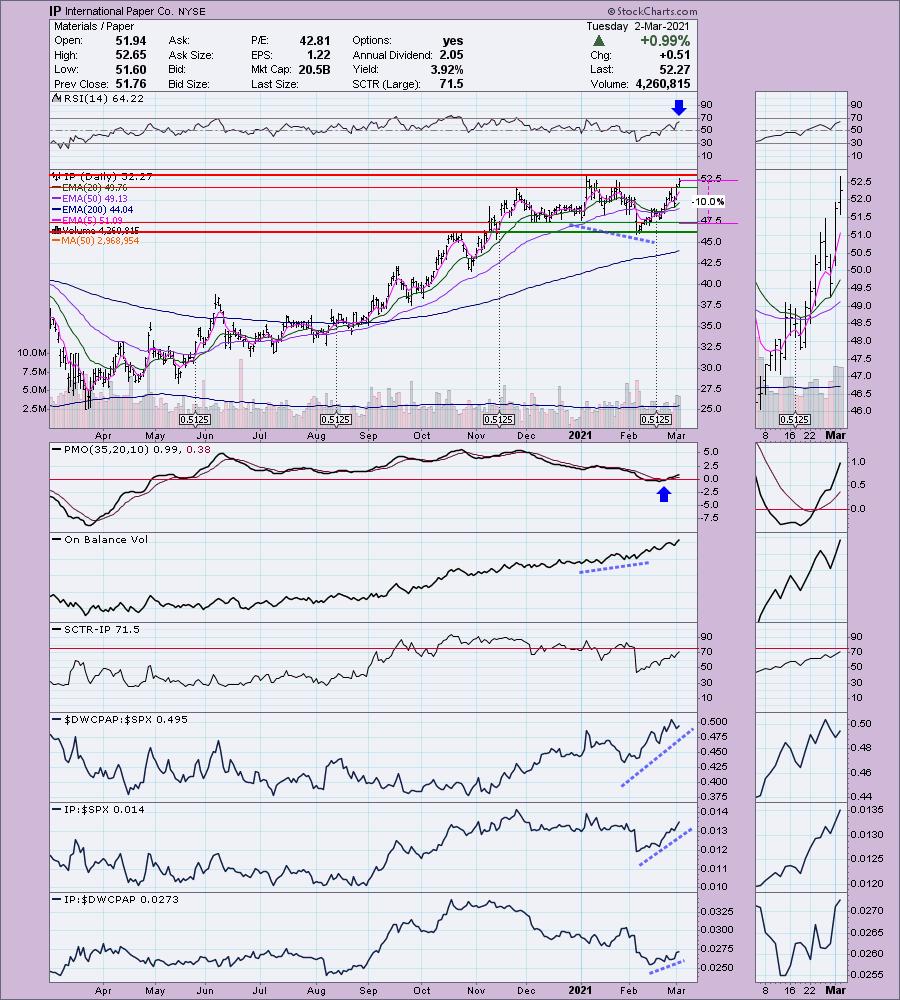
IP is unchanged in after hours trading. We don't have a breakout yet which is a bit of a concern, but the indicators are suggesting the breakout will occur. We have a fairly recent BUY signal on the PMO. I noticed a positive OBV divergence that led into the current rally. It is a clear out-performer and the Paper industry group is doing very well. The SCTR has been rising steadily implying internal strength as well as relative strength. The stop is rather deep, but it lines up nicely with support at the December lows.
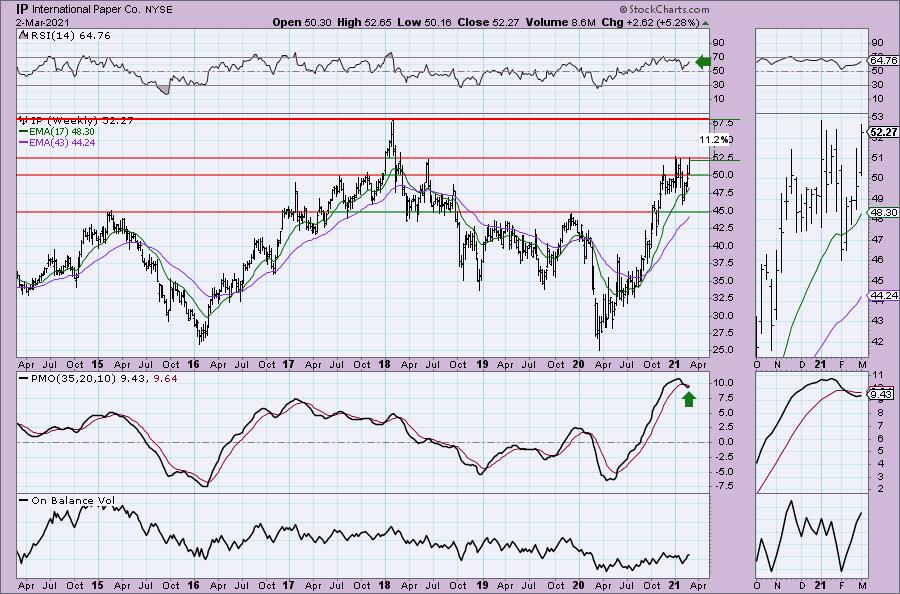
The weekly PMO is on a SELL signal which I don't like, but it is already bottoming. The RSI is rising in positive territory and isn't overbought. If it does breakout we should manage a gain of about 11%.
Interpublic Grp Of Cos (IPG)
EARNINGS: 4/21/2021 (BMO)
Interpublic Group of Cos., Inc. engages in the provision of advertising and marketing services. The company specializes in consumer advertising, digital marketing, communications planning and media buying, public relations, and specialized communications disciplines. It operates through the following segments: Integrated Agency Network (IAN), Constituency Management Group (CMG), and Corporate and Other. The IAN segment includes advertising and media services, as well as a comprehensive array of global communications and marketing services. The CMG segment offers events and public relations services as well as sports and entertainment marketing, corporate and brand identity, and strategic marketing consulting. The Corporate and Other segment refers to the Acxiom activities. The company was founded on September 18, 1930 and is headquartered in New York, NY.
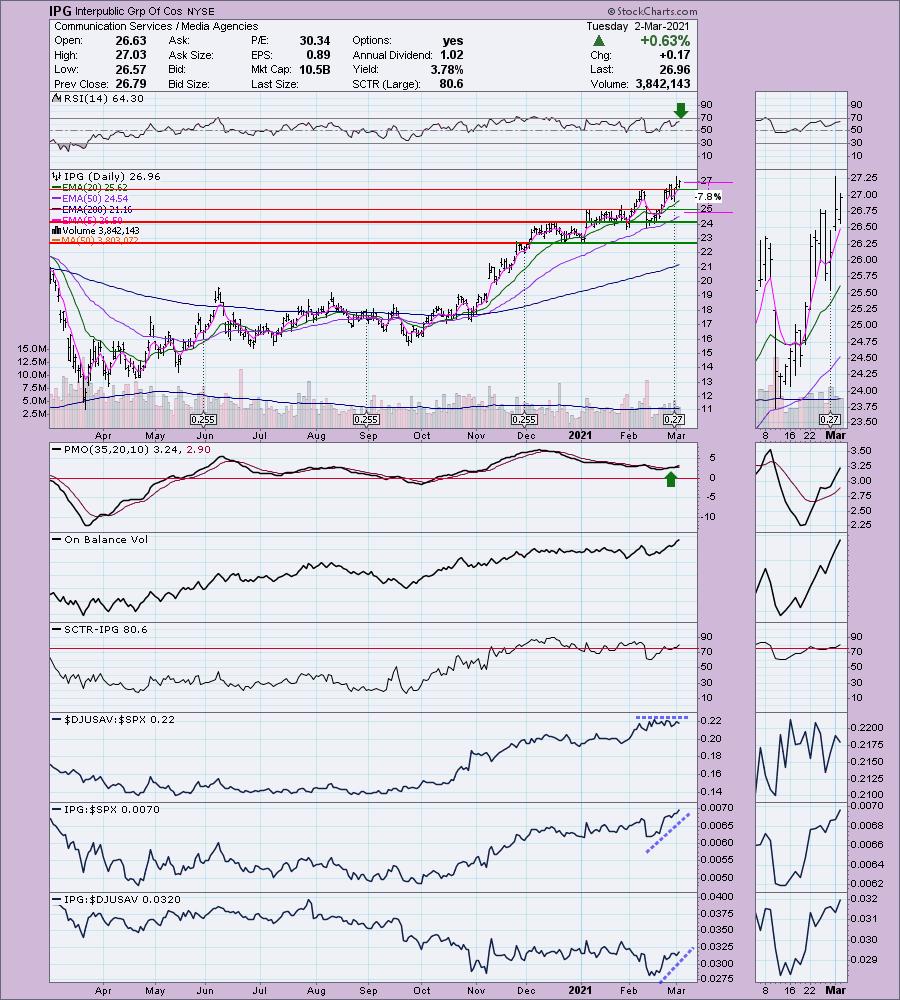
IPG is up +0.15% in after hours trading. I like the follow-through on Friday's breakout. The RSI is positive and not overbought and the PMO not only just gave us a crossover BUY signal, it also bottomed above its signal line which is especially bullish. The industry group itself is performing about as well as the SPX, but IPG is outperforming the market and the members of its industry group. I like seeing the recent dividend increase to make it more attractive. The SCTR just hit the "hot zone" above 75. I set the stop just into the trading range from January.
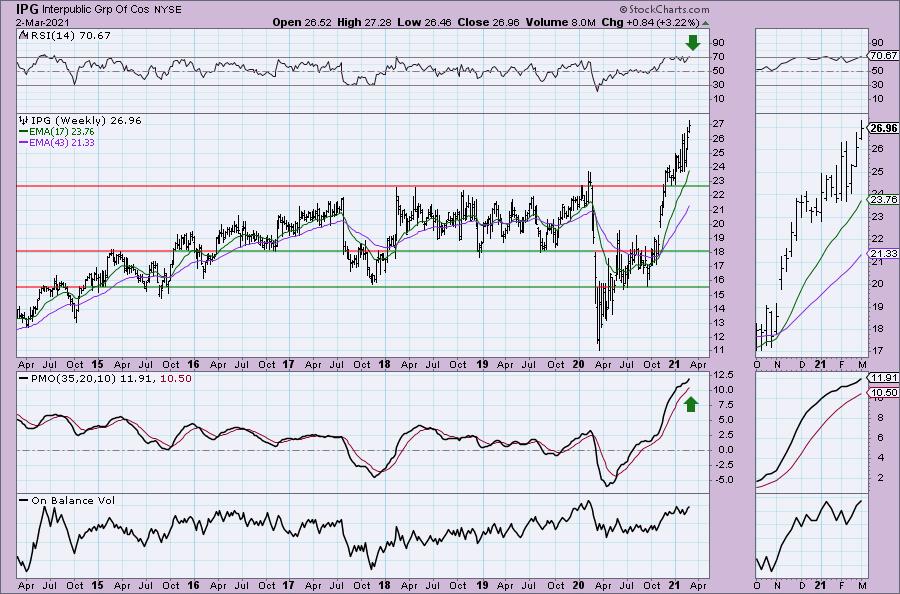
The weekly chart certainly shows a stock that is overbought when you look at the location of both the RSI and PMO. However the PMO is accelerating higher and the RSI has taken up residence in overbought territory since the middle of last year.
Iron Mountain, Inc. (IRM)
EARNINGS: 5/6/2021 (BMO)
Iron Mountain, Inc. engages in the provision of storage and information management solutions. It operates through the following business segments: North American Records & Information Management Business, North American Data Management Business, Western European Business, Other International Business, Global Data Center Business and Corporate & Other Business. The North American Records & Information Management Business segment offers record management, destruction, and fulfilment services throughout U.S. and Canada. The North American Data Management Business segment handles data protection and recovery, server and computer backup services, and safeguarding of electronic and physical media in U.S. and Canada. The Western European Business segment offers records management, data protection and recovery services, and document management solutions throughout the United Kingdom, Ireland, Austria, Belgium, France, Germany, Netherlands, Spain, and Switzerland. The Other International Business segment offers storage and information management services throughout the remaining European countries, Latin America, the Middle East and Africa. The Global Data Center Business segment provides data center facilities to protect mission-critical assets and ensure the continued operation of its customers IT infrastructures, with secure and reliable colocation and wholesale options. The Corporate & Other Business segment consists of the storage, safeguarding and electronic or physical deliveries of physical media of all types and digital content repository systems to house, distribute, and archive key media assets, primarily for entertainment and media industry clients. The company was founded by Herman Knaust in 1951 and is headquartered in Boston, MA.
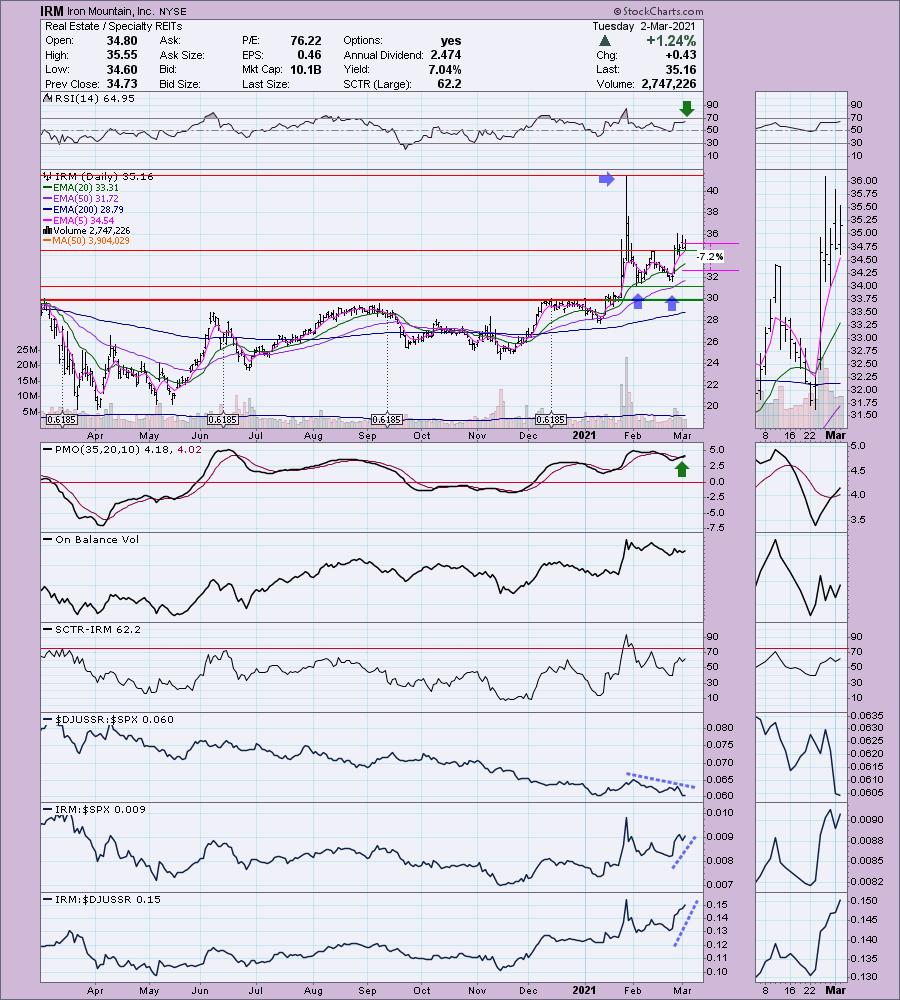
IRM is up slightly +0.11% in after hours trading. I did a chart pattern workshop today and admittedly I'm cheating a little with this double-bottom pattern. Double-bottoms are reversal patterns so you don't see them at price tops. However, it did decline greatly after spiking at the end of January and has formed a double bottom off that decline. The minimum upside target of the pattern would put price at about $38. The PMO has just generated a crossover BUY signal after price consolidated after the breakout. The stop could be set lower, but given the chart pattern, I chose to set it halfway down into the pattern as that would completely bust it. The RSI is positive and not overbought. Even though the industry group is underperforming by a great deal, IRM is outperforming the SPX. In this case we really needed to see its price relative to the SPX. Just because it is outperforming its industry group, the group itself is underperforming so it could be that the stock is still in decline but technically outperforming its group. We can see it is outperforming the SPX in this case, so I included it.
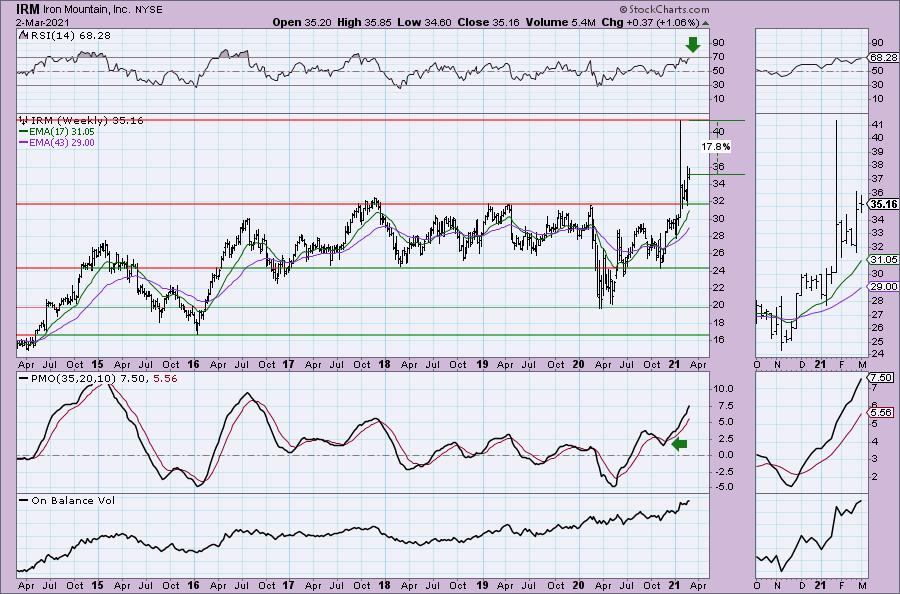
I very much like this weekly chart. We can see that the breakout above $32 was significant. That prior resistance level should hold as support. The RSI is positive and not quite overbought. The PMO is accelerating higher and is not overbought.
Don't forget, on Thursdays I look at reader-requested symbols, so shoot me an email at erin@decisionpoint.com. I read every email I receive and try to answer them all!
ITT Inc. (ITT)
EARNINGS: 4/19/2021 (AMC)
ITT, Inc. engages in the manufacture and sale of engineered components and customized technology solutions in the field of energy, transportation, and industrial markets. It operates through the following segments: Motion Technologies, Industrial Process, and Connect and Control Technologies. The Motion Technologies segment manufactures brake components and specialized sealing solutions, shock absorbers and damping technologies primarily for the global automotive, truck and trailer, public bus and rail transportation. The Industrial Process segment includes engineered fluid process equipment in areas such as chemical, oil and gas, mining, and other industrial process markets as well as providing of plant optimization and efficiency solutions and aftermarket services and parts. The Connect and Control Technologies segment offers harsh-environment connector solutions and critical energy absorption and flow control components for the aerospace and defense, general industrial, medical, and oil and gas markets. The company was founded in 1920 and is headquartered in White Plains, NY.
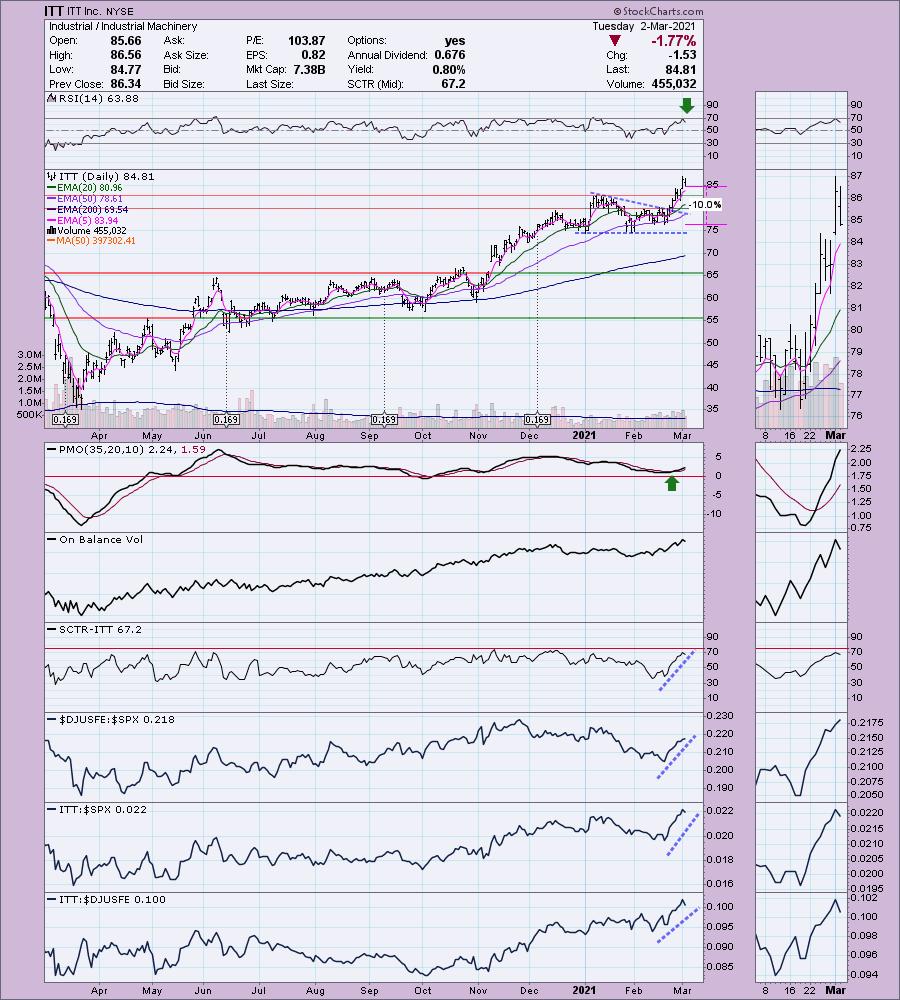
ITT is down -0.74% in after hours trading. I covered this one as a reader request back on May 29th 2020. The stop I set on that chart nearly was hit, but fortunately it managed to close above it after a pullback. After that it was off to the races. It is currently up 47.0% since then. You might wonder why I have annotated a bearish chart pattern on a stock I like. It is to show you that this one defied the chart pattern and broke out. A bullish conclusion to a bearish chart pattern is usually especially bullish. I honestly like this one on the pullback, especially if it continues to pull back tomorrow. As long as it stays above support, we should see it move higher. It is in an industry group that is performing well and it is outperforming both the SPX and its group. The RSI is positive; the pullback took it out of dangerous overbought territory. The PMO just gave us a clean crossover BUY signal. You could definitely set a more shallow stop. I've set it to match up with support at the mid-February lows.
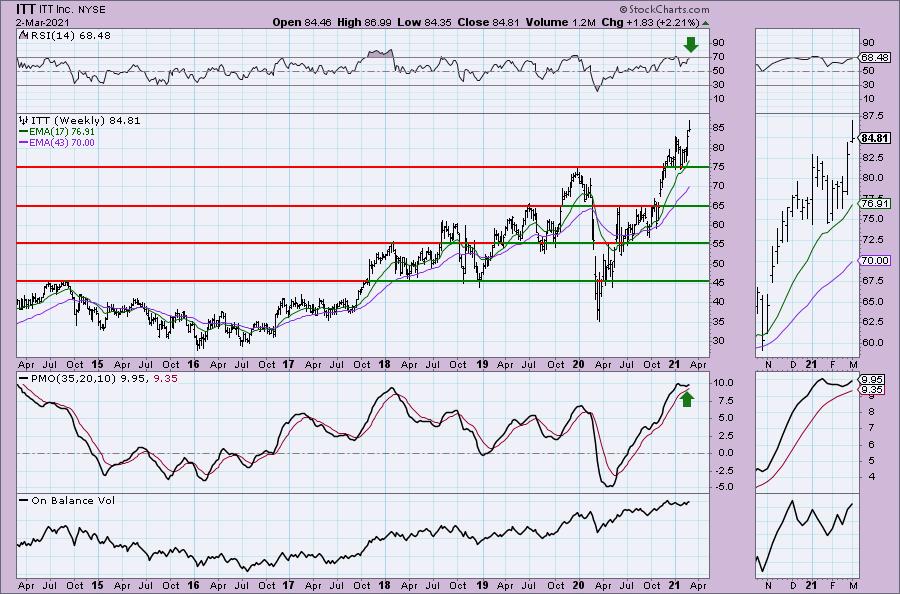
The weekly PMO has bottomed above its signal line which is very bullish. The PMO seems overbought, but you can see that in 2014 it was higher than this. The weekly RSI is positive and not quite overbought. The OBV has been confirming the rising trend since the bear market low.
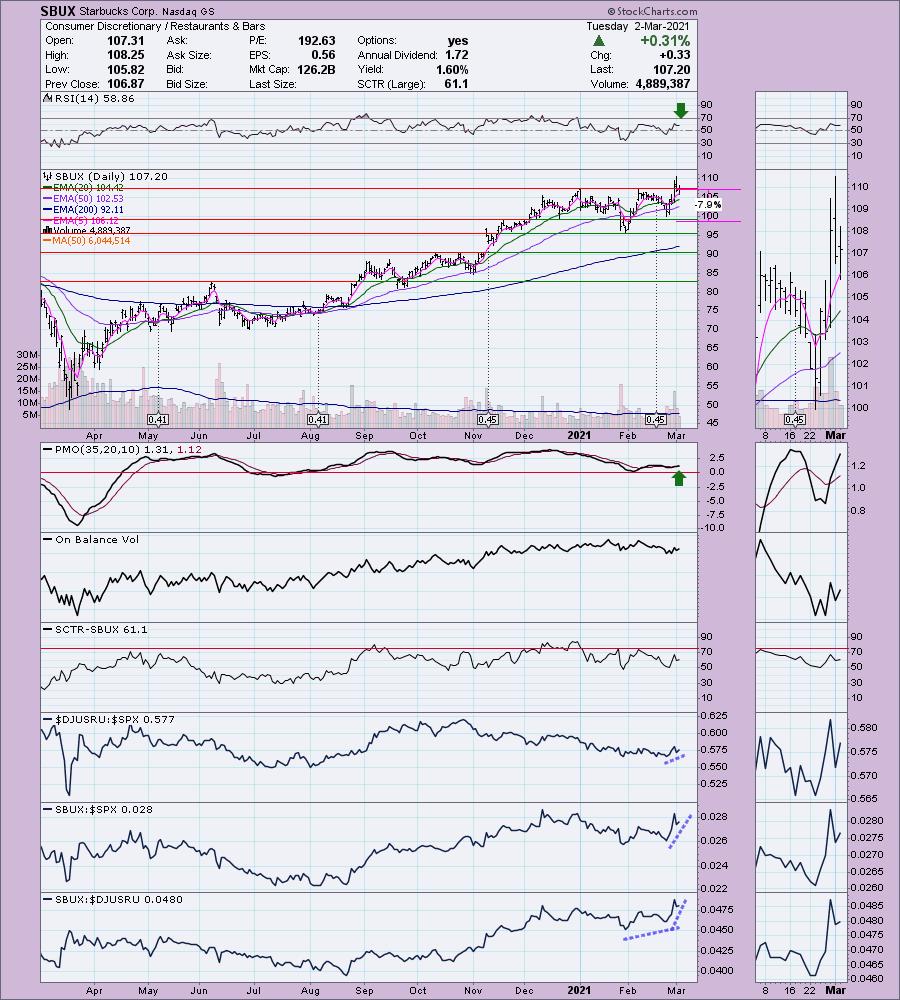
Starbucks Corp. (SBUX)
EARNINGS: 4/27/2021 (AMC)
Starbucks Corp. engages in the production, marketing, and retailing of specialty coffee. It operates through the following segments: Americas; China/Asia Pacific (CAP); Europe, Middle East, and Africa (EMEA); and Channel Development. The Americas, CAP, EMEA segments sells coffee and other beverages, complementary food, packaged coffees, single-serve coffee products, and a focused selection of merchandise through company-oriented stores, and licensed stores. The Channel Development segment include sales of packaged coffee, tea, and ready-to-drink beverages to customers outside of its company-operated and licensed stores. The company brands include Evolution Fresh, Teavana, Tazo Tea and Seattle's Best. Starbucks was founded by Jerry Baldwin and Howard D. Schultz on November 4, 1985 and is headquartered in Seattle, WA.
SBUX is up +0.09% in after hours trading. I covered SBUX back on May 25th 2020. I had set the stop at the earlier May 2020 lows at $70. It nearly triggered the stop, but eventually began climbing in July. It is up 36.4% since then. I liked the breakout from Thursday and Friday. We did get a pullback today, but it closed just on support. The PMO bottoms are rising with price bottoms and it just triggered a crossover BUY signal. I'm not thrilled with the OBV as it has a negative divergence with price currently. The SCTR is healthy, albeit not in the "hot zone" above 75. What impressed me was its outperformance against the SPX and its industry group. The RSI is positive and not overbought. I set a reasonable stop below the late February lows and below support.
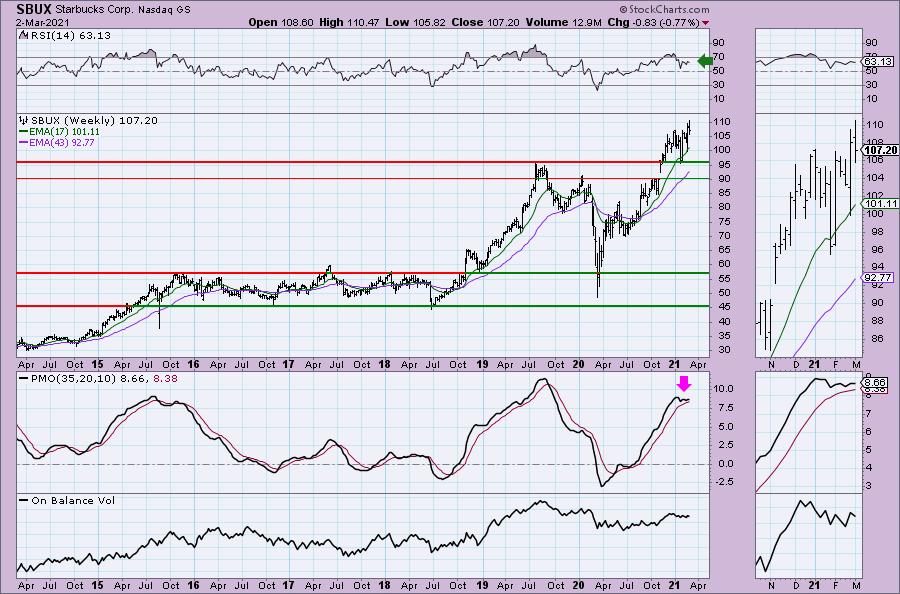
The weekly RSI is positive. The PMO is indecisive on the weekly chart, but it isn't overbought. This one should continue to log new all-time highs.
Full Disclosure: I'm about 75% invested and 25% is in 'cash', meaning in money markets and readily available to trade with. I was stopped out of one of my positions (non-diamond).
Current Market Outlook:
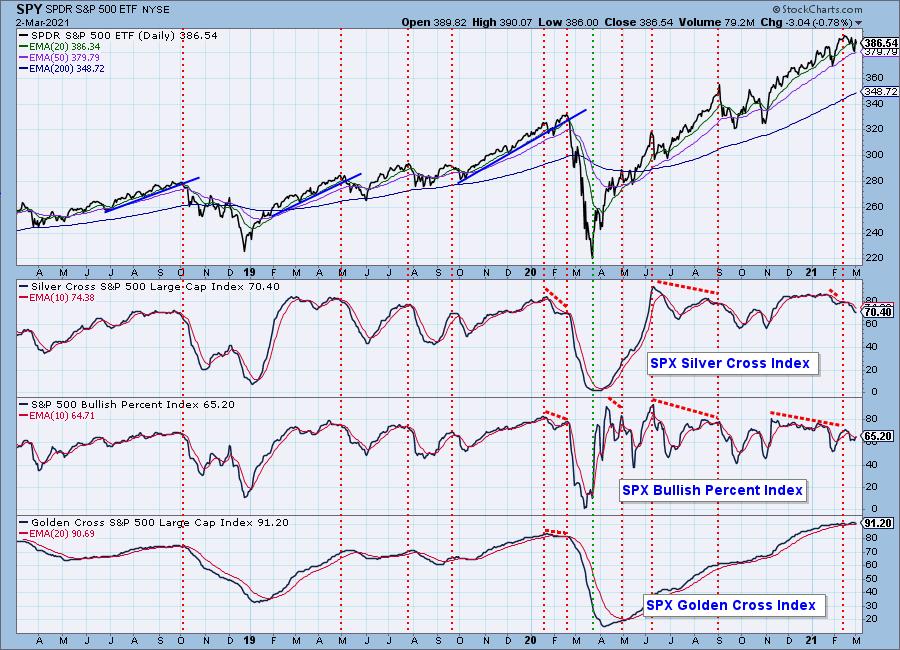
Market Environment: It is important to consider the odds for success by assessing the market tides. The following chart uses different methodologies for objectively showing the depth and trend of participation for intermediate- and long-term time frames.
- The Silver Cross Index (SCI) shows the percentage of SPX stocks on IT Trend Model BUY signals (20-EMA > 50-EMA)
- The Golden Cross Index (GCI) shows the percentage of SPX stocks on LT Trend Model BUY signals (50-EMA > 200-EMA)
- The Bullish Percent Index (BPI) shows the percentage of SPX stocks on Point & Figure BUY signals.
Don't forget that as a "Diamonds" member, you have access to our GCI/SCI curated ChartList on DecisionPoint.com. You'll find it under "Members Only" links on the left side on the Blogs and Links Page.
Here is the current chart:
Diamond Index:
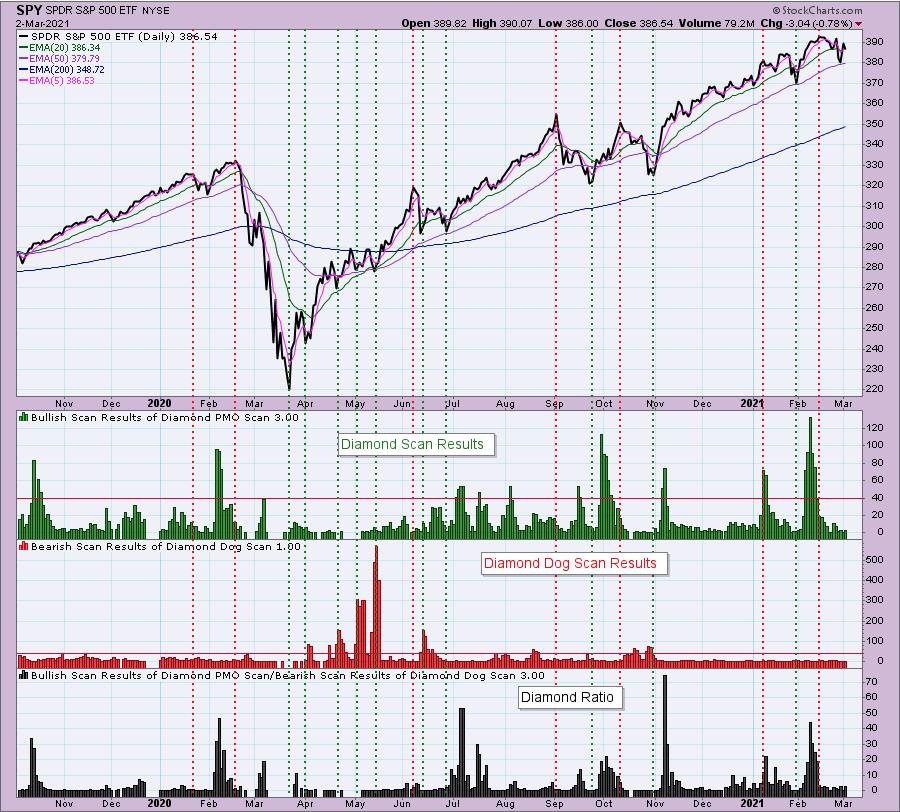
The Diamond Index chart looks at the number of scan results from my bullish Diamond PMO Scan and the number of scan results from the inverse Diamond Dog Scan. The Diamond Ratio divides the bullish results by the bearish results.
I only have data going back to October 2019 so I won't make any sweeping conclusions about the Diamond Index chart. I have marked cardinal tops with red dotted vertical lines and cardinal price bottoms with green dotted vertical lines. I believe that when the Diamond Dog results spike, it usually comes at a price bottom, or marks a strong continuation of the rising trend.
Unfortunately, the Diamond PMO Scan result numbers aren't providing much insight. The Diamond Ratio has promise, but again I don't see a clear correlation to the market tops/bottoms right now. I need to study and manipulate the data some more. Keep you posted!
Technical Analysis is a windsock, not a crystal ball.
Happy Charting!
- Erin
erin@decisionpoint.com
Watch the latest episode of DecisionPoint with Carl & Erin Swenlin on Mondays 7:00p EST or on the DecisionPoint playlist on the StockCharts TV YouTube channel here!
NOTE: The stocks reported herein are from mechanical trading model scans that are based upon moving average relationships, momentum and volume. DecisionPoint analysis is then applied to get five selections from the scans. The selections given should prompt readers to do a chart review using their own analysis process. This letter is not a call for a specific action to buy, sell or short any of the stocks provided. There are NO sure things or guaranteed returns on the daily selection of "diamonds in the rough."
Helpful DecisionPoint Links:
DecisionPoint Shared ChartList and DecisionPoint Chart Gallery
Price Momentum Oscillator (PMO)
Swenlin Trading Oscillators (STO-B and STO-V)
For more links, go to DecisionPoint.com!
