
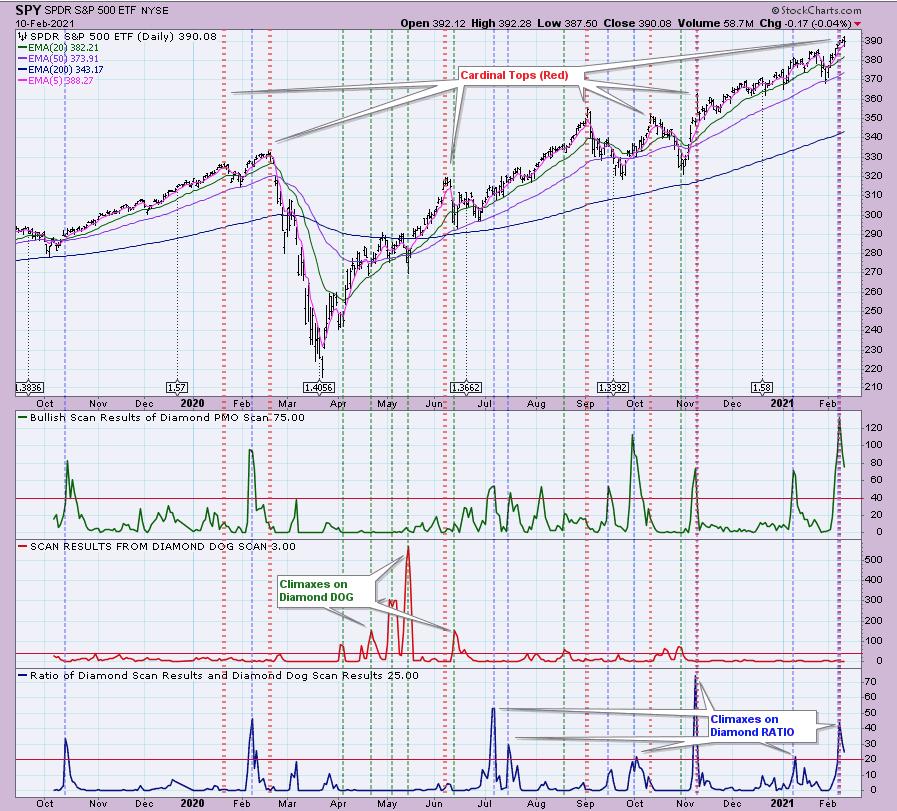
Before I get in too deep on today's "diamonds in the rough", I wanted to let you know that I have finally plotted the Diamond Scan Result numbers and Diamond Dog Scan Result numbers. Additionally I've added the Diamond Ratio. It seems that climaxes on these readings do suggest reversals. Its only rudimentary analysis right now as I still plan on tweaking the presentation. I'll write a free article about it when I have it finalized.
However, looking at it, I believe that the Diamond Dog climaxes (green verticals) are uncannily accurate on selling exhaustions. They just don't happen that often. The Diamond climaxes seem to overlap with the Diamond Ratio climaxes, so I opted to only annotate those (blue verticals). I've also annotated cardinal tops using red vertical lines. The last cardinal top and the November cardinal top arrive right after or on the Ratio climaxes. Ratio climaxes tend to arrive before consolidation or downside reversals. I'll be thinking about this more, but I may be onto something as far as the Diamond Dog results nailing selling exhaustions.
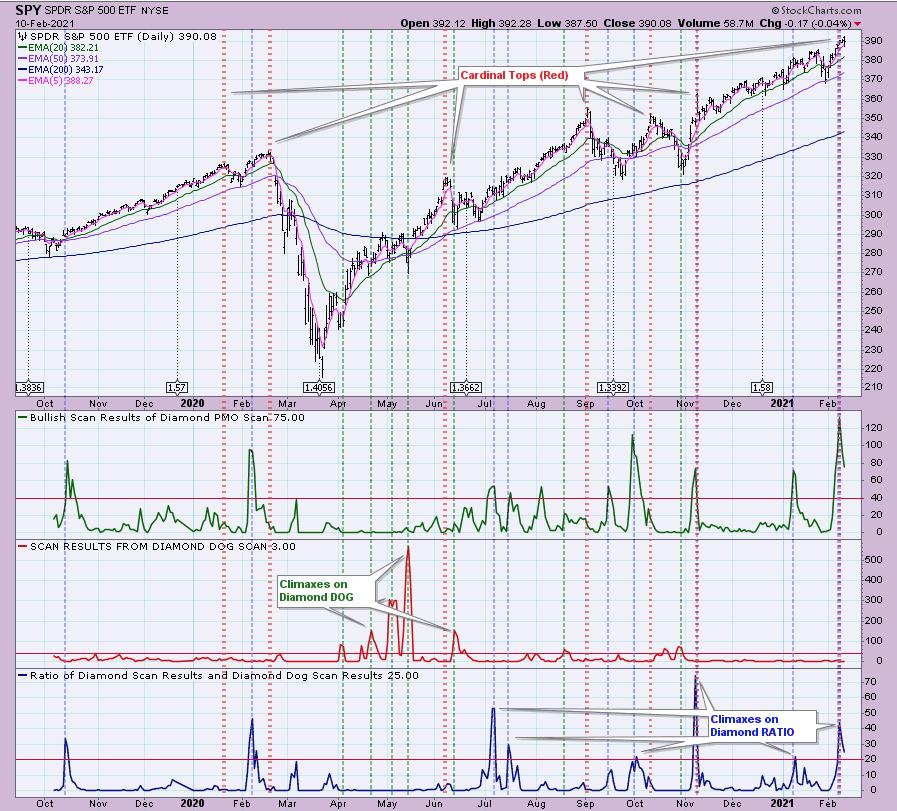
Banks again dominated my scan results. 10% of those presented in the Diamond PMO Scan today were banks. I presented one yesterday and I have two more for you today. Steel was 5% of the results. I presented CLF on Monday and I presented RS yesterday, so I opted for different Materials sector stock, Freeport-McMoran (FCX). Finally, the Oil Production and Exploration stocks are strengthening further. I have the ETF for that industry (IEO) and another popular name that looks strong.
Today's "Diamonds in the Rough" are: ABCB, FCX, IEO, OKE and ZION.
 Diamond Mine Registration Information:
When: Feb 12, 2021 09:00 AM Pacific Time (US and Canada)
Register Below:
https://zoom.us/webinar/register/WN_45P3AHvzSyeaUcNy3nZKPQ
After registering, you will receive a confirmation email containing information about joining the webinar, including the password.
=======================================================================
Recording Link:
Topic: DecisionPoint Diamond Mine (2/5/2021) LIVE Trading Room
https://zoom.us/rec/share/quKhVEg1DLqYLbPPJxo2Rn3ZtHXoyqNtIg9Ni2MvPkdPUrFYOuTEJbc2Yg2cGfil.7e3ArGOZA6H6DeOh
Access Passcode: 2vi+nYV*

It's Free!
***Click here to register for this recurring free DecisionPoint Trading Room on Mondays at Noon ET!***
+++++++++++++++++++++++++++++++++++++++++++++++++++++++++++++++++++++++++++++++
Here is the information for the Monday 2/8/2021 recording:
Topic: DecisionPoint Trading Room Recording
Meeting Recording:
https://zoom.us/rec/share/nwbGIyGJQch_e4JlI8Rw0-d0RtpjUDAByiD5mt3cD5nDBVZpURlT7RcARS3870FU.qRofBCbCSjetBkBU
Access Passcode: H!2B$fn3
For best results, copy and paste the access code to avoid typos.
Welcome to DecisionPoint Daily Diamonds, wherein I highlight five "diamonds in the rough." These are selected from the results of my DecisionPoint scans, which search for stocks that could benefit from the trend and condition of the market. Remember, these are not recommendations to buy or sell, but are the most interesting of the stocks that surfaced in my scans. My objective is to save you the work of the initial, tedious culling process, but you need to apply your own analysis to see if these stocks pique your interest as well. There are no guaranteed winners here!
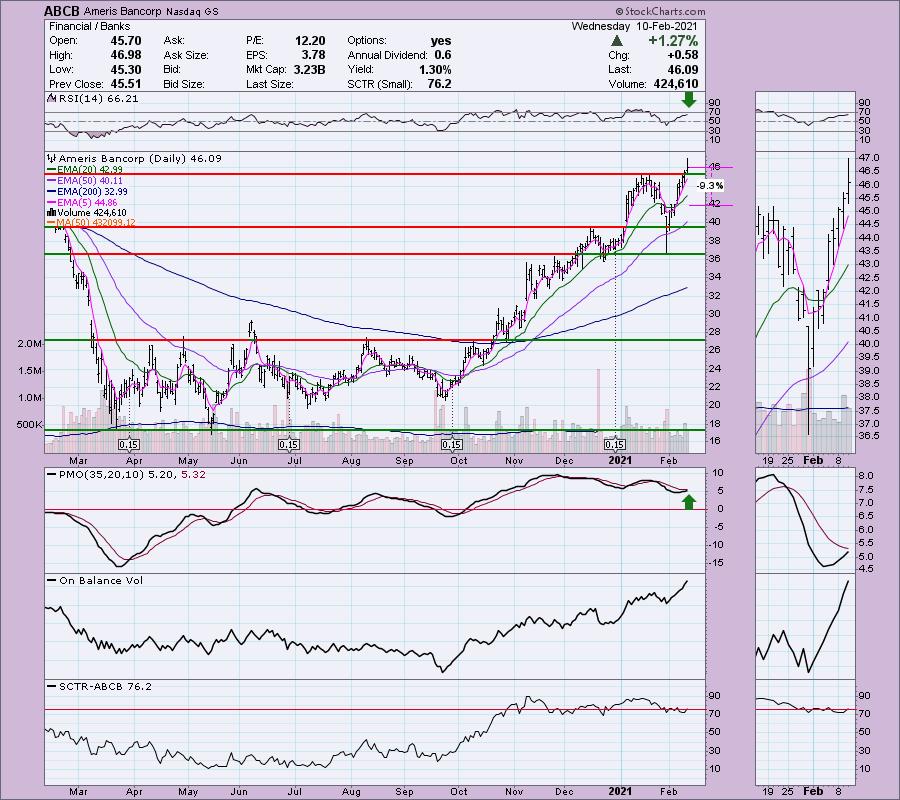
Ameris Bancorp (ABCB)
EARNINGS: 4/22/2021 (AMC)
Ameris Bancorp is a bank holding company, which through the subsidiary, Ameris Bank, engages in the provision of banking services to its retail and commercial customers. It operates through the following business segments: Banking, Retail Mortgage, Warehouse Lending, the SBA and Premium Finance. The Banking segment offers full service financial services to include commercial loans, consumer loans and deposit accounts. The Retail Mortgage segment includes origination, sales, and servicing of one-to-four family residential mortgage loans. The Warehouse Lending segment includes the origination and servicing of warehouse lines to other businesses that are secured by underlying one-to-four family residential mortgage loans. The SBA segment comprises of origination, sales, and servicing of small business administration loans. The Premium Finance segment comprises origination and servicing of commercial insurance premium finance loans. The company was founded on December 18, 1980 and is headquartered in Moultrie, GA.
ABCB is unchanged in after hours trading. Today it had a great upside breakout. The PMO is about to trigger a crossover BUY signal. The RSI is positive, rising and not overbought. Certainly the OBV is confirming the rally. The SCTR is in the "hot zone" above 75.
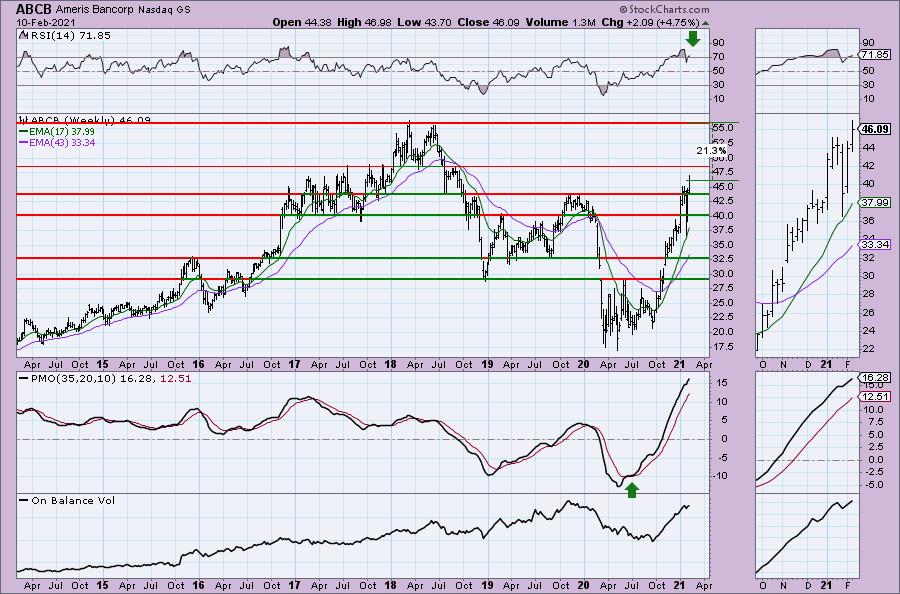
The weekly chart is bullish. We have a rising PMO, along with a strongly rising OBV. The weekly RSI is overbought, but with this new breakout above the 2019 highs, I suspect it will stay that way for a bit longer.
Freeport-McMoRan, Inc. (FCX)
EARNINGS: 4/23/2021 (BMO)
Freeport-McMoRan, Inc. engages in the mining of copper, gold, and molybdenum. It operates through the following segments: North America Copper Mines; South America Mining; Indonesia Mining; Molybdenum Mines; Rod and Refining; Atlantic Copper Smelting and Refining; and Corporate, Other, and Eliminations. The North America Copper Mines segment operates open-pit copper mines in Morenci, Bagdad, Safford, Sierrita and Miami in Arizona; and Chino and Tyrone in New Mexico. The South America Mining segment includes Cerro Verde in Peru and El Abra in Chile. The Indonesia Mining segment handles the operations of Grasberg minerals district that produces copper concentrate that contains significant quantities of gold and silver. The Molybdenum Mines segment includes the Henderson underground mine and Climax open-pit mine, both in Colorado. The Rod and Refining segment consists of copper conversion facilities located in North America, and includes a refinery, rod mills, and a specialty copper products facility. The Atlantic Copper Smelting and Refining segment smelts and refines copper concentrate and markets refined copper and precious metals in slimes. The Corporate, Other, and Eliminations segment consists of other mining and eliminations, oil and gas operations, and other corporate and elimination items. The company was founded by James R. Moffett on November 10, 1987 and is headquartered in Phoenix, AZ.
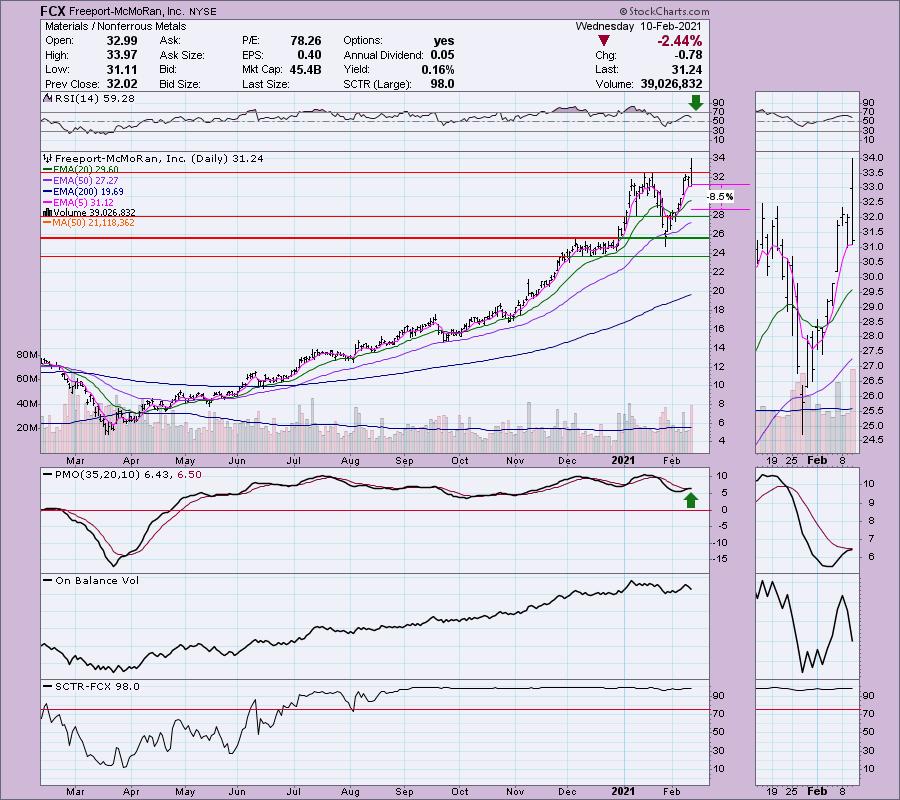
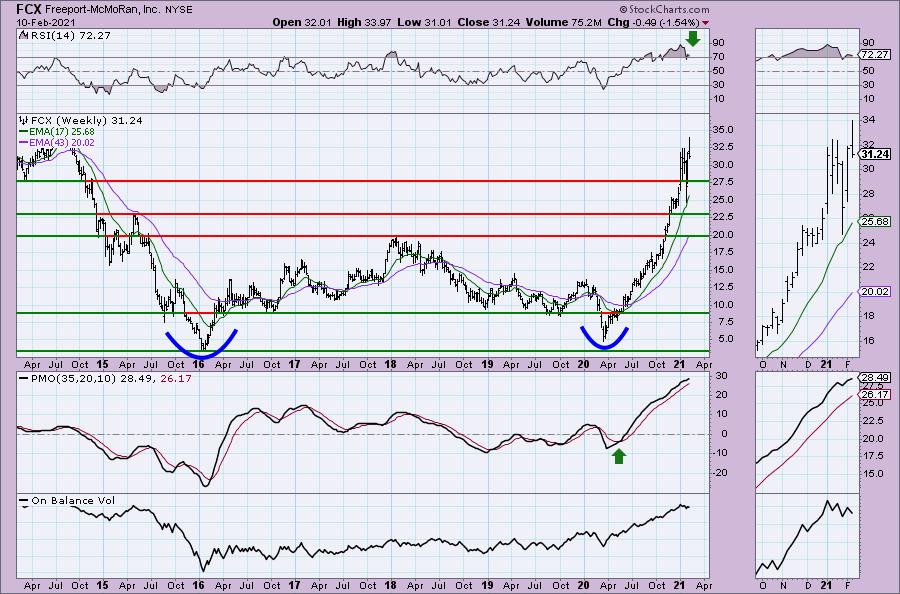
FCX is up +0.45% in after hours trading. I covered it twice before in the March 19th 2020 and October 20th 2020 Diamonds Reports. Amazingly, on March 19th this reader request made its official low and moved higher from there. It is up +444.3% since then. I can't take credit as this was a reader request and I panned it in that issue. I'm a momentum trader and on March 19th that chart looked ugly.
I presented this one again on October 20th, given the stop didn't hit, it is up +77.4% since then. That gain I will take credit for. It was a suspect OHLC bar today with price jetting higher on the open and then falling back to earth after. I'm okay with this pullback as price is holding the 5-EMA. The PMO is nearing a crossover BUY signal and the RSI is positive. It is in the Materials sector which I think you all know I'm bullish on. This pullback offers a better entry and a less steep stop level. It's not a perfect chart. There is a negative OBV divergence based on the intraday high today.
There is a very large double-bottom pattern that is likely easier to visualize on the monthly chart. The pattern has resolved upward as expected and is nearing its minimum upside target. The PMO is still rising but the RSI is overbought. The OBV is confirming the rally out of the bear market lows.
iShares U.S. Oil & Gas Exploration & Production ETF (IEO)
EARNINGS: N/A
IEO tracks a market cap weighted index of companies in the U.S. oil and gas exploration and production space according to Dow Jones.
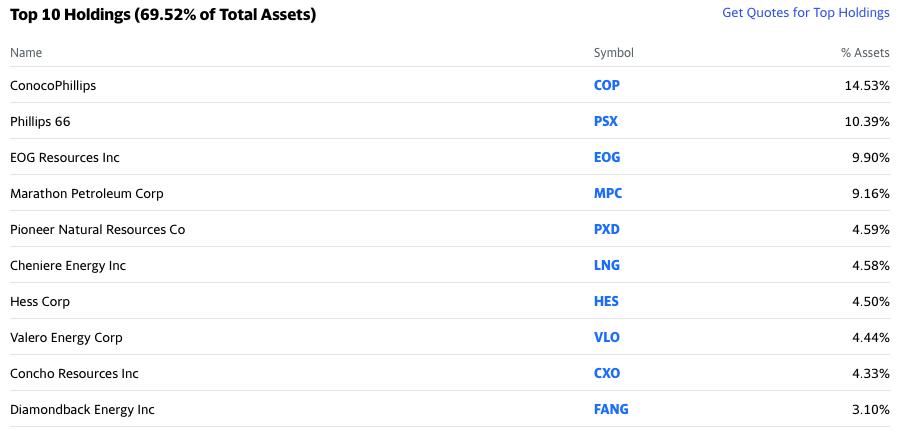
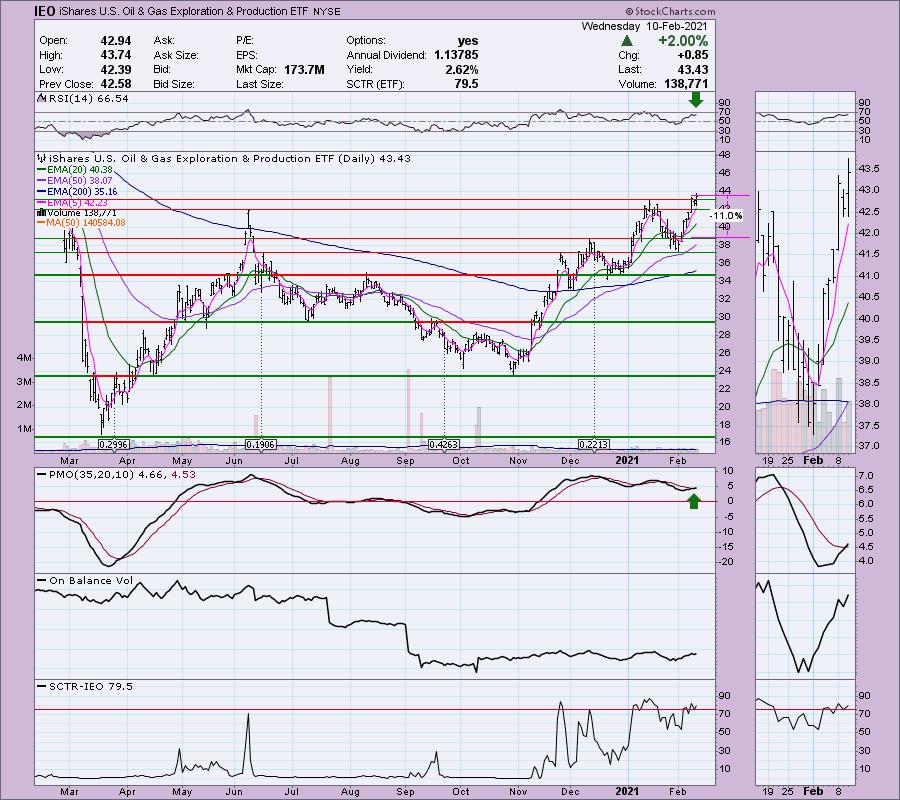
I've never covered IEO, although I have mentioned it in the opening paragraph a time or two. You'll note that FANG is one of the holdings of IEO. I presented FANG yesterday. This is a way to expose yourself to this hot industry group among the many big players in this area. The PMO has just triggered a BUY signal today and we can see that price broke out today. The RSI is positive and the most powerful area of overhead resistance at the June 2020 and January tops has been vaulted. It's a deep stop. You could certainly cut that in half or shave it to be at the 20-EMA.
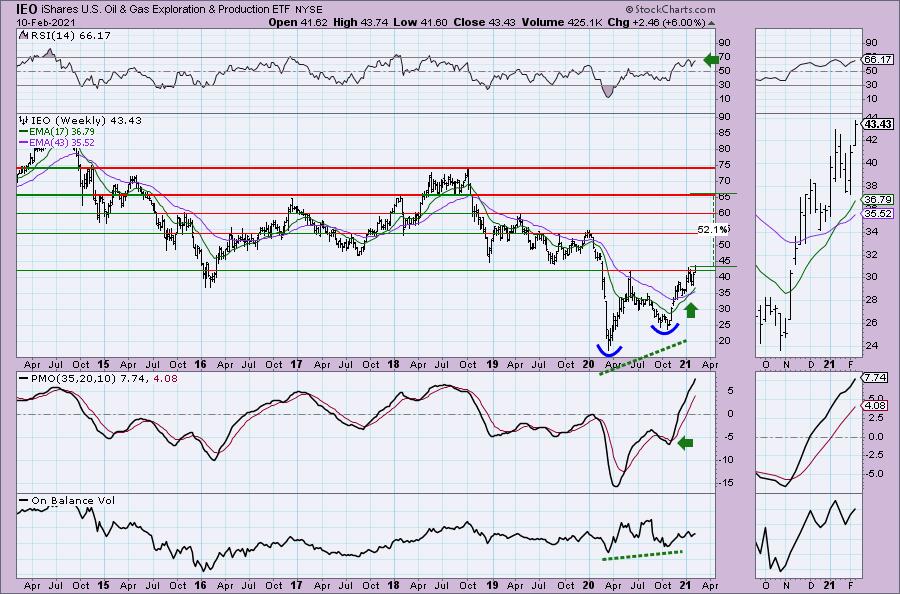
The weekly chart is very bullish. The RSI is positive and the PMO is rising. The OBV is confirming. I like the double-bottom pattern that is technically executing this week with the breakout above the June top. Minimum upside target of that pattern takes us right to overhead resistance at the 2016 and early 2018 tops.
Don't forget, on Thursdays I look at reader-requested symbols, so shoot me an email at erin@decisionpoint.com. I read every email I receive and try to answer them all!
Oneok, Inc. (OKE)
EARNINGS: 2/22/2021 (AMC)
ONEOK, Inc. engages in gathering, processing, fractionating, transporting, storing, and marketing of natural gas. It operates through the following segments: Natural Gas Gathering and Processing, Natural Gas Liquids, and Natural Gas Pipelines. The Natural Gas Gathering and Processing segment offers midstream services to producers in North Dakota, Montana, Wyoming, Kansas and Oklahoma. The Natural Gas Liquids segment owns and operates facilities that gather, fractionate, treat and distribute NGLs and store NGL products, primarily in Oklahoma, Kansas, Texas, New Mexico and the Rocky Mountain region, which includes the Williston, Powder River and DJ Basins, where it provides midstream services to producers of NGLs and deliver those products to the two primary market centers, one in the Mid-Continent in Conway, Kansas, and the other in the Gulf Coast in Mont Belvieu, Texas. The Natural Gas Pipelines segment provides transportation and storage services to end users. The company was founded in 1906 and is headquartered in Tulsa, OK.
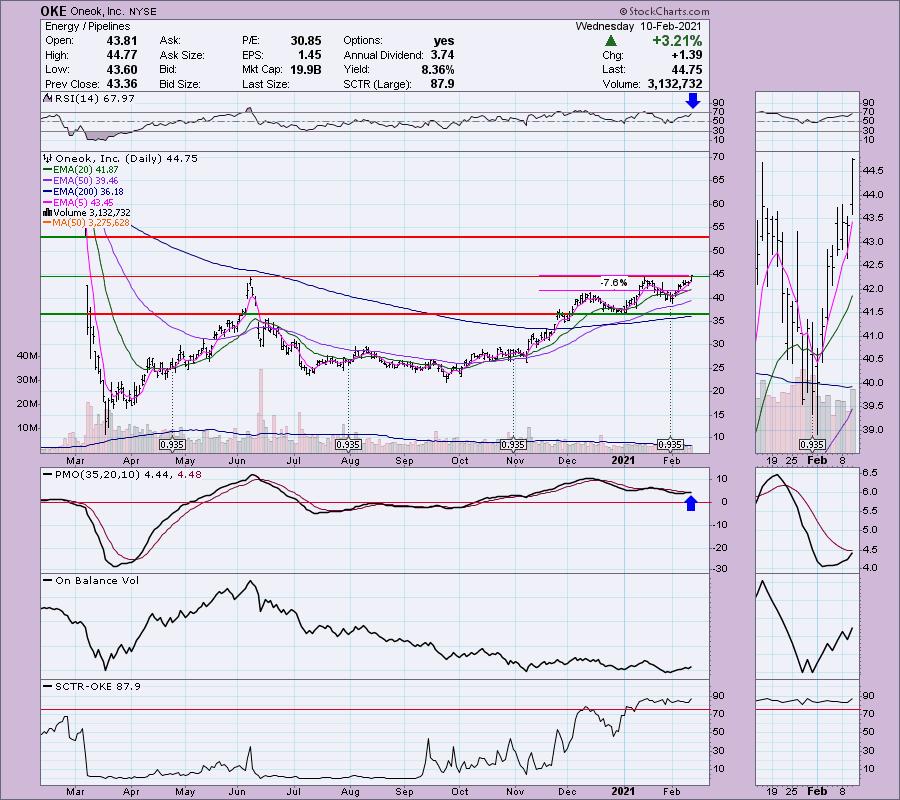
OKE was down -0.25% in after hours trading. OKE broke out today and closed at a high not seen since the middle of the bear market. The PMO is about to trigger a crossover BUY signal and the RSI is positive and not yet overbought. I've set the stop at the December top.
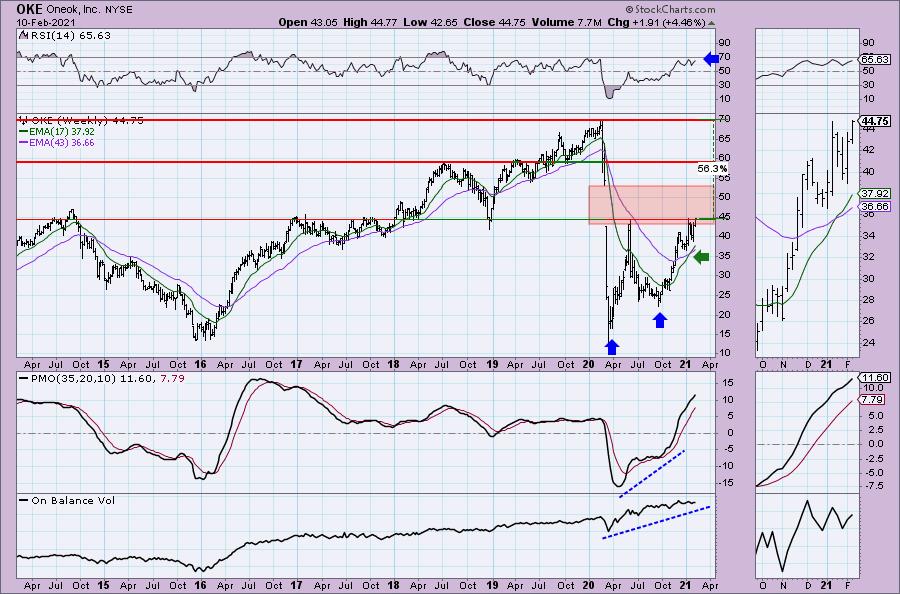
Now that price is breaking out, it will need to make another run at closing the major gap that was created on the way down during the bear market. The chart is favorable with a positive RSI and rising PMO. The OBV is mostly confirming the rally. I just don't like to see that much volume coming in and an inability to rival the prices it was carrying at the top of the bull market. Despite heavy volume, price didn't get that far.
Zions Bancorp (ZION)
EARNINGS: 4/19/2021 (AMC)
Zions Bancorporation is one of the nation's premier financial services companies with total assets exceeding $70 billion. Zions operates under local management teams and distinct brands in 11 western states: Arizona, California, Colorado, Idaho, Nevada, New Mexico, Oregon, Texas, Utah, Washington and Wyoming. The company is a national leader in Small Business Administration lending and public finance advisory services, and is a consistent top recipient of Greenwich Excellence awards in banking. In addition, Zions is included in the S&P 500 and NASDAQ Financial 100 indices.
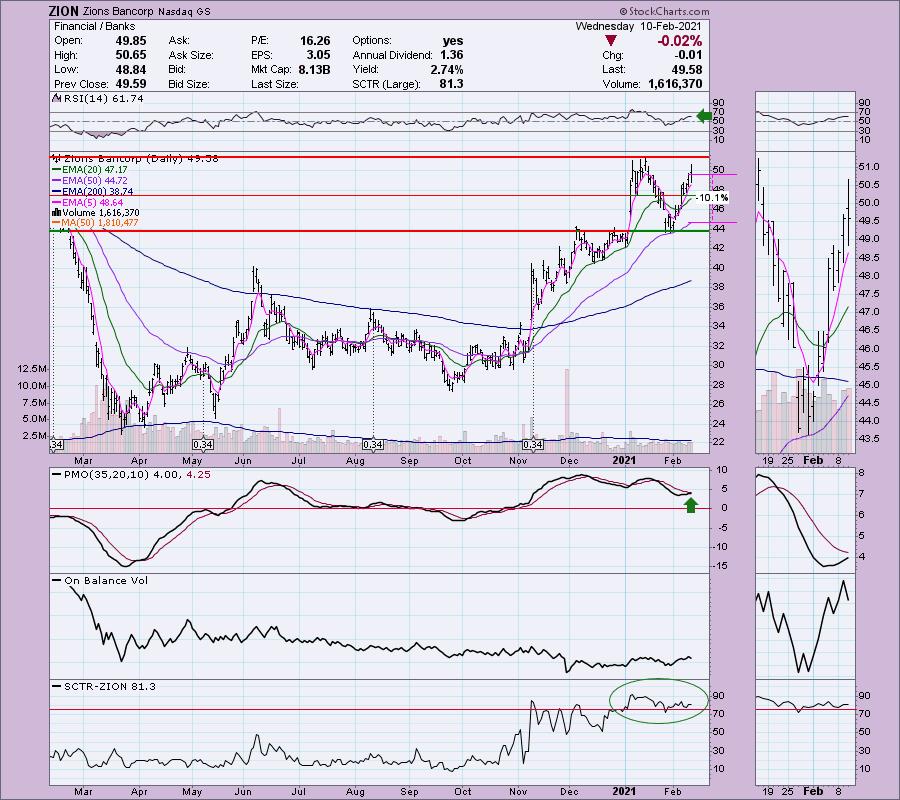
ZION is unchanged in after hours trading. I had quite a few banks to choose from, but something about this chart called to me. The PMO is rising toward a new crossover BUY signal. The OBV is confirming the rally with rising bottoms. The RSI is poised right in the middle of positive territory, not overbought. The stop level is rather hefty. If it should lose the 20-EMA, it may be time to unload it as that would form an ominous double-top.
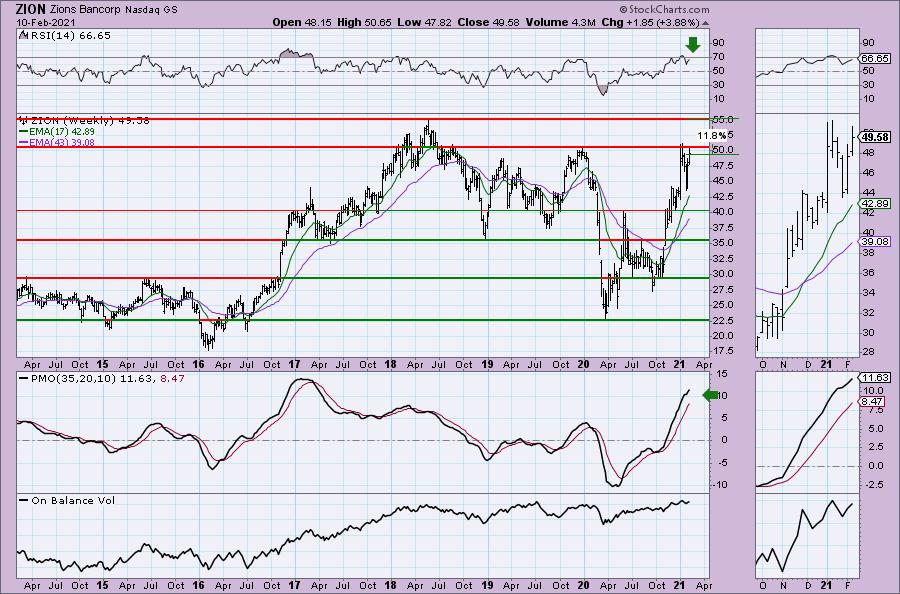
The weekly PMO is rising and not overbought. Price is struggling with overhead resistance here, but if successful, it should gain at least 11.5% to test the all-time high.
Full Disclosure: I'm about 80% invested and 20% is in 'cash', meaning in money markets and readily available to trade with. No new entries and no stops executed for my portfolio.
Current Market Outlook:
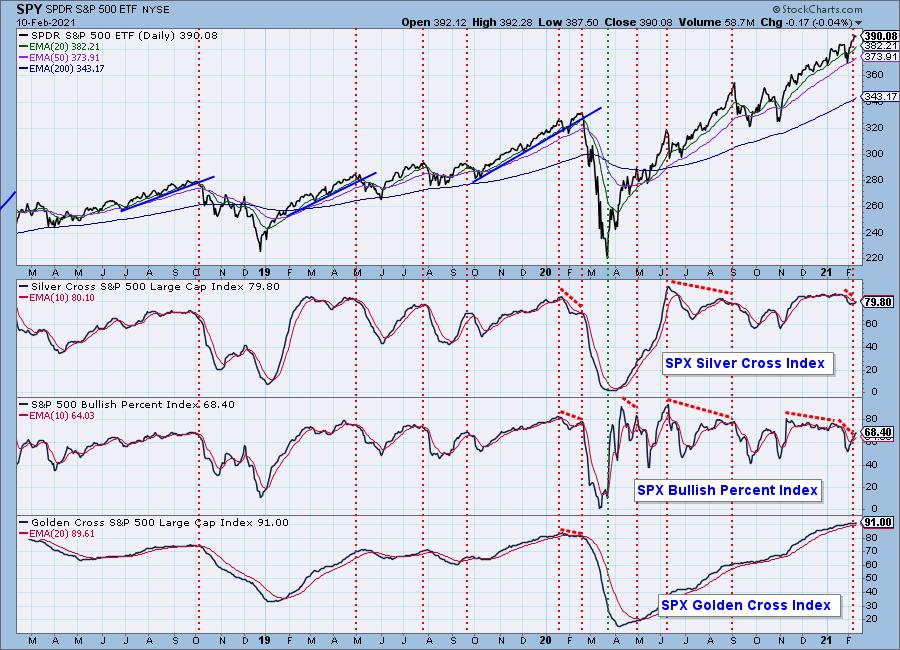
Market Environment: It is important to consider the odds for success by assessing the market tides. The following chart uses different methodologies for objectively showing the depth and trend of participation for intermediate- and long-term time frames.
- The Silver Cross Index (SCI) shows the percentage of SPX stocks on IT Trend Model BUY signals (20-EMA > 50-EMA)
- The Golden Cross Index (GCI) shows the percentage of SPX stocks on LT Trend Model BUY signals (50-EMA > 200-EMA)
- The Bullish Percent Index (BPI) shows the percentage of SPX stocks on Point & Figure BUY signals.
Don't forget that as a "Diamonds" member, you have access to our GCI/SCI curated ChartList on DecisionPoint.com. You'll find it under "Members Only" links on the left side on the Blogs and Links Page.
Here is the current chart:
Diamond Index:
- Diamond Scan Results: 75
- Diamond Dog Scan Results: 3
- Diamond Bull/Bear Ratio: 25.00
Technical Analysis is a windsock, not a crystal ball.
Happy Charting!
- Erin
erin@decisionpoint.com
Watch the latest episode of DecisionPoint with Carl & Erin Swenlin on Mondays 7:00p EST or on the DecisionPoint playlist on the StockCharts TV YouTube channel here!
NOTE: The stocks reported herein are from mechanical trading model scans that are based upon moving average relationships, momentum and volume. DecisionPoint analysis is then applied to get five selections from the scans. The selections given should prompt readers to do a chart review using their own analysis process. This letter is not a call for a specific action to buy, sell or short any of the stocks provided. There are NO sure things or guaranteed returns on the daily selection of "diamonds in the rough."
Helpful DecisionPoint Links:
DecisionPoint Shared ChartList and DecisionPoint Chart Gallery
Price Momentum Oscillator (PMO)
Swenlin Trading Oscillators (STO-B and STO-V)
For more links, go to DecisionPoint.com!f