
Yesterday's "Diamond of the Week" for Your Daily Five as well as the DecisionPoint Show is not fairing well right now, Cleveland Cliffs (CLF). I still like the Steel industry group as well as Aluminum so I found a better candidate to take advantage of that strength. I don't believe it is over for CLF, it just had its legs cut out from under it today which means a better entry if you're still interested in it.
I had five Banks come up in my scans today. Banks have been rallying and I believe there is enough momentum to exploit that group. I picked the one I liked best, but you may want to peruse the charts of your favorite bank stocks and ETFs.
Industrials and Energy sectors are still performing well so I've included a selection from each. Finally, I have a Specialty Retailer with a very interesting chart setup.
Today's "Diamonds in the Rough" are: AN, BPOP, FANG, RS and TRTN.
 Diamond Mine Registration Information:
When: Feb 12, 2021 09:00 AM Pacific Time (US and Canada)
Register in advance for this webinar:
https://zoom.us/webinar/register/WN_45P3AHvzSyeaUcNy3nZKPQ
After registering, you will receive a confirmation email containing information about joining the webinar, including the password. ===============================================================================
Recording Link:
Topic: DecisionPoint Diamond Mine (2/5/2021) LIVE Trading Room
Access Passcode: 2vi+nYV*

It's Free!
***Click here to register for this recurring free DecisionPoint Trading Room on Mondays at Noon ET!***
+++++++++++++++++++++++++++++++++++++++++++++++++++++++++++++++++++++++++++++++
Here is the information for the Monday 2/8/2021 recording:
Topic: DecisionPoint Trading Room
Meeting Recording:
https://zoom.us/rec/share/nwbGIyGJQch_e4JlI8Rw0-d0RtpjUDAByiD5mt3cD5nDBVZpURlT7RcARS3870FU.qRofBCbCSjetBkBU
Access Passcode: H!2B$fn3
For best results, copy and paste the access code to avoid typos.
Welcome to DecisionPoint Daily Diamonds, wherein I highlight five "diamonds in the rough." These are selected from the results of my DecisionPoint scans, which search for stocks that could benefit from the trend and condition of the market. Remember, these are not recommendations to buy or sell, but are the most interesting of the stocks that surfaced in my scans. My objective is to save you the work of the initial, tedious culling process, but you need to apply your own analysis to see if these stocks pique your interest as well. There are no guaranteed winners here!
Autonation, Inc. (AN)
EARNINGS: 2/16/2021 (BMO)
AutoNation, Inc. engages in the provision of automotive products and services. It operates through the following segments: Domestic, Import, Premium Luxury, and Corporate & Other. The Domestic segment comprises retail automotive franchises that sell new vehicles manufactured by General Motors, Ford and Chrysler. The Import segment includes retail automotive franchises that sell new vehicles manufactured primarily by Toyota, Honda, and Nissan. The Premium Luxury segment consists of retail automotive franchises that sell new vehicles manufactured primarily by Mercedes-Benz, BMW, Audi, and Lexus. The Corporate & Other segment involves in the collision centres, auction operations and stand-alone used vehicle sales and service centres. The company was founded by Steven Richard Berrard and Harry Wayne Huizenga Sr. in 1991 and is headquartered in Fort Lauderdale, FL.
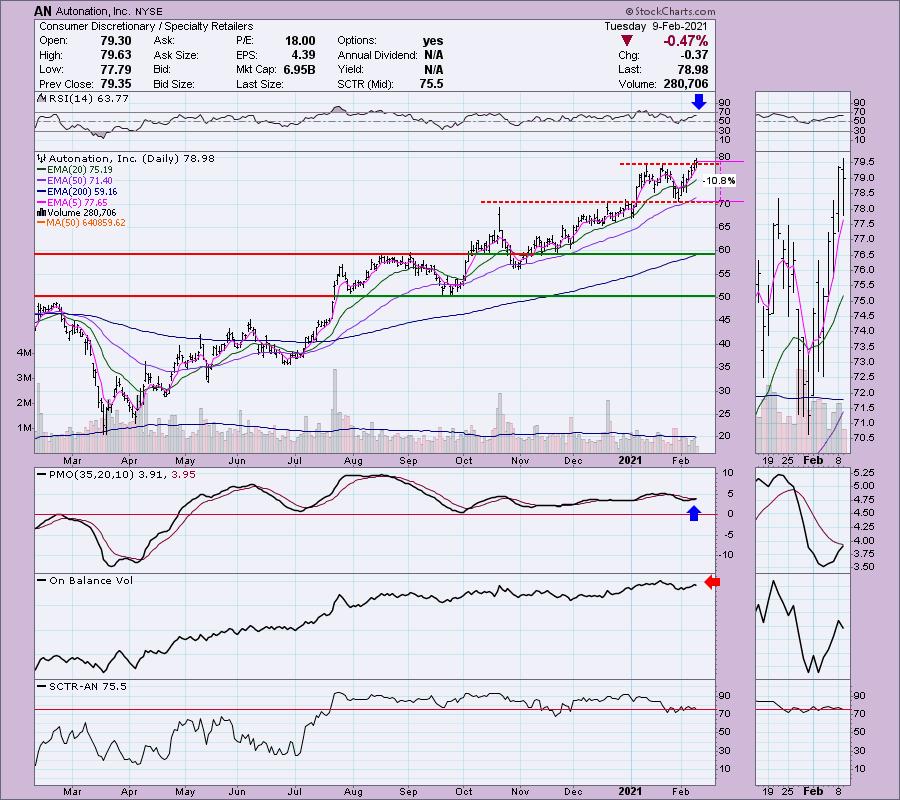
AN is unchanged in after hours trading. I covered AN in the October 14th 2020 Diamonds Report. It nearly hit its $55 stop level, but after correcting on the 50-EMA it reversed and is currently up 30.1% since then. It is breaking out right now. It is so far holding above the January tops. The PMO is about to trigger a crossover BUY signal. The RSI is positive and not overbought. The only negative would be a slight negative divergence with the OBV. The stop level is obvious at the January low.
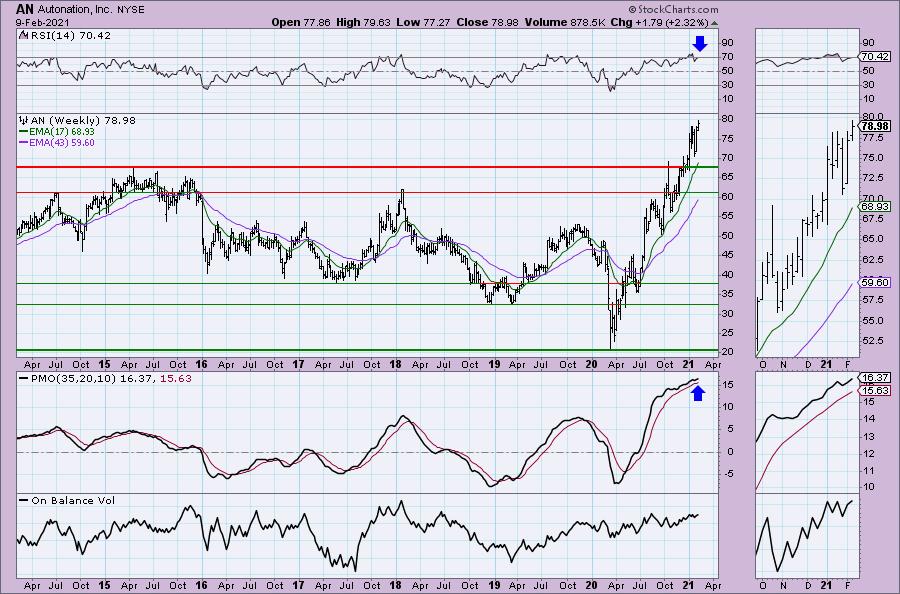
The weekly PMO and weekly RSI are both overbought, but I like the PMO bottom above the signal line. It's making new all-time highs. I notice that we don't really have an OBV negative divergence on the weekly chart.
Popular, Inc. (BPOP)
EARNINGS: 4/29/2021 (BMO)
Popular, Inc. is a holding company, which engages in the provision of banking and financial services. It operates through the Banco Popular de Puerto Rico and Popular U.S. segments. The Banco Popular de Puerto Rico segment includes retail, mortgage, and commercial banking services through banking subsidiary. The Popular U.S. segment represents operations of the retail branch network in the U.S. mainland under the name of Popular. The company was founded on October 5, 1893 and is headquartered in San Juan, Puerto Rico.
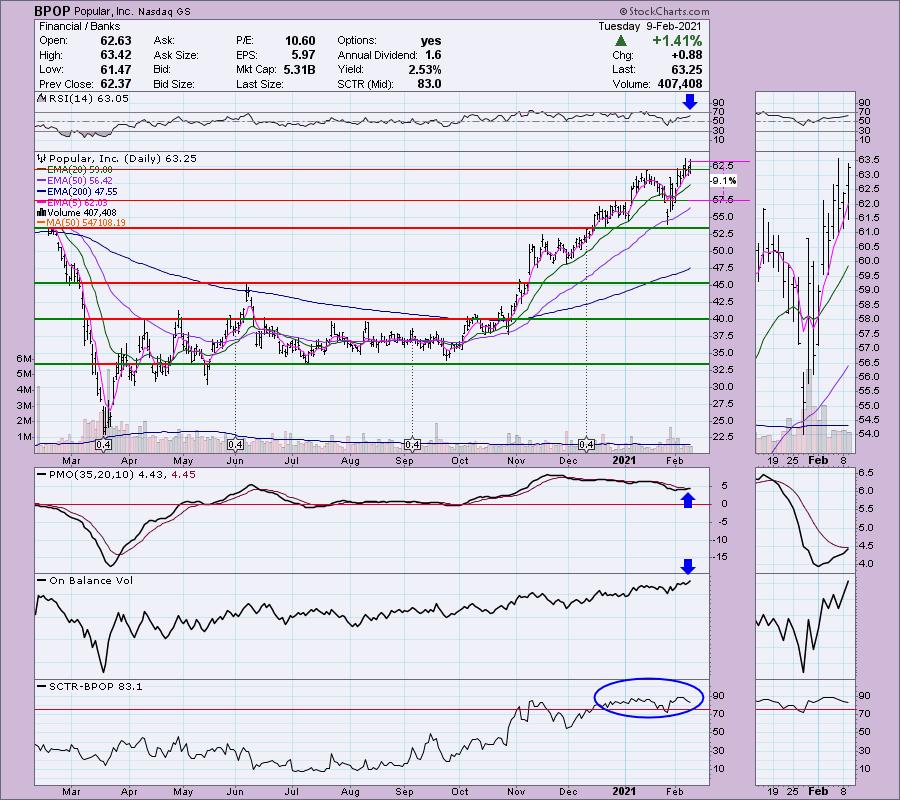
BPOP is currently unchanged in after hours trading. Price broke out last week. The PMO is ready to trigger a crossover BUY signal. The RSI is positive and not overbought. It has a respectable SCTR. Notice that the OBV is confirming these new highs as it sets new highs for itself. The stop level puts you below the 20-EMA at the December tops.
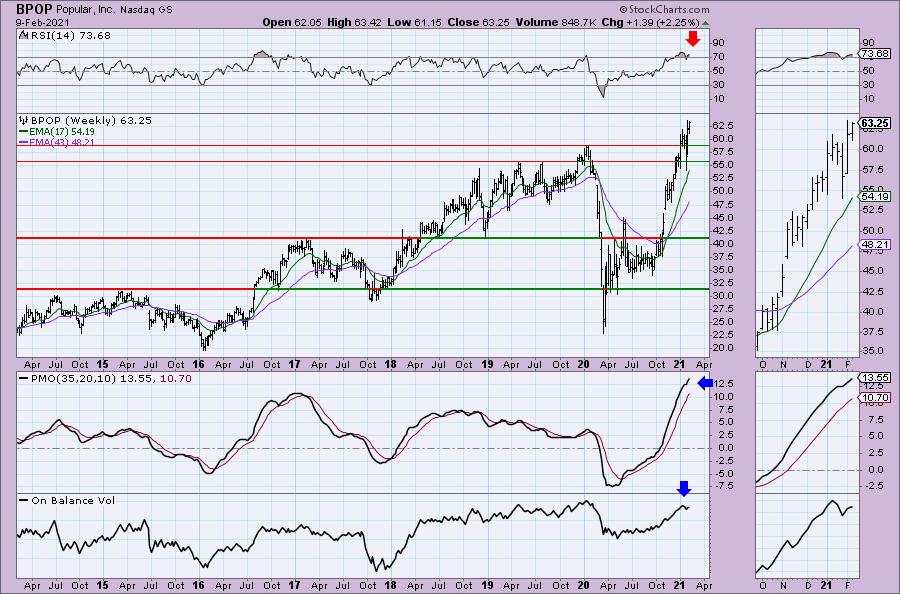
The weekly chart is bullish with a rising PMO and positive RSI. Both are on the overbought side, but ultimately in positive territory which is acceptable. I'm not thrilled with the long-term negative divergence on the OBV which did not surpass its 2020 top as price did.
Diamondback Energy, Inc. (FANG)
EARNINGS: 2/22/2021 (AMC)
Diamondback Energy, Inc. is an independent oil and natural gas company, which engages in the acquisition, development, exploration and exploitation of unconventional, onshore oil and natural gas reserves. It operates through the Upstream and Midstream Services segments. The Upstream segment focuses on the Permian Basin operations in West Texas. The Midstream Services segment involves in the Midland and Delaware Basins. The company was founded in December 2007 and is headquartered in Midland, TX.
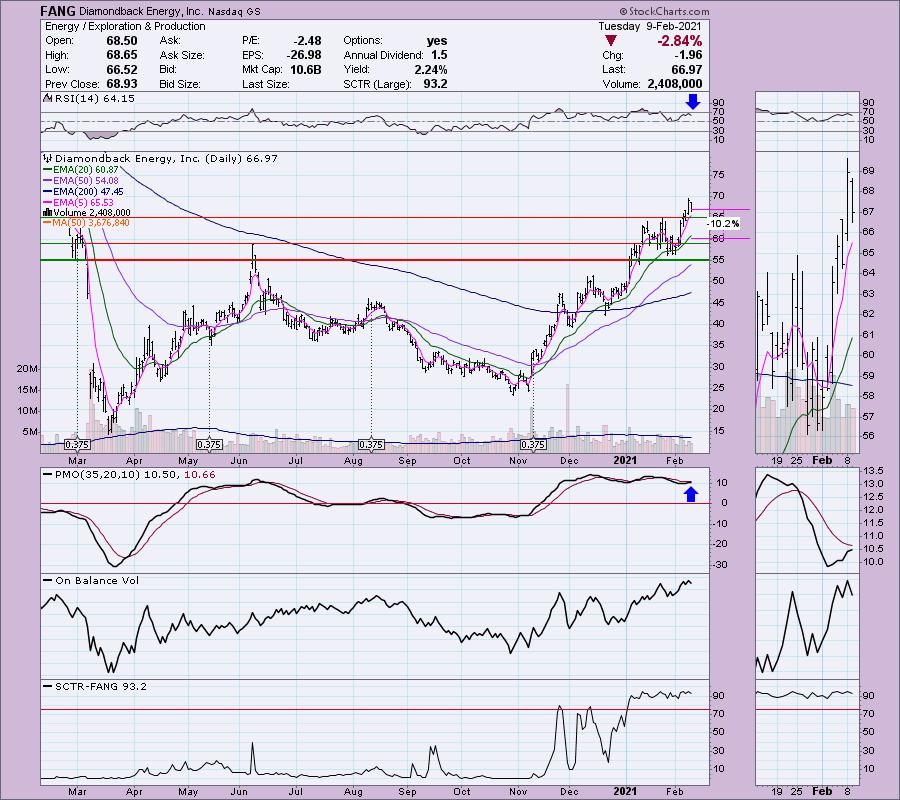
I love the symbol for this stock! So clever! Currently FANG is up slightly +0.03% in after hours trading. I liked this chart primarily for the big pullback today. Price had recently broken out and this was a constructive pullback that has kept the RSI from reaching overbought territory. The PMO was barely damaged which tells me there is internal strength. The SCTR is healthy and the OBV is confirming the rally with rising bottoms, including a breakout that occurred when price broke out. The stop would be exceptionally deep in order to set it at $55, so I opted to set it below the 20-EMA, you could take it a bit deeper to the early January top.
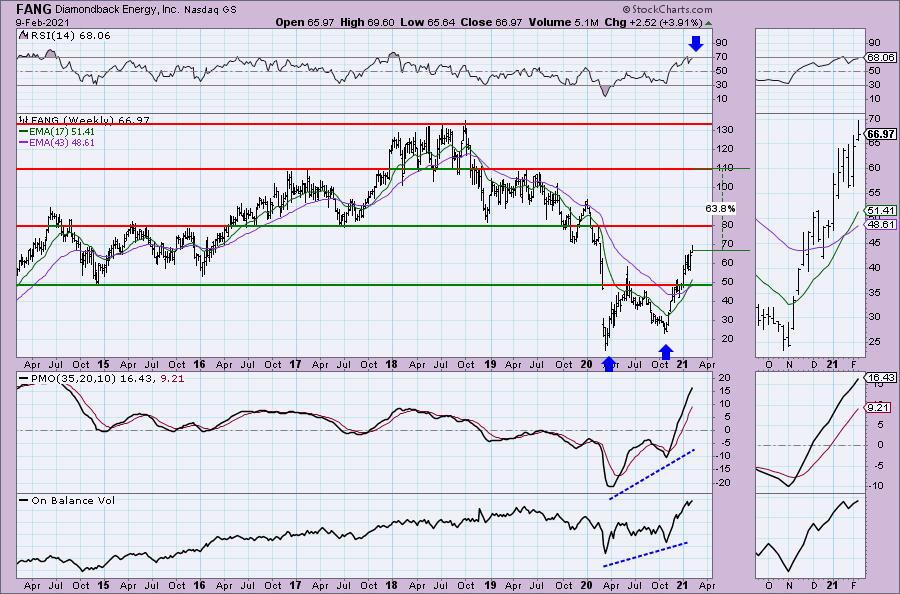
I like the weekly chart. We have a large bullish double-bottom that recently executed with a breakout above the confirmation line at the mid-2020 top. The minimum upside target of the pattern would take you almost exactly to overhead resistance at the 2019 tops.
Don't forget, on Thursdays I look at reader-requested symbols, so shoot me an email at erin@decisionpoint.com. I read every email I receive and try to answer them all!
Reliance Steel & Aluminum (RS)
EARNINGS: 2/18/2021 (BMO)
Reliance Steel & Aluminum Co. engages in the provision of metals processing services and distribution of metal products. It offers alloy, aluminum, brass, copper, carbon steel, stainless steel, titanium, and specialty steel products. The company was founded by Thomas J. Neilan on February 3, 1939 and is headquartered in Los Angeles, CA.
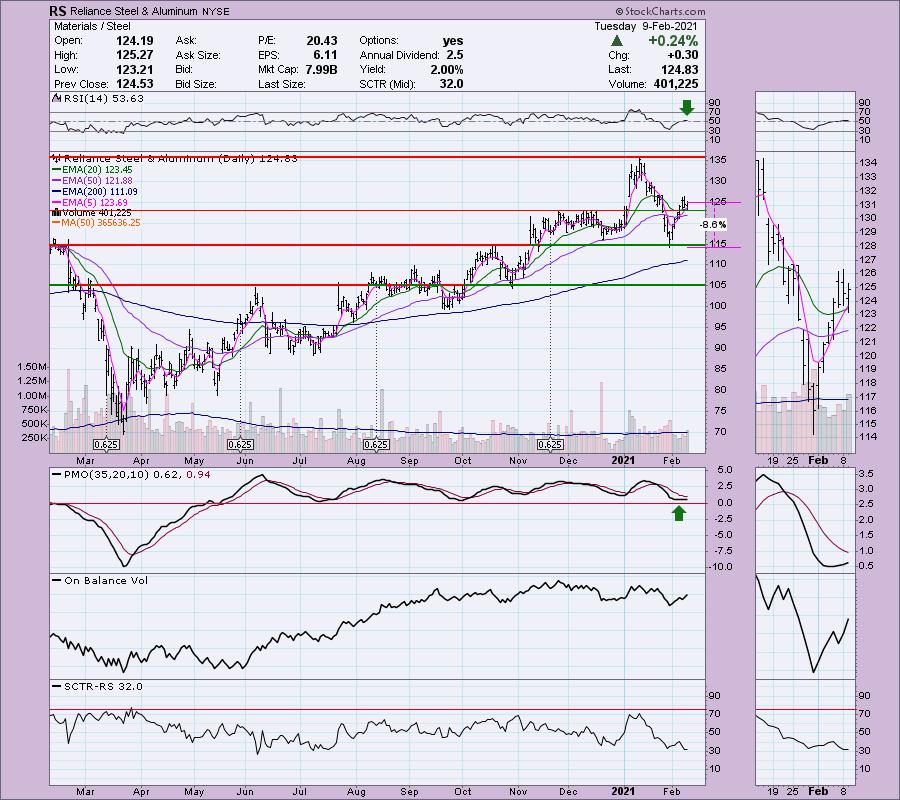
This is the stock in the Materials sector that might be an excellent alternate to Cleveland-Cliffs (CLF). I like that it is in both the steel and aluminum businesses. Recall those are the two industry groups within Materials that I'm watching most closely. The RSI just turned positive and today the 5-EMA crossed above the 20-EMA, triggering a ST Trend Model BUY signal. The PMO has finally turned up. It did so above the zero line which is bullish. I'd like a better SCTR, but it was beat down quite a bit in January. Price popped above the December tops and remains there. Volume is coming in. The stop is reasonable, set at the intraday low from January.
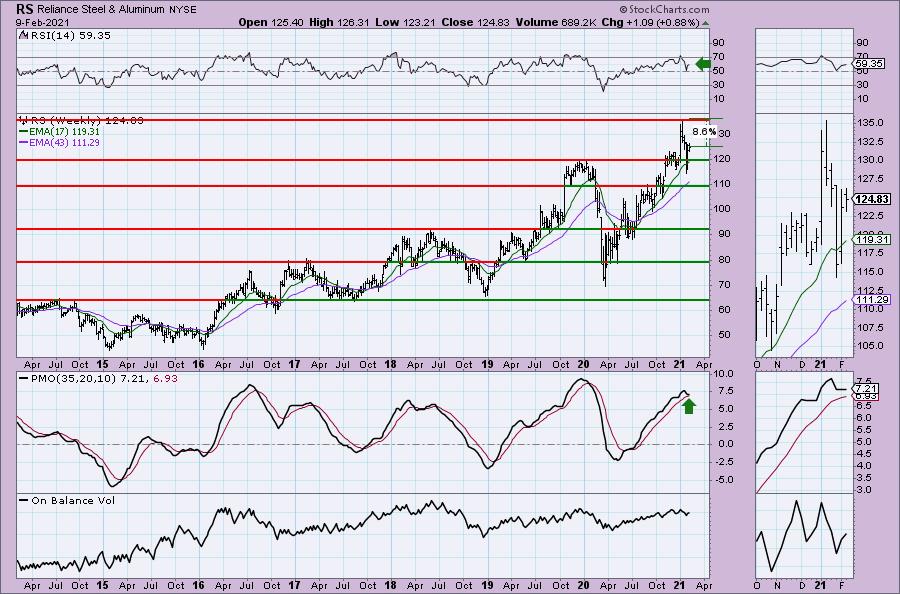
The weekly chart is intriguing with a positive and not overbought RSI. The PMO has been a little twitchy, but it appears ready to turn back up. It is overbought, but not extremely so. The OBV is mostly confirming the rally out of the bear market low.
Triton International Ltd. (TRTN)
EARNINGS: 2/16/2021 (BMO)
Triton International Ltd. is engaged in the operation and management of fleet of intermodal marine dry, refrigerated, and cargo containers. It operates through the Equipment Leasing and Equipment Trading segments. The Equipment Leasing segment involves in owning, leasing, and disposing containers and chassis from lease fleet, as well as managing containers owned by third parties. The Equipment Trading segment focuses on the purchase containers from shipping line customers, and other sellers of containers, and resells containers to container retailers and users of containers for storage or one-way shipment. The company was founded on September 29, 2015 and is headquartered in Hamilton, Bermuda.
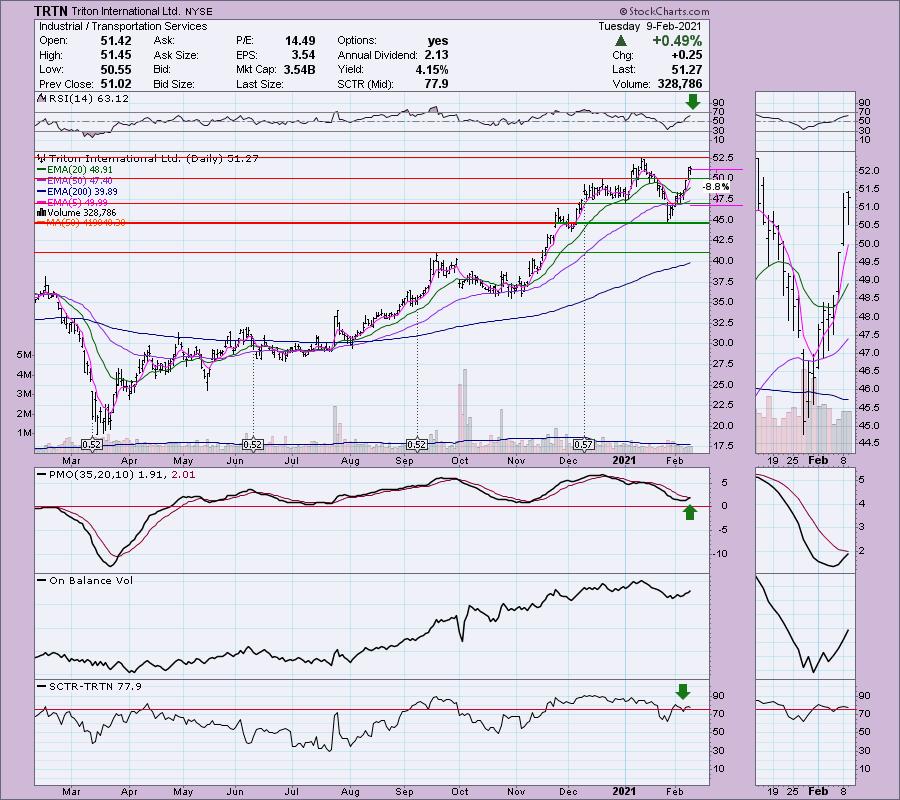
The Industrial sector has been showing strength. TRTN is down -0.51% in after hours trading. That would still put it above support at the December tops. The PMO is nearing a new crossover BUY signal. The RSI is positive and not overbought. I'd like to see more volume to get the OBV closer to its previous top. There's still some time. The SCTR is back in the "hot zone" above 75.
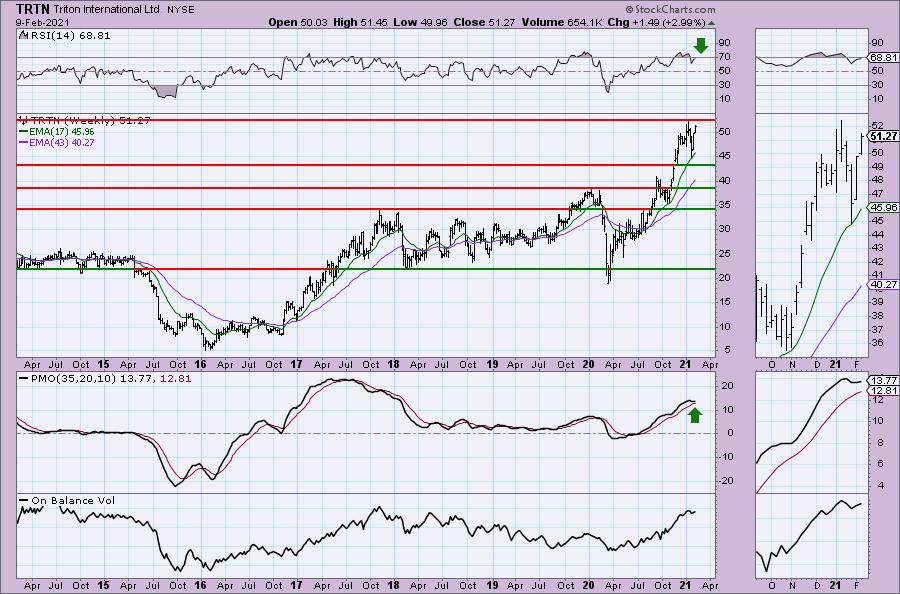
The weekly PMO is bottoming above its signal line which is especially bullish. It is not overbought. The RSI is positive and not quite overbought. My expectation is a breakout to new all-time highs.
Full Disclosure: I'm about 80% invested and 20% is in 'cash', meaning in money markets and readily available to trade with. I sold one of my old positions and I did get BOIL to increase my exposure to natural gas, but it will be a very short-term position. I'll be looking for entry in RS tomorrow.
Current Market Outlook:
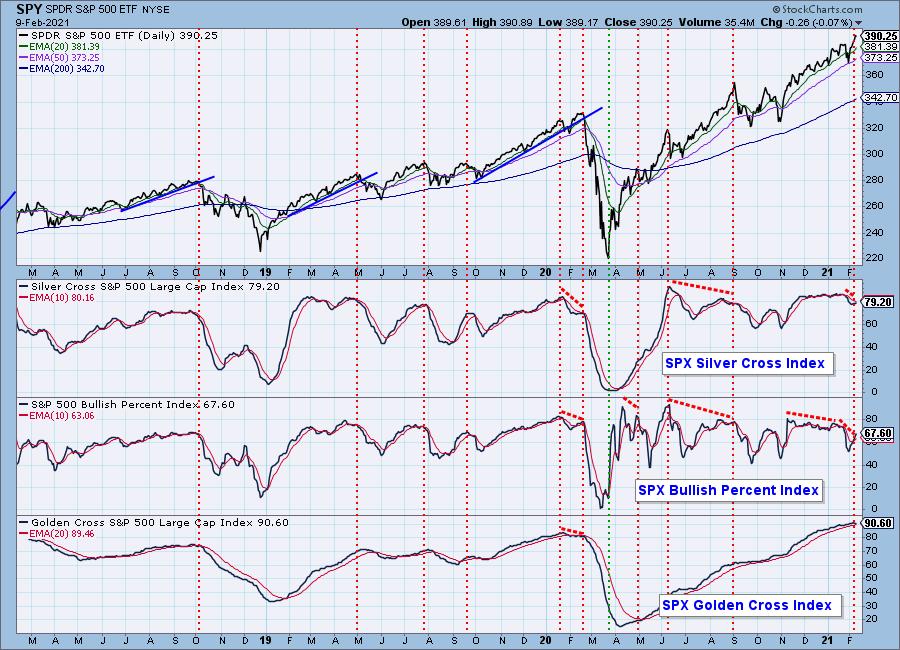
Market Environment: It is important to consider the odds for success by assessing the market tides. The following chart uses different methodologies for objectively showing the depth and trend of participation for intermediate- and long-term time frames.
- The Silver Cross Index (SCI) shows the percentage of SPX stocks on IT Trend Model BUY signals (20-EMA > 50-EMA)
- The Golden Cross Index (GCI) shows the percentage of SPX stocks on LT Trend Model BUY signals (50-EMA > 200-EMA)
- The Bullish Percent Index (BPI) shows the percentage of SPX stocks on Point & Figure BUY signals.
Don't forget that as a "Diamonds" member, you have access to our GCI/SCI curated ChartList on DecisionPoint.com. You'll find it under "Members Only" links on the left side on the Blogs and Links Page.
Here is the current chart:
Diamond Index:
- Diamond Scan Results: 91
- Diamond Dog Scan Results: 3
- Diamond Bull/Bear Ratio: 30.33
I'm in the process of trying to plot the Diamond Index, but with time at a premium, it is on the back burner.
Technical Analysis is a windsock, not a crystal ball.
Happy Charting!
- Erin
erin@decisionpoint.com
Watch the latest episode of DecisionPoint with Carl & Erin Swenlin on Mondays 7:00p EST or on the DecisionPoint playlist on the StockCharts TV YouTube channel here!
NOTE: The stocks reported herein are from mechanical trading model scans that are based upon moving average relationships, momentum and volume. DecisionPoint analysis is then applied to get five selections from the scans. The selections given should prompt readers to do a chart review using their own analysis process. This letter is not a call for a specific action to buy, sell or short any of the stocks provided. There are NO sure things or guaranteed returns on the daily selection of "diamonds in the rough."
Helpful DecisionPoint Links:
DecisionPoint Shared ChartList and DecisionPoint Chart Gallery
Price Momentum Oscillator (PMO)
Swenlin Trading Oscillators (STO-B and STO-V)
For more links, go to DecisionPoint.com!f