
I ran my Momentum Sleepers scan and today found some appealing bottom fish charts. I believe these will be able to weather the likely decline ahead. They're doing well right now and the market is down. I do caution and will caution in my write-ups the risks that are involved in tapping into beat down stocks right now. This is why you'll see most of them have tighter than normal stops. If you're getting in right now, I'd set my stop right after I hit the "trade" button.
Pharma was prominent in today's scan and although I'm not thrilled with the performance of that sector and industry group, these stocks had charts I couldn't pass up. You may be surprised to see beat down Pfizer on the list, but today's breakout is intriguing.
Don't forget to send in your symbol requests for tomorrow's report!
Feeling some relief now that all three of my presentations/webinars are complete! Never will I sign up for that many in such a short time. Now I can take those ads out of the reports, yay! Thanks to all who registered. I hope enjoy the recordings that will be sent to all registrants of all of these webinars!
Today's "Diamonds in the Rough" are: DD, PASG, PFE, PKG and TAK.
 Diamond Mine Registration Information:
When: Mar 5, 2021 09:00 AM Pacific Time (US and Canada)
Topic: DecisionPoint Diamond Mine (3/5/2021) LIVE Trading Room
Register in advance for this webinar:
https://zoom.us/webinar/register/WN_OFnLCP7ZShOerDECNrb-TA
After registering, you will receive a confirmation email containing information about joining the webinar, including the password.
=======================================================================
Recording Link:
Topic: DecisionPoint Diamond Mine (02/26/2021) LIVE Trading Room
Start Time : Feb 26, 2021 08:58 AM
Meeting Recording:
Access Passcode: Ft7Uq!&+
***Click here to register for this recurring free DecisionPoint Trading Room on Mondays at Noon ET!***
+++++++++++++++++++++++++++++++++++++++++++++++++++++++++++++++++++++++++++++++
DAVID KELLER joined me for the last DP Trading Room on March 1st. Below you'll find the recording link. We had a great time discussing the markets and the various symbol requests.
RECORDING LINK:
Topic: DecisionPoint Trading Room
Start Time : Mar 1, 2021 09:00 AM
Meeting Recording:
Access Passcode: tdd*4nNS
For best results, copy and paste the access code to avoid typos.
Welcome to DecisionPoint Daily Diamonds, wherein I highlight five "diamonds in the rough." These are selected from the results of my DecisionPoint scans, which search for stocks that could benefit from the trend and condition of the market. Remember, these are not recommendations to buy or sell, but are the most interesting of the stocks that surfaced in my scans. My objective is to save you the work of the initial, tedious culling process, but you need to apply your own analysis to see if these stocks pique your interest as well. There are no guaranteed winners here!
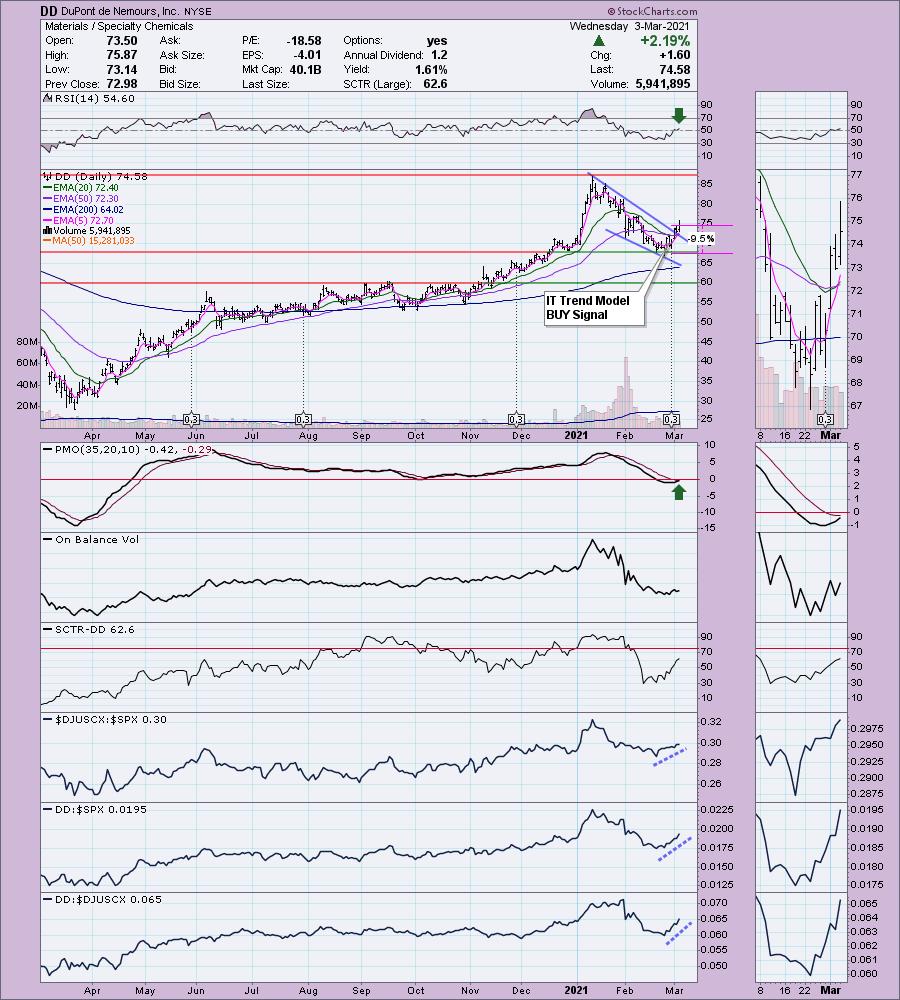
DuPont de Nemours, Inc. (DD)
EARNINGS: 5/4/2021 (BMO)
DuPont de Nemours, Inc. operates as a holding company, which engages in the development of specialty materials, chemicals, and agricultural products. It operates through the following segments: Electronics & Imaging, Nutrition & Biosciences, Transportation & Industrial, Safety & Construction, and Non-Core. The Electronics & Imaging segment provides permanent and process chemistries for the fabrication of printed circuit boards to include laminates and substrates, electroless and electrolytic metallization solutions, as well as patterning solutions and materials and innovative metallization processes for metal finishing, decorative, and industrial applications. The Nutrition & Biosciences segment provides solutions for the global food and beverage, dietary supplements, pharma, home and personal care, energy and animal nutrition markets. The Transportation & Industrial segment engineering resins, adhesives, silicones, lubricants and parts to engineers and designers in the transportation, electronics, healthcare, industrial and consumer end-markets to enable systems solutions for demanding applications and environments. The Safety & Construction segment provides engineering products and integrated systems for a number of industries including, worker safety, water purification and separation, aerospace, energy, medical packaging and building materials. The Non-Core segment supplier of key materials for the manufacturing of photovoltaic cells and panels, including SOLAMET metallization pastes, TEDLAR backsheet materials, and FORTASUN silicone encapsulants and adhesives. The company was founded in 1897 and is headquartered in Wilmington, DE.
DD is down slightly -0.03% in after hours trading. I probably like this daily chart the best today. It's slightly risky as we don't have a PMO BUY signal yet, but the breakout from the bullish falling wedge accompanied by a new IT Trend Model BUY signal is enticing. An IT Trend Model BUY signal is triggered when the 20-EMA crosses above the 50-EMA. DD also triggered a ST Trend Model BUY signal as the 5-EMA crossed above the 20-EMA. The RSI has just moved into positive territory above net neutral (50). The SCTR is improving. This is in an industry and sector I like. You can see outperformance in every way. I set the stop just below resistance at the February lows. Given this chart has a bullish bias (50-EMA > 200-EMA), I would expect a continuation of this rally.
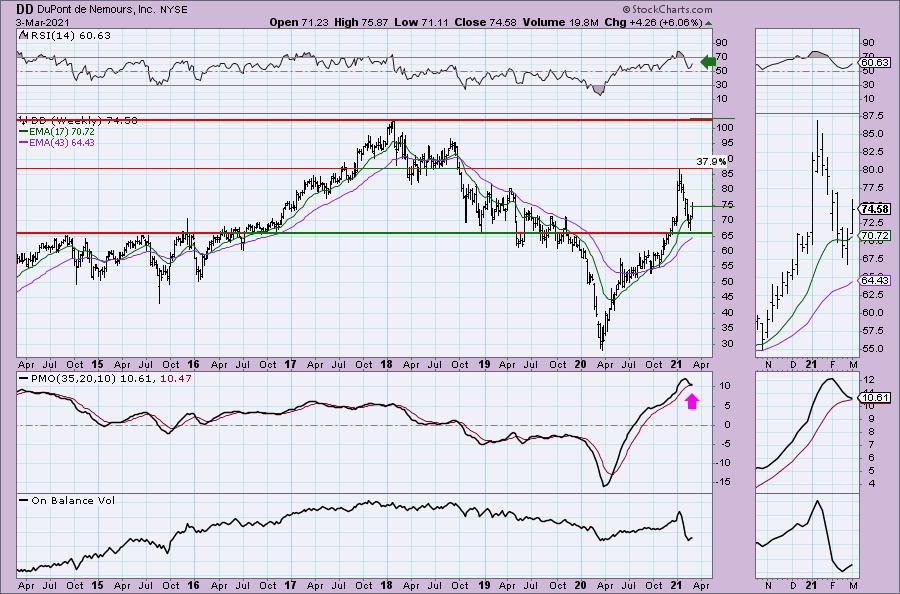
The price reversal came right on strong support. The RSI is no longer overbought on this correction. The PMO isn't good, but we still have the crossover BUY signal and it is decelerating.
Passage Bio Inc. (PASG)
EARNINGS: 3/3/2021 (BMO) Reported today.
Passage Bio, Inc. operates as a genetic medicines company. It focuses on developing transformative therapies for rare, monogenic central nervous system disorders with limited or no approved treatment options. The company assembles a portfolio of genetic medicine products, which includes PBGM01 for the treatment of GM1, PBFT02 for the treatment of FTD and PBKR03 for the treatment of Krabbe disease. Passage Bio was founded by Stephen P. Squinto, Tadataka Yamada, David A. Socks, Aditya Kohli, and James M. Wilson in July 2017 and is headquartered in Philadelphia, PA.
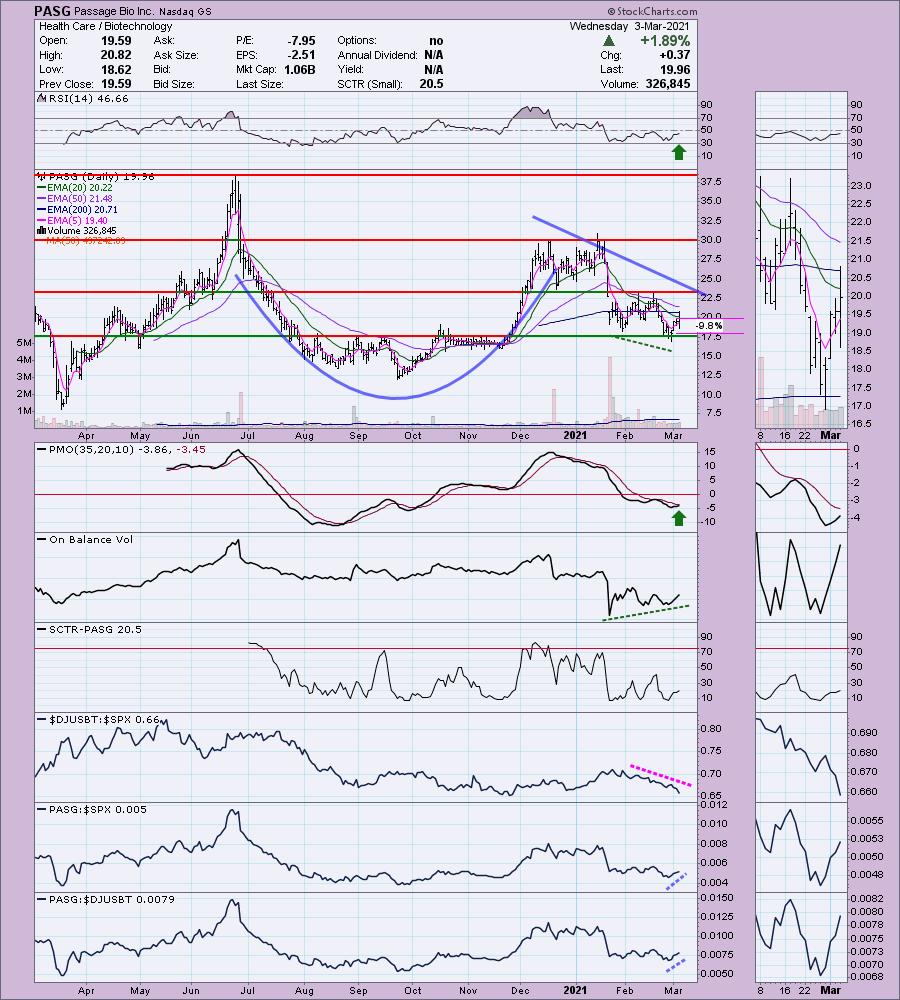
PASG is unchanged in after hours trading. They reported earnings today. There are few things that stuck out to me when I looked at this one in the CandleGlance (view that I use to select my five). First, price bounced off an area of strong support and second it was nearing a PMO BUY signal. When I looked at the whole chart, I was convinced to include it despite being in an industry group that has been languishing. Yet, PASG is outperforming the SPX and the group. The OBV has a beautiful positive divergence leading into this current rally. This one still has a bullish bias given the 50-EMA > 200-EMA and an intermediate-term bullish cup and handle pattern. Given this, I opted to set a deeper stop. You could set it lower to reach the second bottom, I just don't want an 11% stop level.
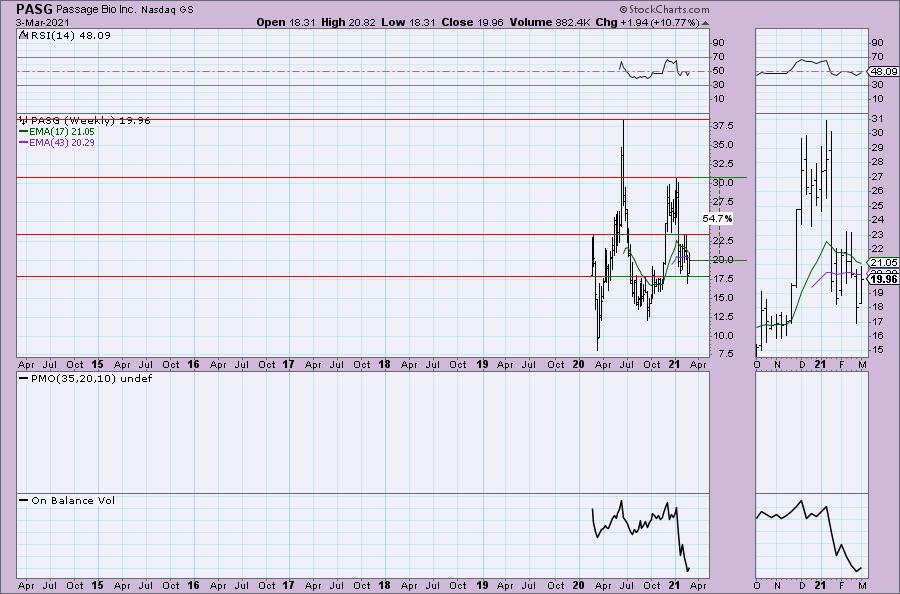
We don't have enough data for a weekly PMO, but the RSI is making its way toward positive territory.
Pfizer, Inc. (PFE)
EARNINGS: 4/27/2021 (BMO)
Pfizer Inc. engages in the discovery, development, and manufacture of healthcare products specializes in medicines, vaccine, and consumer healthcare. It operates through the Pfizer Innovative Health (IH) and Pfizer Essential Health (EH) segments. The IH segment focuses on the development and commercializing medicines and vaccines for internal medicine, oncology, inflammation and immunology, rate disease, and consumer healthcare. The EH segment is involved in development and supply of branded generics, generic sterile injectable products, biosimilars, and select branded products including anti-infectives. The company was founded by Charles Pfizer Sr. and Charles Erhart in 1849 and is headquartered in New York, NY.
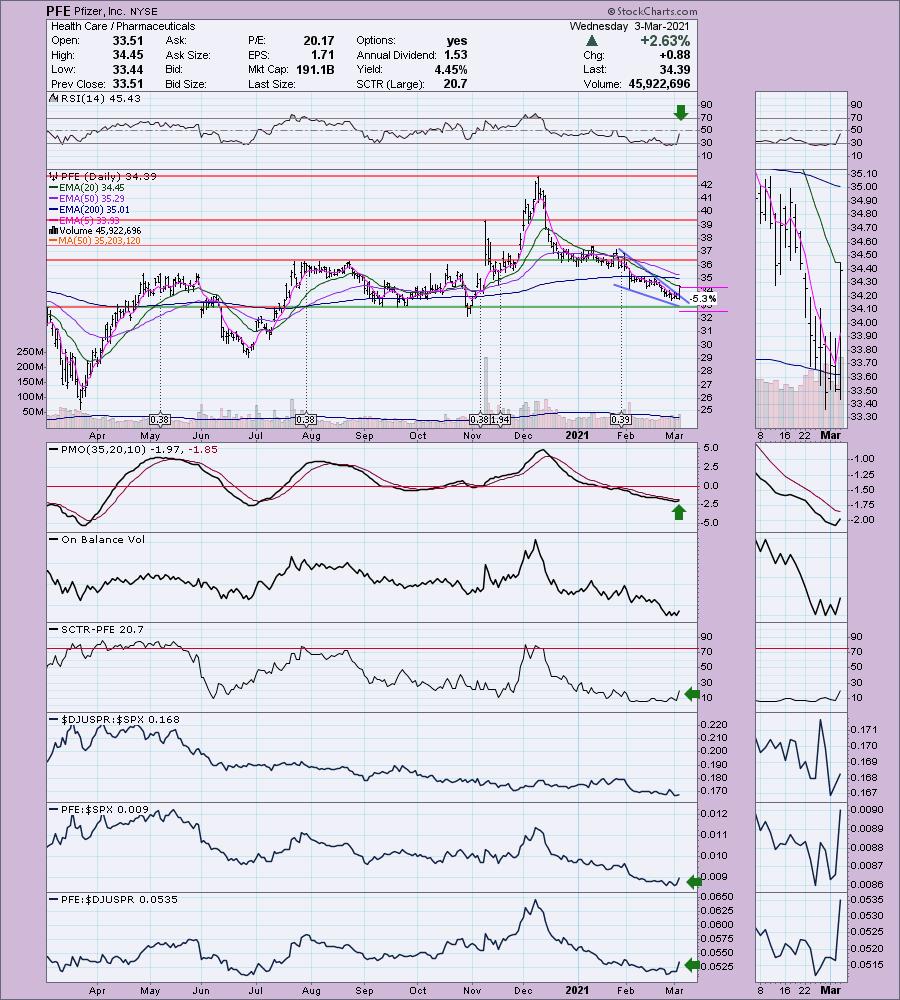
PFE is down slightly -0.06% in after hours trading. I made it a diamond in the rough on January 12th 2020 somewhat due to the hype about the vaccine. It did land in my scan results, so I didn't pull it out of the air. Soon after the 5.5% tight stop (now you know why I made it a tight one) was hit. I like today's forceful breakout from a bullish falling wedge. We do have overhead resistance at the 20-EMA to contend with. The PMO turned up in oversold territory. This bounce is coming right off strong support at the September lows. It's just beginning to outperform both the SPX and its group. Due to risk on this one I opted for a tight 5.3% stop.
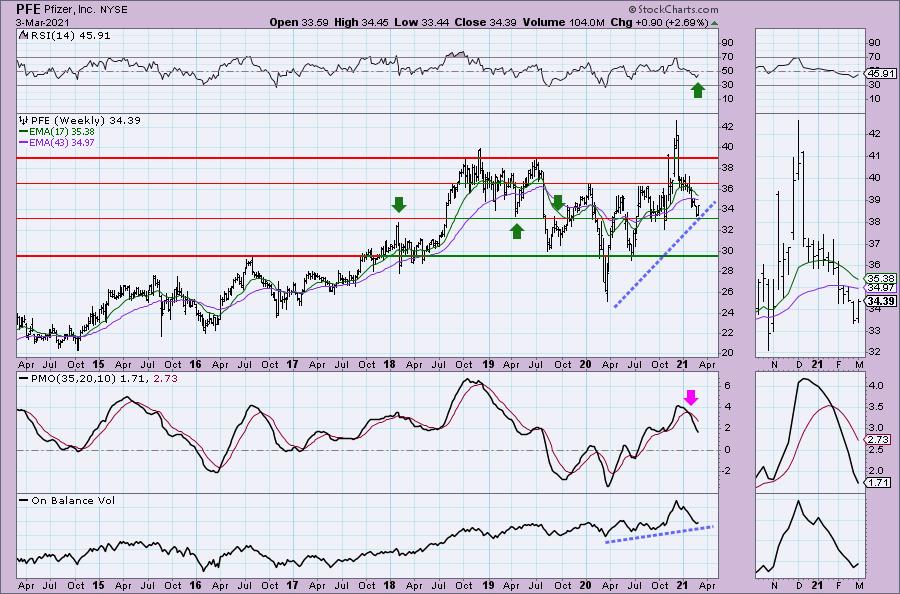
The weekly chart is mixed. The RSI is rising and the OBV is confirming the long-term rally. The weekly PMO is unhealthy. We didn't see all of the touches on the support level that price bounced off above. On the weekly chart we see more touches. The more touches, the stronger that support/resistance level is.
Don't forget, on Thursdays I look at reader-requested symbols, so shoot me an email at erin@decisionpoint.com. I read every email I receive and try to answer them all!
Packaging Corp Of America (PKG)
EARNINGS: 4/26/2021 (AMC)
Packaging Corp. of America engages in the production of container products. It operates through the following segments: Packaging, Paper, and Corporate and Other. The Packaging segment offers a variety of corrugated packaging products, such as conventional shipping containers. The Paper segment manufactures and sells a range of papers, including communication-based papers, and pressure sensitive papers. The Corporate and Other segment focuses on transportation assets, as well as rail cars, and trucks. The company was founded in 1959 and is headquartered in Lake Forest, IL.
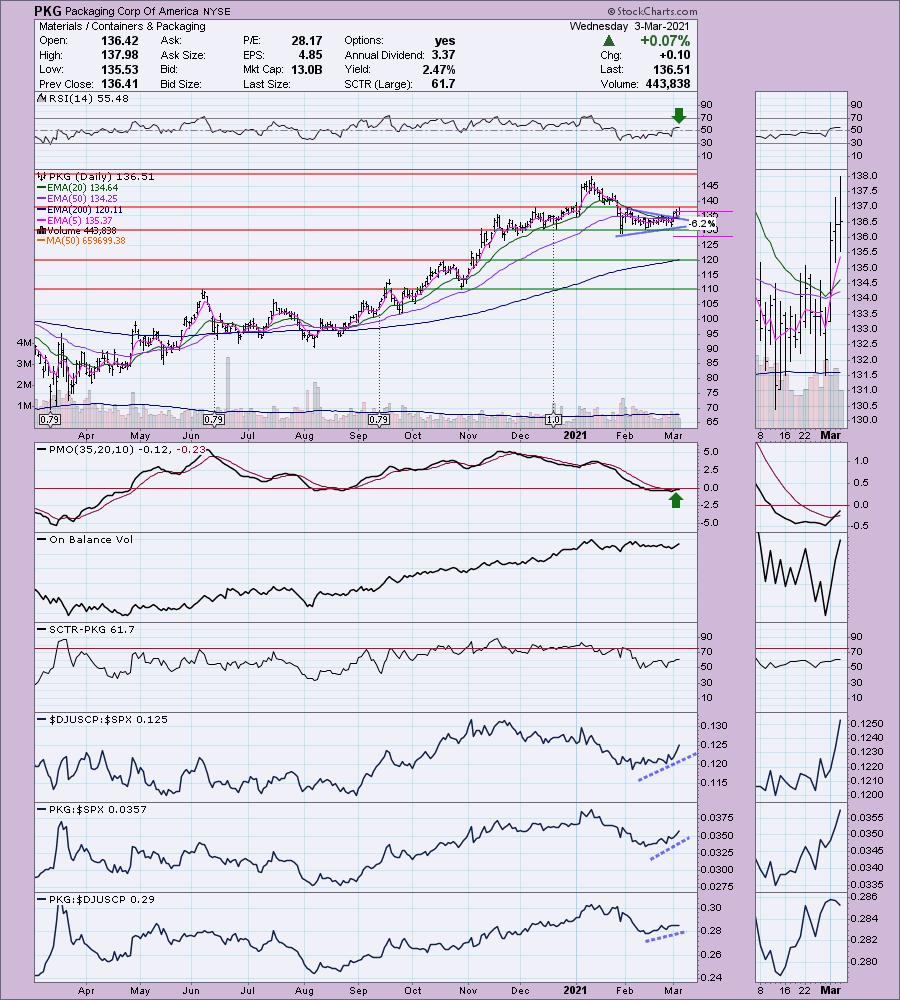
PKG is unchanged in after hours trading. It's hard to beat that new PMO BUY signal in oversold territory coming alongside a newly positive RSI. You know I like this sector and clearly this industry group is outperforming. PKG is outperforming them all. We had a symmetrical triangle that had an upside breakout. That is a bullish resolution to a bearish pattern; I always find that especially bullish. There is overhead resistance to contend with. It wasn't able to push past it today, so maybe wait for a breakout before entering. I've set a shallow stop as it lands on support.
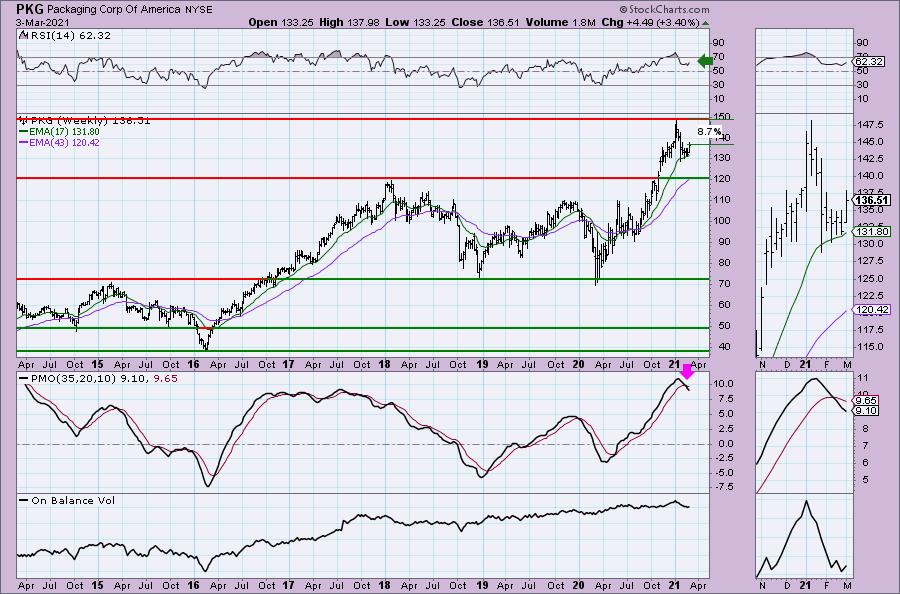
The weekly PMO doesn't look good, but the RSI is positive. Note that price has been able to hold the 17-week EMA as support.
Takeda Pharmaceutical Co. Ltd. (TAK)
EARNINGS: 5/11/2021 (BMO)
Takeda Pharmaceutical Co., Ltd. engages in the research and development, manufacture, import and export sale, and marketing of pharmaceutical drugs. It operates through the following segments: Prescription Drug, Consumer Healthcare, and Other. The Prescription Drugs segment includes the manufacture and sale of pharmaceutical products. The Consumer Healthcare segment includes the manufacture and sale of OTC drugs and quasi-drugs. The Other segment includes manufacture and sale of reagents, clinical diagnostics, and chemical products. The company was founded by Takeda Chobei on June 12, 1781 and is headquartered in Osaka, Japan.
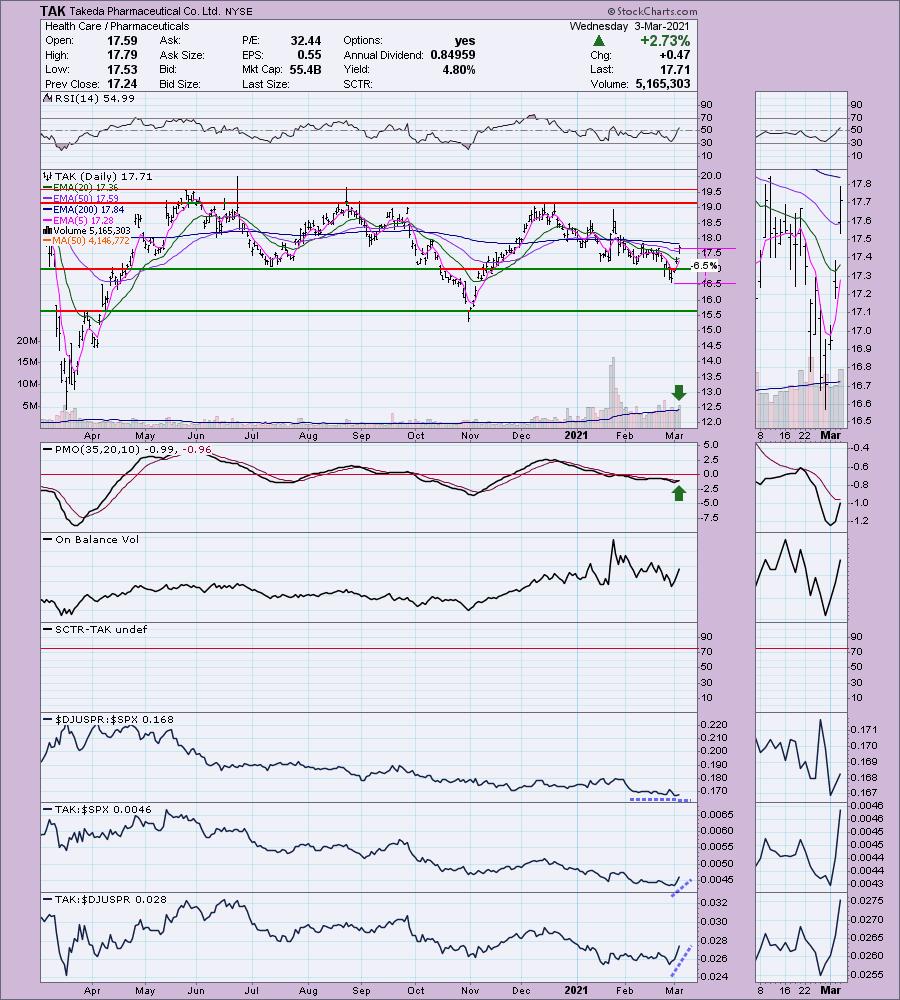
TAK is unchanged in after hours trading. This one overall hasn't done much, but it has stayed true to its trading channel between $17 and $19. It's time for a trip back up to the top. The PMO is rising strongly toward a crossover BUY signal. The RSI just turned positive. This is the first price close above the 50-EMA since this correction began off the January high. It is beginning to outperform the SPX and it is definitely outperforming its brethren. Overall this industry group leaves a lot to be desired performance-wise, but TAK is doing well. The 200-EMA could be difficult overhead resistance. TAK is on a "death cross", meaning its 50-EMA < 200-EMA. That's a bearish bias. Given that, it is important to have a stop in place. You can tighten it from the 6.5% I have and match it just below support at the July low. Some stocks don't have a SCTR value so using the relative performance indicator windows becomes extra important.
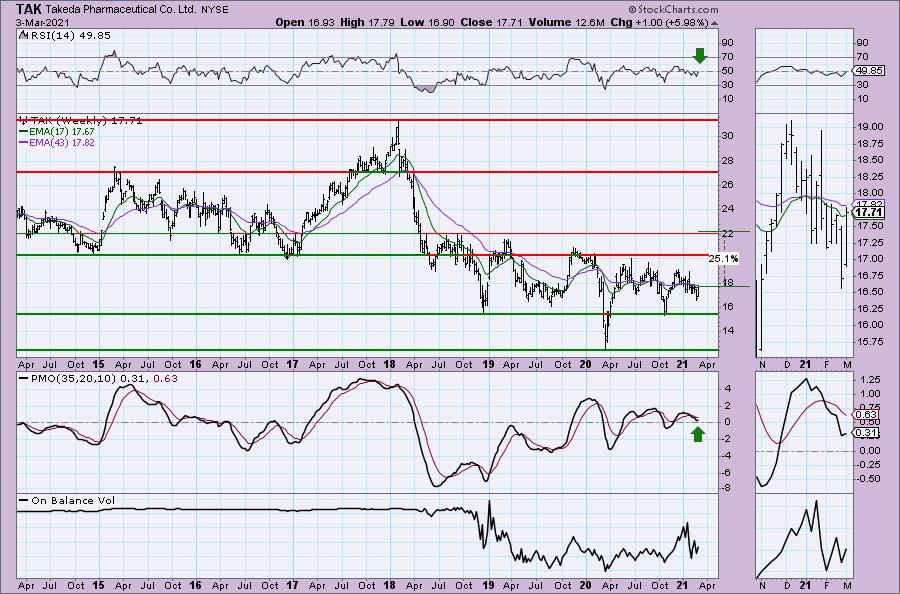
The weekly PMO looks negative until you see it in the thumbnail. It has turned up just above the zero line. The RSI is very close to positive territory.
Full Disclosure: I'm about 75% invested and 25% is in 'cash', meaning in money markets and readily available to trade with.
Current Market Outlook:
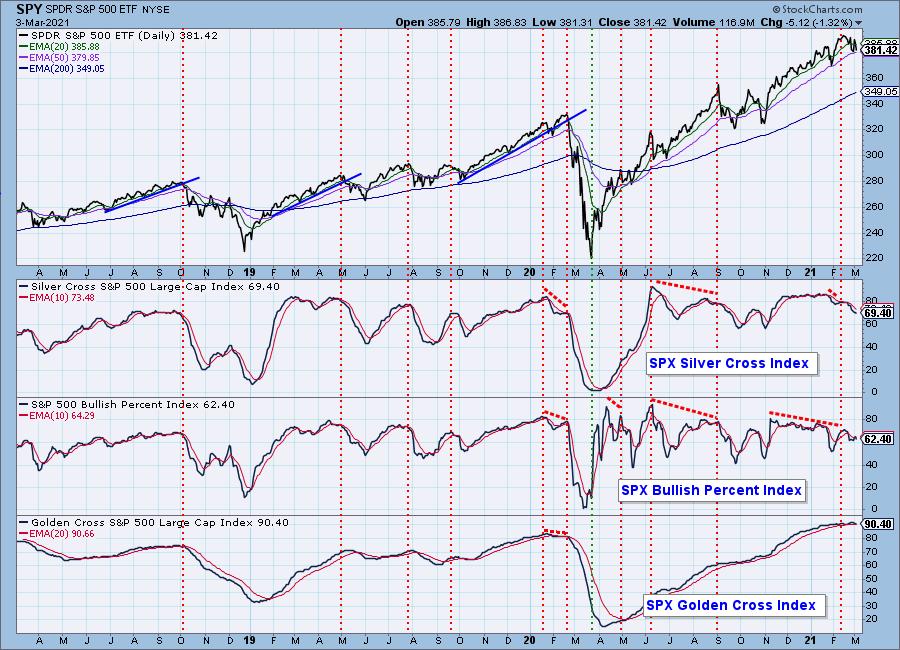
Market Environment: It is important to consider the odds for success by assessing the market tides. The following chart uses different methodologies for objectively showing the depth and trend of participation for intermediate- and long-term time frames.
- The Silver Cross Index (SCI) shows the percentage of SPX stocks on IT Trend Model BUY signals (20-EMA > 50-EMA)
- The Golden Cross Index (GCI) shows the percentage of SPX stocks on LT Trend Model BUY signals (50-EMA > 200-EMA)
- The Bullish Percent Index (BPI) shows the percentage of SPX stocks on Point & Figure BUY signals.
Don't forget that as a "Diamonds" member, you have access to our GCI/SCI curated ChartList on DecisionPoint.com. You'll find it under "Members Only" links on the left side on the Blogs and Links Page.
Here is the current chart:
Diamond Index:
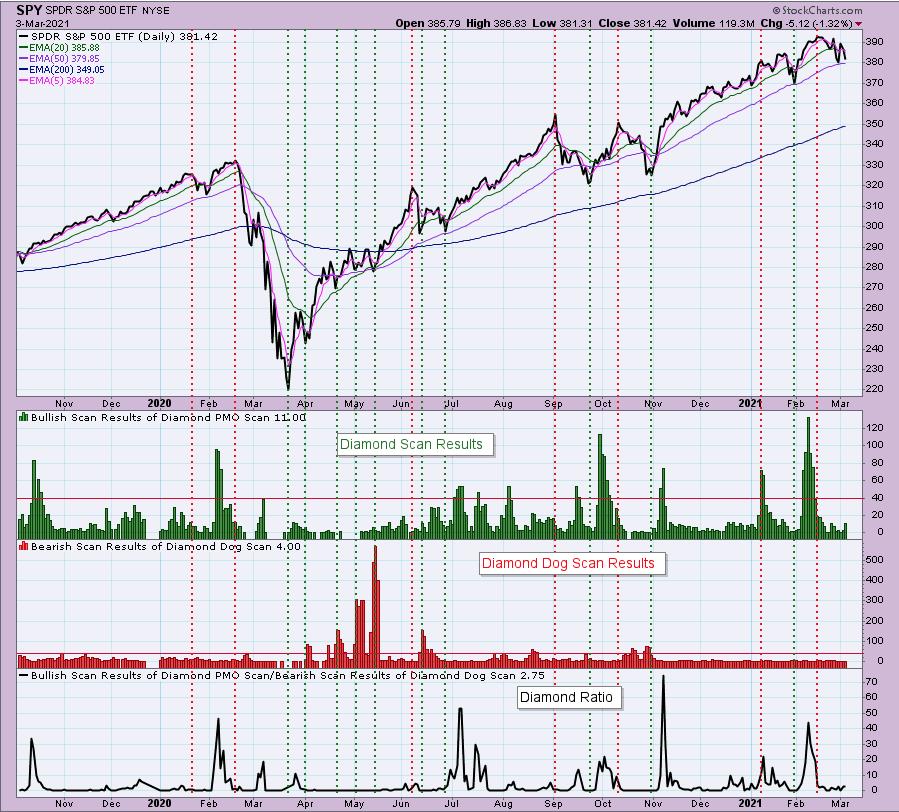
The Diamond Index chart looks at the number of scan results from my bullish Diamond PMO Scan and the number of scan results from the inverse Diamond Dog Scan. The Diamond Ratio divides the bullish results by the bearish results.
I only have data going back to October 2019 so I won't make any sweeping conclusions about the Diamond Index chart. I have marked cardinal tops with red dotted vertical lines and cardinal price bottoms with green dotted vertical lines. I believe that when the Diamond Dog results spike, it usually comes at a price bottom, or marks a strong continuation of the rising trend.
Unfortunately, the Diamond PMO Scan result numbers aren't providing much insight. The Diamond Ratio has promise, but again I don't see a clear correlation to the market tops/bottoms right now. I need to study and manipulate the data some more. Keep you posted!
Technical Analysis is a windsock, not a crystal ball.
Happy Charting!
- Erin
erin@decisionpoint.com
Watch the latest episode of DecisionPoint with Carl & Erin Swenlin on Mondays 7:00p EST or on the DecisionPoint playlist on the StockCharts TV YouTube channel here!
NOTE: The stocks reported herein are from mechanical trading model scans that are based upon moving average relationships, momentum and volume. DecisionPoint analysis is then applied to get five selections from the scans. The selections given should prompt readers to do a chart review using their own analysis process. This letter is not a call for a specific action to buy, sell or short any of the stocks provided. There are NO sure things or guaranteed returns on the daily selection of "diamonds in the rough."
Helpful DecisionPoint Links:
DecisionPoint Shared ChartList and DecisionPoint Chart Gallery
Price Momentum Oscillator (PMO)
Swenlin Trading Oscillators (STO-B and STO-V)
For more links, go to DecisionPoint.com!
