
Welcome to reader request day! Thank you for all of your submissions. I appreciate you sharing your trade ideas with all of us! There are few I really like, even now with the market pulling back. I've included a defensive stock from the Utilities sector. It is beat down, but the breakout from a bullish falling wedge on Edison (EIX) was impressive.
Today we saw a rotation into more defensive sectors. It may be their turn to breakout with a weak market. I didn't include these defensive names in the Staples - Food Products group; they need a little work, but they are interesting nonetheless. Flower Foods (FLO) and prior diamond Chefs' Warehouse (CHEF). Additionally, I am stalking the agribusiness ETF (MOO) on today's deep pullback to 200-EMA support.
REGISTER NOW for tomorrow's Diamond Mine. Inevitably I have a subscriber or two that has trouble getting into the room. I am now going into Zoom and having them manually resend the "join" information 15 minutes before I open the Diamond Mine. That will NOT help you if you haven't registered...so get to it! It's just a quick click right here.
** Everyone needs a vacation and I am no exception. I've planned a mini vacation to local wine country mid-week 3/23 through 3/25. The DecisionPoint Alert will be published, but I'll be taking the week off for Diamonds with the exception of the 3/26 Diamond Mine. I need to fit wine tasting in somehow! To compensate you for that week, I am adding a week to the end of all Diamond and Bundle subscribers' terms when I return, because who knows, I may end up writing a report or two. **
Today's "Diamonds in the Rough" are: BLBD, EIX, GM, KTB and OKE.
 Diamond Mine Registration Information:
When: Mar 5, 2021 09:00 AM Pacific Time (US and Canada)
Topic: DecisionPoint Diamond Mine (3/5/2021) LIVE Trading Room
Register in advance for this webinar:
https://zoom.us/webinar/register/WN_OFnLCP7ZShOerDECNrb-TA
After registering, you will receive a confirmation email containing information about joining the webinar, including the password.
=======================================================================
Recording Link:
Topic: DecisionPoint Diamond Mine (02/26/2021) LIVE Trading Room
Start Time : Feb 26, 2021 08:58 AM
Meeting Recording:
Access Passcode: Ft7Uq!&+
***Click here to register for this recurring free DecisionPoint Trading Room on Mondays at Noon ET!***
+++++++++++++++++++++++++++++++++++++++++++++++++++++++++++++++++++++++++++++++
DAVID KELLER joined me for the last DP Trading Room on March 1st. Below you'll find the recording link. We had a great time discussing the markets and the various symbol requests.
RECORDING LINK:
Topic: DecisionPoint Trading Room
Start Time : Mar 1, 2021 09:00 AM
Meeting Recording:
Access Passcode: tdd*4nNS
For best results, copy and paste the access code to avoid typos.
Welcome to DecisionPoint Daily Diamonds, wherein I highlight five "diamonds in the rough." These are selected from the results of my DecisionPoint scans, which search for stocks that could benefit from the trend and condition of the market. Remember, these are not recommendations to buy or sell, but are the most interesting of the stocks that surfaced in my scans. My objective is to save you the work of the initial, tedious culling process, but you need to apply your own analysis to see if these stocks pique your interest as well. There are no guaranteed winners here!
Blue Bird Corp. (BLBD)
EARNINGS: 5/12/2021 (AMC)
Blue Bird Corp. engages in the design and manufacture of school buses. It operates through the Bus and Parts business segments. The Bus segment includes the manufacturing and assembly of school buses to be sold to a variety of customers across the United States, Canada, and in international markets. The Parts segment provides routine maintenance, replacement of parts that are damaged in service, and replacement of parts that suffer from wear and tear. The company was founded by Albert Laurence Luce in 1927 and is headquartered in Macon, GA.
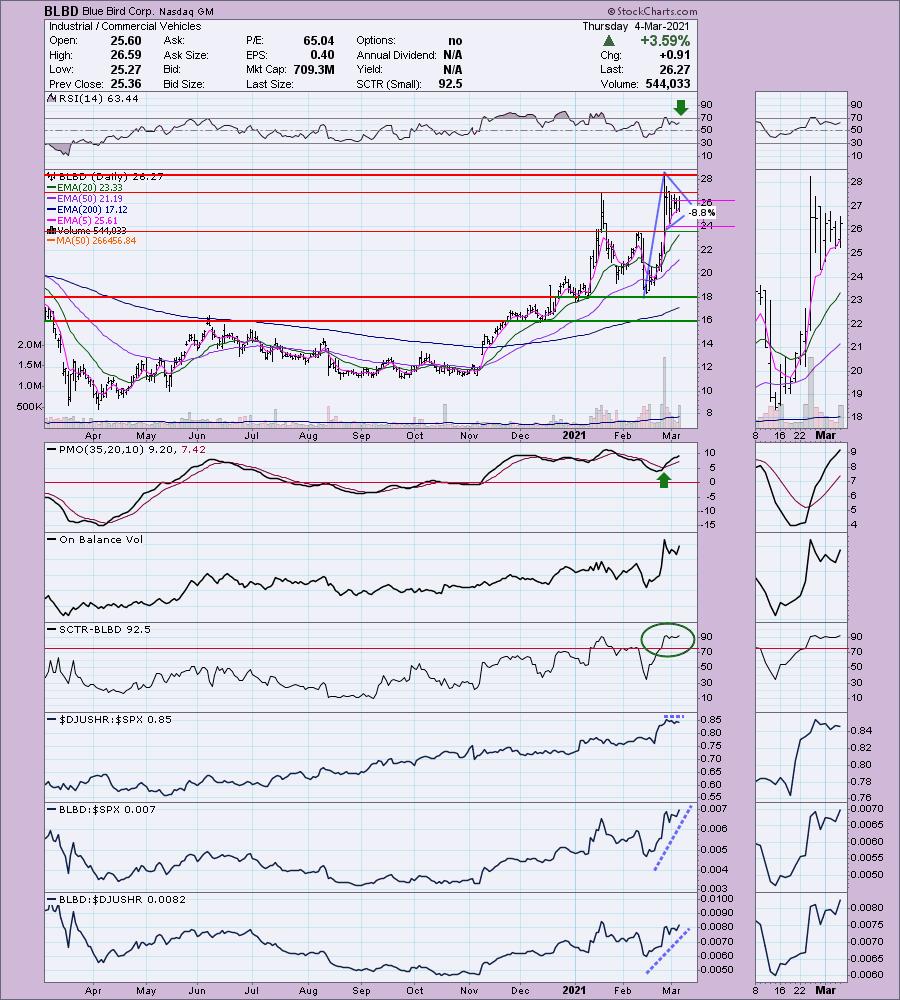
Excellent pick! BLBD is currently up +2.55% in after hours trading. Industrials have been doing well and this stock is no exception. It is set up nicely with a bull flag or pennant. The PMO is on a BUY signal and the RSI is positive. Volume really came in on this stock's breakout that formed the flagpole. The SCTR is excellent at 92.5 and despite some underperformance near term by the Commercial Vehicles industry group, this one is outperforming by a mile. The stop is set at around $24. You can see in the thumbnail that matches with the bottom of the pennant.
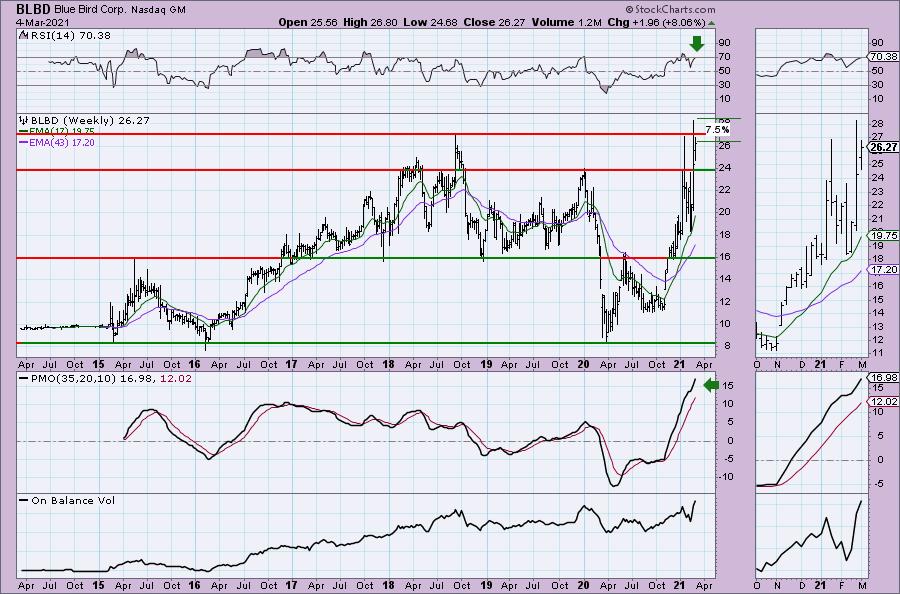
Last week BLBD made new all-time highs and this week pulled back. The RSI is slightly overbought. the PMO is rising strongly. The weekly PMO appears overbought, but we don't have enough history to know for sure. I'm concentrating on the forceful rise. Notice the OBV broke out with price.
Edison Intl, Inc. (EIX)
EARNINGS: 4/29/2021 (AMC)
Edison International is a renewable energy company, which through its subsidiaries, generates and distributes electric power, and invests in energy services and technologies. The company was founded on July 4, 1886 and is headquartered in Rosemead, CA.
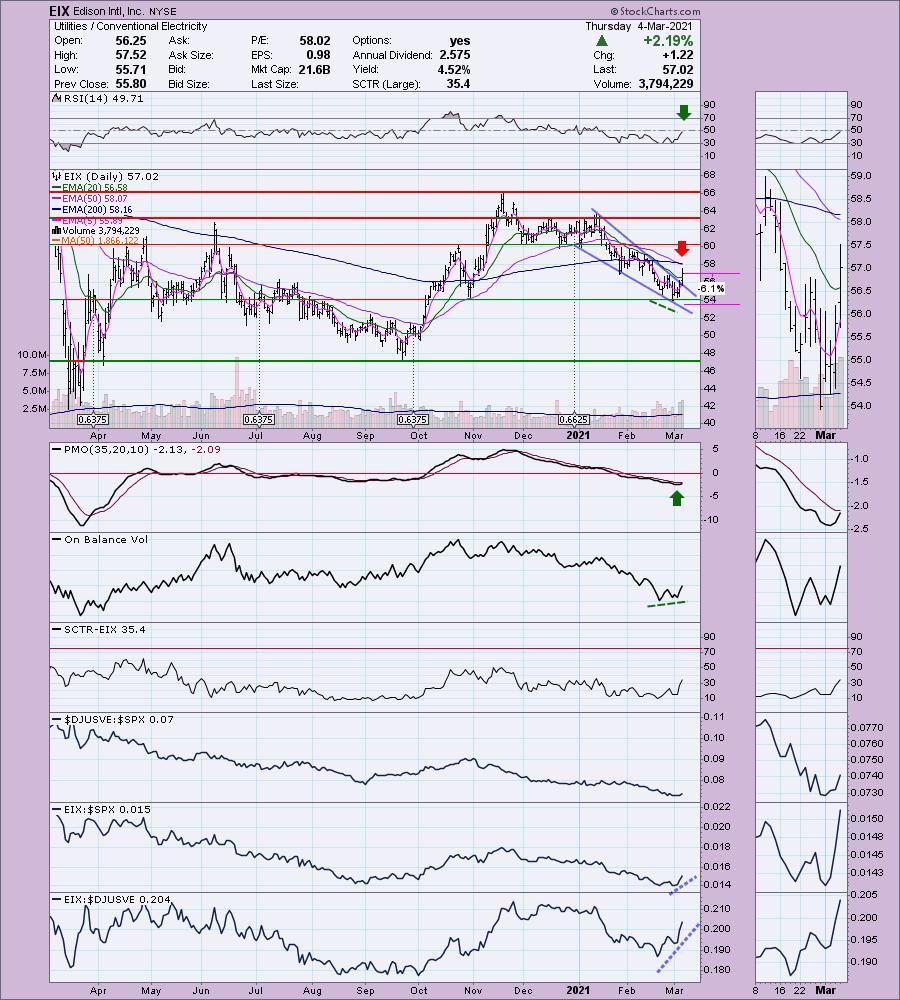
This is my pick today. Currently it is down slightly -0.07% in after hours trading. This stock has been very beat down. So much so, that we have a death cross this week with the negative 50/200-EMA crossover. Today's breakout looked good. We have seen price close above the 20-EMA since the decline began earlier this year. It is also bouncing off support at the October low. In addition to the newly rising PMO, we have a positive OBV divergence leading into this rally. The RSI is negative but should hit positive territory soon. Here's the issue with relative performance. Notice that EIX has been strongly outperforming its industry group. So what. It's been in a downtrend all year despite seeing outperformance in mid-February. Basically it has been going down much slower than its compadres over that time period. The outperformance in this case is against the SPX. I really like being able to set a tight stop here.
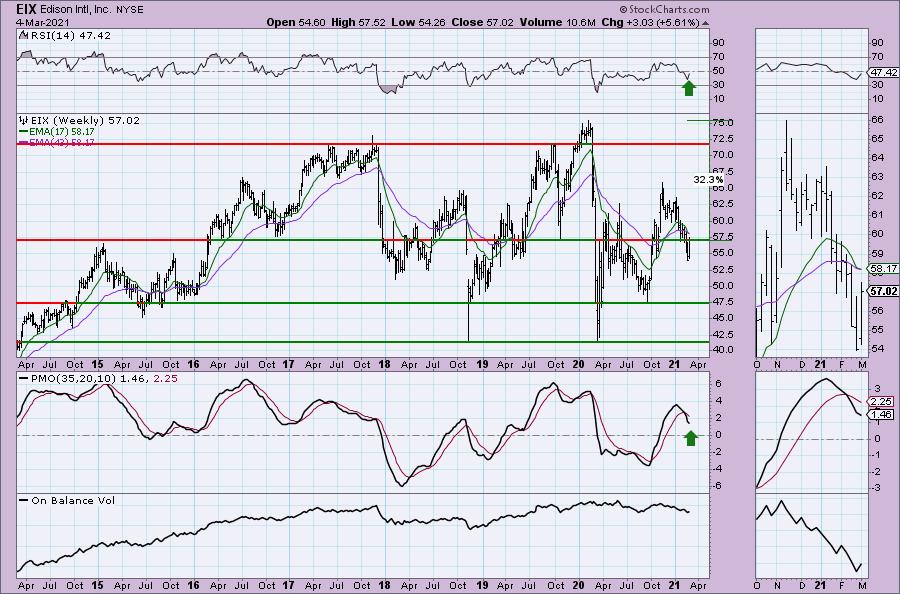
The weekly PMO is on a SELL signal, but we can see it decelerating on the rebound this week. There is plenty of upside potential, but typically that is tied to a weak market. Should the market get more bullish, EIX will have a hard time challenging that 2020 high.
General Motors Co. (GM)
EARNINGS: 5/5/2021 (BMO)
General Motors Co. engages in the designing, manufacturing, and selling of cars, trucks and automobile parts. It also provides automotive financing services through General Motors Financial Company, Inc. The firm operates through the following segments: GM North America, GM International, Cruise and GM Financial. The company sells vehicles under the Chevrolet, Cadillac, Baojun, Buick, GMC, Holden, Jiefang, Wuling, Maven, and OnStar brands. General Motors was founded by William C. Durant on September 16, 1908 and is headquartered in Detroit, MI.
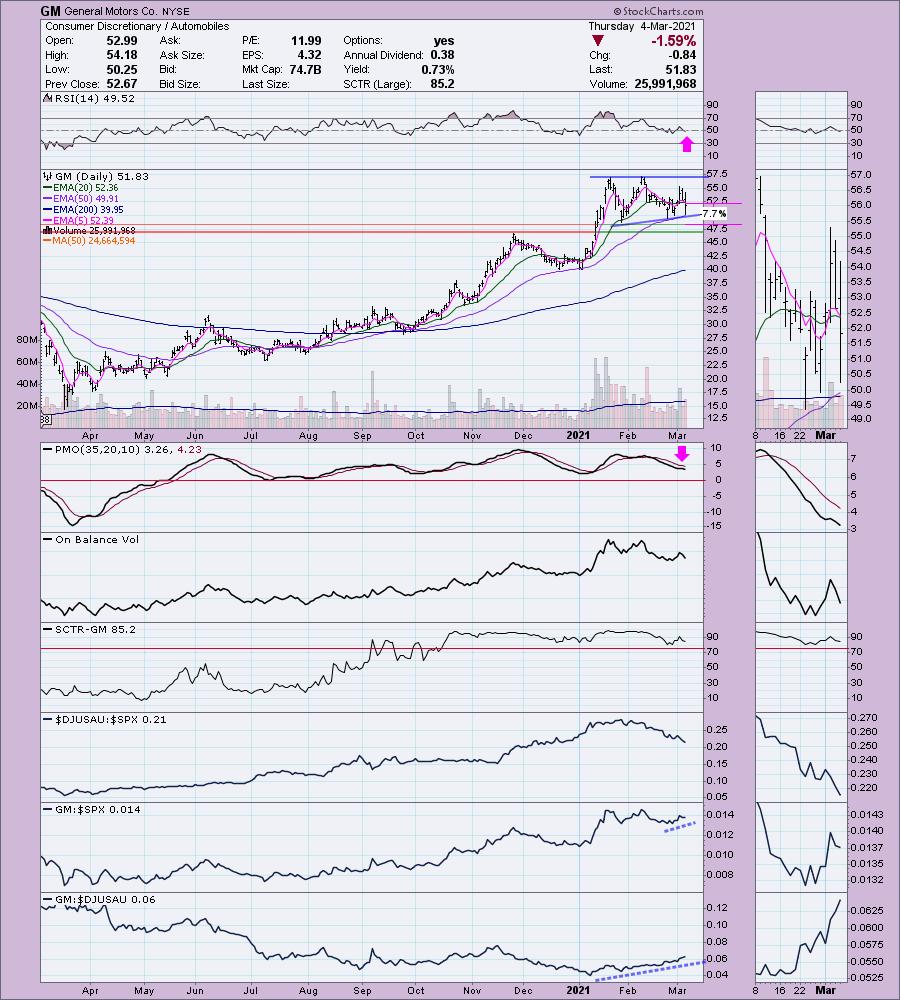
GM is down slightly -0.10% in after hours trading. The chart may not look that enticing, but there are some bullish characteristics. The bullish components are a bullish ascending triangle (flat top, rising bottoms). The expectation is a breakout with an upside target around $65. Also bullish is GM's recent outperformance against the SPX. I can't get excited about it outperforming its group since the overall group has been in decline. I like that GM is bouncing off support at the 50-EMA. This seems to be an historical springboard when GM has a bullish bias (50-EMA > 200-EMA). The problem is GM is in a struggling industry group. It also seems to be out of favor based on the declining OBV. The RSI is neutral, but it is trending lower. If you want to get in on it, you can set a more shallow stop.
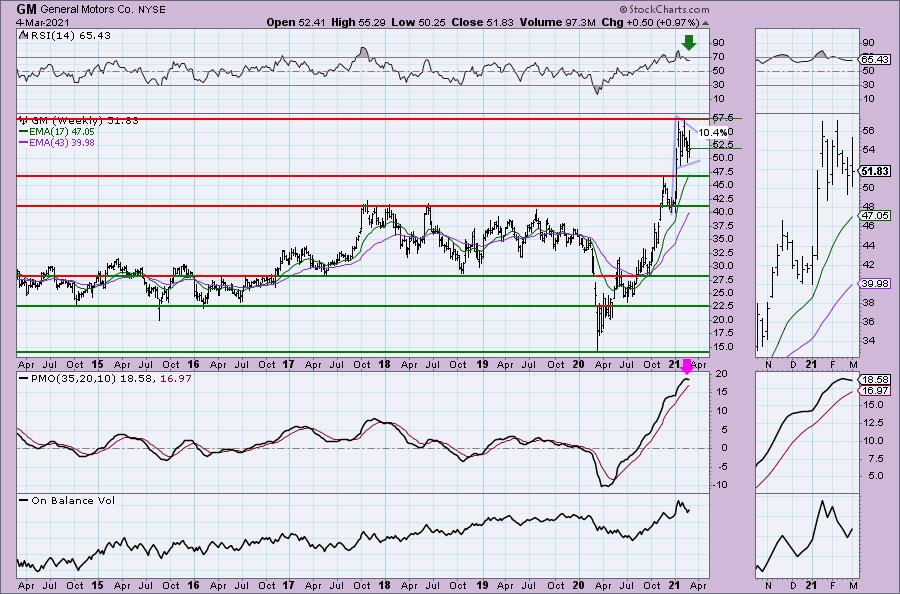
I like the flag formation on the weekly chart and the positive RSI. The PMO is worrisome, but we saw this happen on the development of the previous flag. After forming the flag, it broke out strongly and the PMO resumed its climb. We're a bit more vulnerable this time out given the weakness in the overall market and in this industry group in particular. I think it's a hold if you have it, but the line in the sand has to be $47 or depending on your profit so far, $40. We do not want GM to reenter that prior trading range from 2017 to 2019.
Don't forget, on Thursdays I look at reader-requested symbols, so shoot me an email at erin@decisionpoint.com. I read every email I receive and try to answer them all!
Kontoor Brands Inc. (KTB)
EARNINGS: 5/6/2021 (BMO)
Kontoor Brands, Inc. engages in the design, manufacture, sourcing, marketing, and distribution of a portfolio of brands. It operates through the Wrangler and Lee segment. The company was founded on November 11, 2018 and is headquartered in Greensboro, NC.
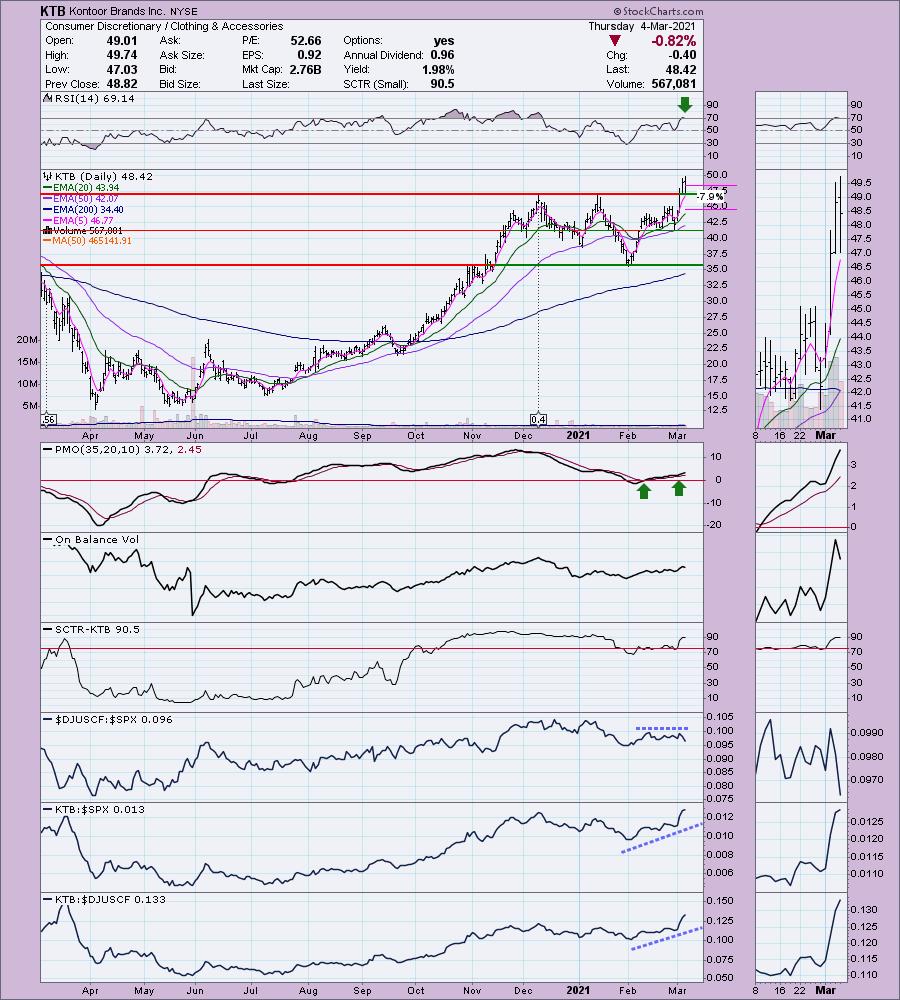
This is a pretty chart. KTB is unchanged in after hours trading. If you're in Consumer Discretionary, this group hasn't been the best in comparison to travel and recreation groups, but I like the way this one is shaping up. The PMO is on a BUY signal and it recently bottomed above the signal line which is especially bullish. The RSI is somewhat overbought, but forgivable. The SCTR is strong. If I had to complain, it would be that the OBV has not made new highs on this breakout. It's a strong performer. I chose an 8% stop that would take price back down below new support and should line up somewhat with the 20-EMA.
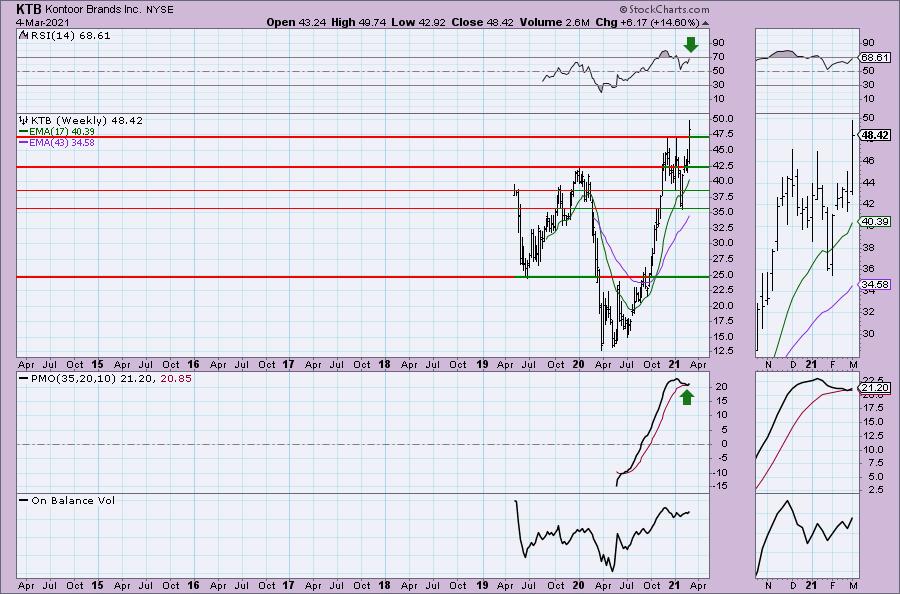
The weekly PMO is bottoming above its signal line and this week we are seeing a breakout to new all-time highs. The RSI is positive and not yet overbought.
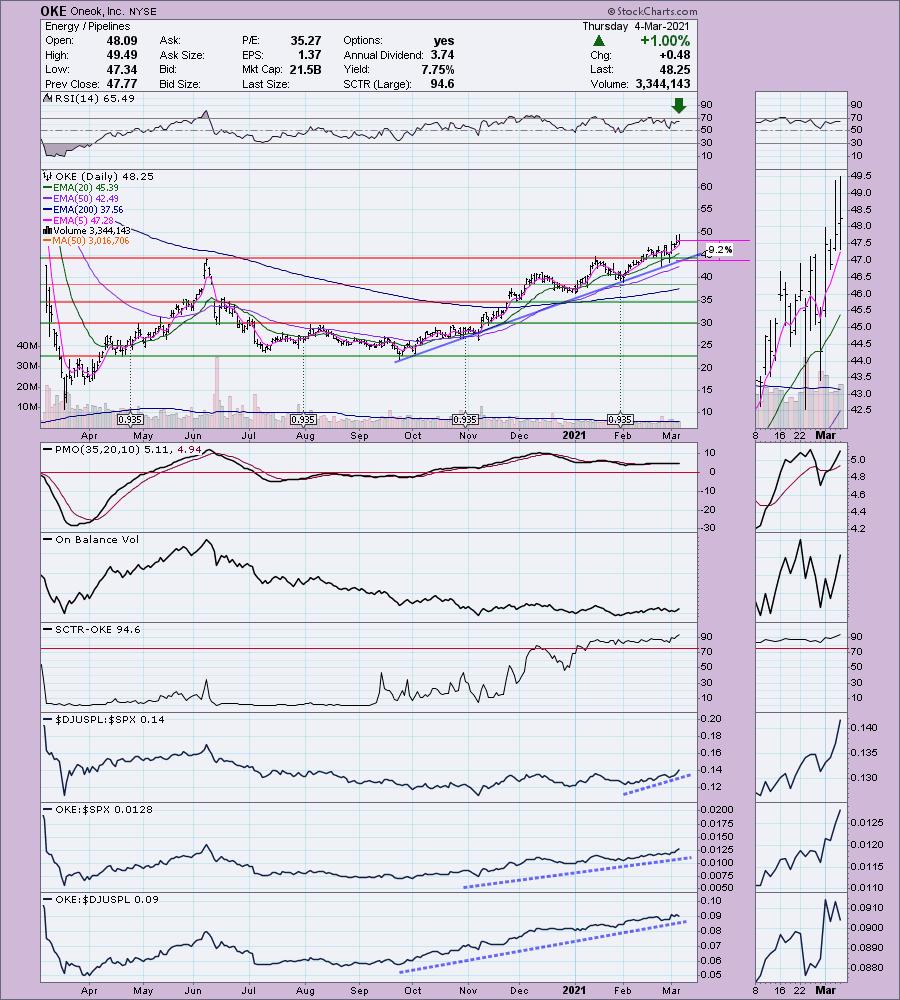
Oneok, Inc. (OKE)
EARNINGS: 4/27/2021 (AMC)
ONEOK, Inc. engages in gathering, processing, fractionating, transporting, storing and marketing of natural gas. It operates through the following segments: Natural Gas Gathering and Processing, Natural Gas Liquids and Natural Gas Pipelines. The Natural Gas Gathering and Processing segment offers midstream services to producers in North Dakota, Montana, Wyoming, Kansas and Oklahoma. The Natural Gas Liquids segment owns and operates facilities that gather, fractionate, treat and distribute NGLs and store NGL products, in Oklahoma, Kansas, Texas, New Mexico and the Rocky Mountain region, which includes the Williston, Powder River and DJ Basins, where it provides midstream services to producers of NGLs and deliver those products to the two market centers, one in the Mid-Continent in Conway, Kansas and the other in the Gulf Coast in Mont Belvieu, Texas. The Natural Gas Pipelines segment provides transportation and storage services to end users. The company was founded in 1906 and is headquartered in Tulsa, OK.
OKE is unchanged in after hours trading. I covered OKE recently in the February 10th 2020 Diamonds Report. The stop has not been hit and it is up a modest +7.8%. It's been holding a beautiful rising trend. The PMO has been flattened by that trend as we aren't seeing any acceleration. The PMO just triggered a BUY signal and the RSI is positive and not overbought. Energy has been a bright spot and I don't see anything yet to tell me it won't be going forward. The strong outperformance of OKE is impressive. The SCTR is in the "hot zone" above 75. The stop level is a bit deep, but looking at the strength of the rising trend, it makes sense.
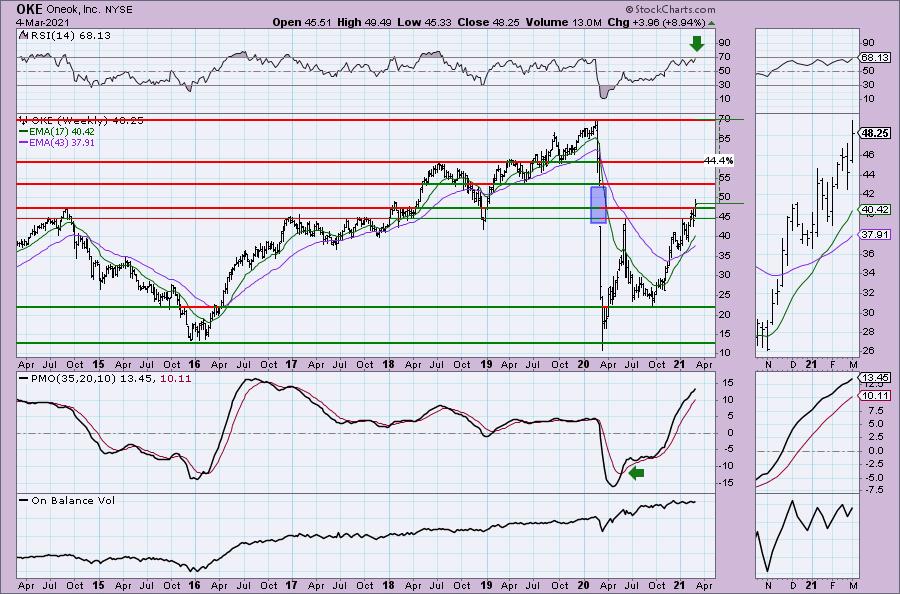
The weekly chart has a huge double-bottom. It was executed a few weeks ago. If we do the measurement for the pattern, we know that the upside target is conservatively just above overhead resistance at the 2020 top. Price is on its way to covering the previous gap. Generally when a stock covers a gap, it continues in that direction. The PMO is on a BUY signal and the RSI is positive and not overbought.
Full Disclosure: I'm about 75% invested and 25% is in 'cash', meaning in money markets and readily available to trade with.
Current Market Outlook:
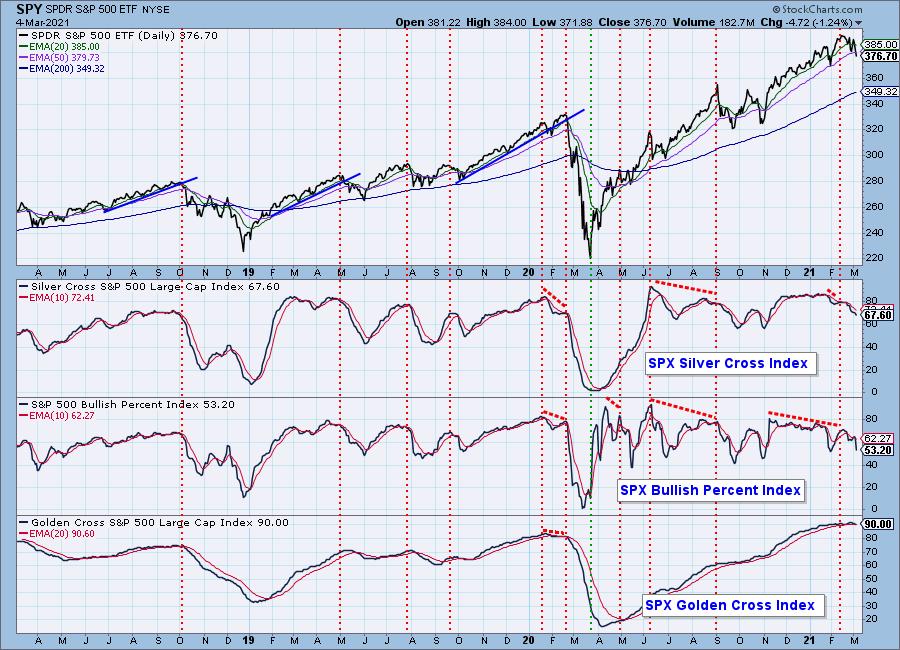
Market Environment: It is important to consider the odds for success by assessing the market tides. The following chart uses different methodologies for objectively showing the depth and trend of participation for intermediate- and long-term time frames.
- The Silver Cross Index (SCI) shows the percentage of SPX stocks on IT Trend Model BUY signals (20-EMA > 50-EMA)
- The Golden Cross Index (GCI) shows the percentage of SPX stocks on LT Trend Model BUY signals (50-EMA > 200-EMA)
- The Bullish Percent Index (BPI) shows the percentage of SPX stocks on Point & Figure BUY signals.
Don't forget that as a "Diamonds" member, you have access to our GCI/SCI curated ChartList on DecisionPoint.com. You'll find it under "Members Only" links on the left side on the Blogs and Links Page.
Here is the current chart:
Diamond Index:
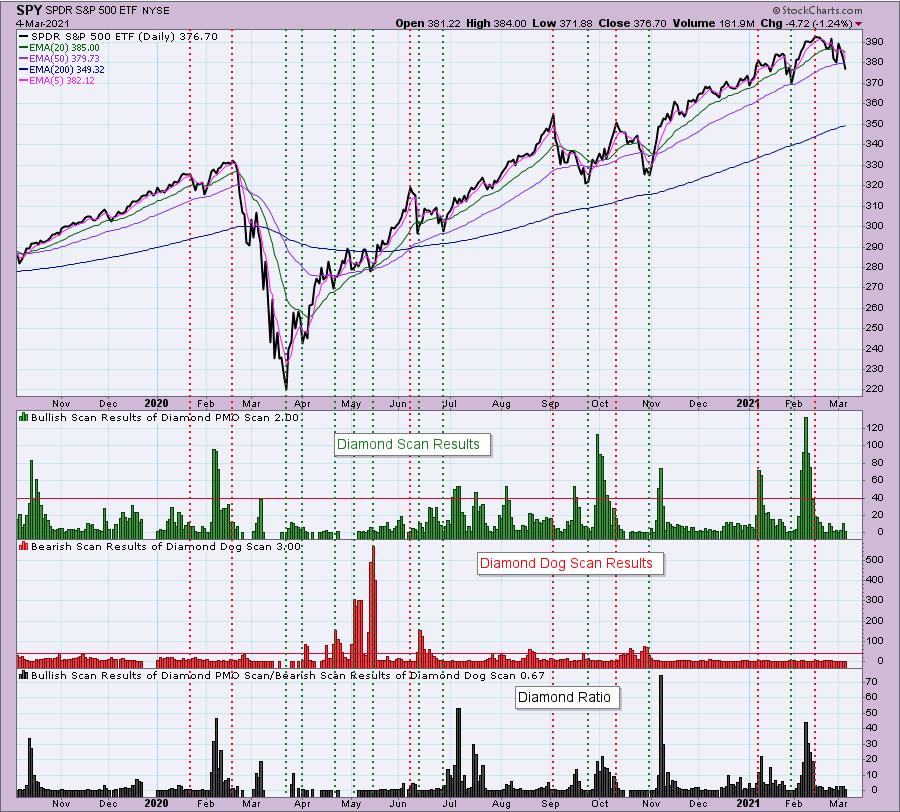
The Diamond Index chart looks at the number of scan results from my bullish Diamond PMO Scan and the number of scan results from the inverse Diamond Dog Scan. The Diamond Ratio divides the bullish results by the bearish results.
I only have data going back to October 2019 so I won't make any sweeping conclusions about the Diamond Index chart. I have marked cardinal tops with red dotted vertical lines and cardinal price bottoms with green dotted vertical lines. I believe that when the Diamond Dog results spike, it usually comes at a price bottom, or marks a strong continuation of the rising trend.
Unfortunately, the Diamond PMO Scan result numbers aren't providing much insight. The Diamond Ratio has promise, but again I don't see a clear correlation to the market tops/bottoms right now. I need to study and manipulate the data some more. Keep you posted!
Technical Analysis is a windsock, not a crystal ball.
Happy Charting!
- Erin
erin@decisionpoint.com
Watch the latest episode of DecisionPoint with Carl & Erin Swenlin on Mondays 7:00p EST or on the DecisionPoint playlist on the StockCharts TV YouTube channel here!
NOTE: The stocks reported herein are from mechanical trading model scans that are based upon moving average relationships, momentum and volume. DecisionPoint analysis is then applied to get five selections from the scans. The selections given should prompt readers to do a chart review using their own analysis process. This letter is not a call for a specific action to buy, sell or short any of the stocks provided. There are NO sure things or guaranteed returns on the daily selection of "diamonds in the rough."
Helpful DecisionPoint Links:
DecisionPoint Shared ChartList and DecisionPoint Chart Gallery
Price Momentum Oscillator (PMO)
Swenlin Trading Oscillators (STO-B and STO-V)
For more links, go to DecisionPoint.com!
