
I always enjoy the Diamond Mine mornings! We had excellent symbol requests and time to do some actual "mining" at the end. If you weren't able to attend, I recommend you watch today's recording.
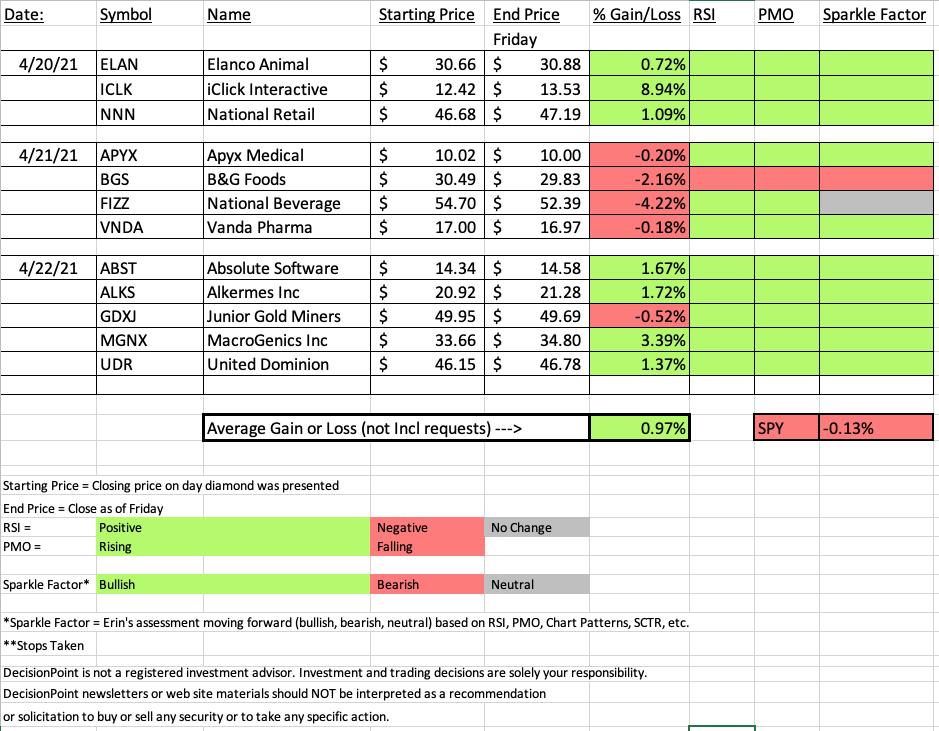
The spreadsheet looks good this week, especially given that the SPX is down on the week. We are comfortably in the green overall, especially when you consider nearly all of these picks look good moving forward. Of course, the Diamond in the Rough that I picked for my own portfolio is the biggest loser this week: National Beverage (FIZZ). The biggest winner by far is iClick (ICLK).
However, while FIZZ is the biggest loser, the RSI and PMO are still positive. I'm leaving it up to you with a "neutral" Sparkle Factor. The real loser is B&G Foods (BGS) as its future doesn't look bright at all.
Time to register for next week's Diamond Mine trading room! The link is right here.

Diamond Mine Information:
RECORDING LINK:
Topic: DecisionPoint Diamond Mine (04/23/2021) LIVE Trading Room
Start Time : Apr 23, 2021 09:00 AM
Access Passcode: April/23
REGISTRATION:
When: Apr 30, 2021 09:00 AM Pacific Time (US and Canada)
Topic: DecisionPoint Diamond Mine (04/30/2021) LIVE Trading Room
Register in advance for this webinar HERE
Save the registration confirmation email with login instructions in case Zoom doesn't notify you in time.
A few items about the spreadsheet: I decided it only fair to denote "reader requests" as I shouldn't get to take credit if they turn out great! I've put on the spreadsheet whether the RSI is positive (green) or negative (red). The PMO column tells you if it is rising (green) or falling (red). Finally I've added my own "Sparkle Factor" that gives you my assessment going forward, bullish (green), bearish (red) or neutral (gray). The Sparkle Factor is basically my thoughts on whether I expect it to rise or fall. A neutral means it could really go either way so it could be added to a watch list. If you're in a stock I consider "neutral" going forward, the ball is in your court.
Free DecisionPoint Trading Room on Mondays, Noon ET

*Click here to register for this recurring free DecisionPoint Trading Room on Mondays at Noon ET!*
=======================================
BELOW is a link to Monday's recording:
Topic: DecisionPoint Trading Room
Start Time : Apr 19, 2021 09:00 AM
Free Trading Room Recording
Access Passcode: April/19
For best results, copy and paste the access code to avoid typos.
Darling:
iClick Interactive Asia Group Ltd. (ICLK)
EARNINGS: 5/21/2021 (BMO)
iClick Interactive Asia Group Ltd. is a holding company, engages in the provision of online marketing and data technology platform. Its data-driven solutions help marketers identify, engage, and activate potential customers, monitor and measure the results of marketing campaigns, and create content catering to potential customers across different content distribution channels through both personal computer and mobile devices. The company was founded by Wing Hong Hsieh, Ricky Ng, and Jian Tang on February 3, 2010 and is headquartered in Hong Kong.
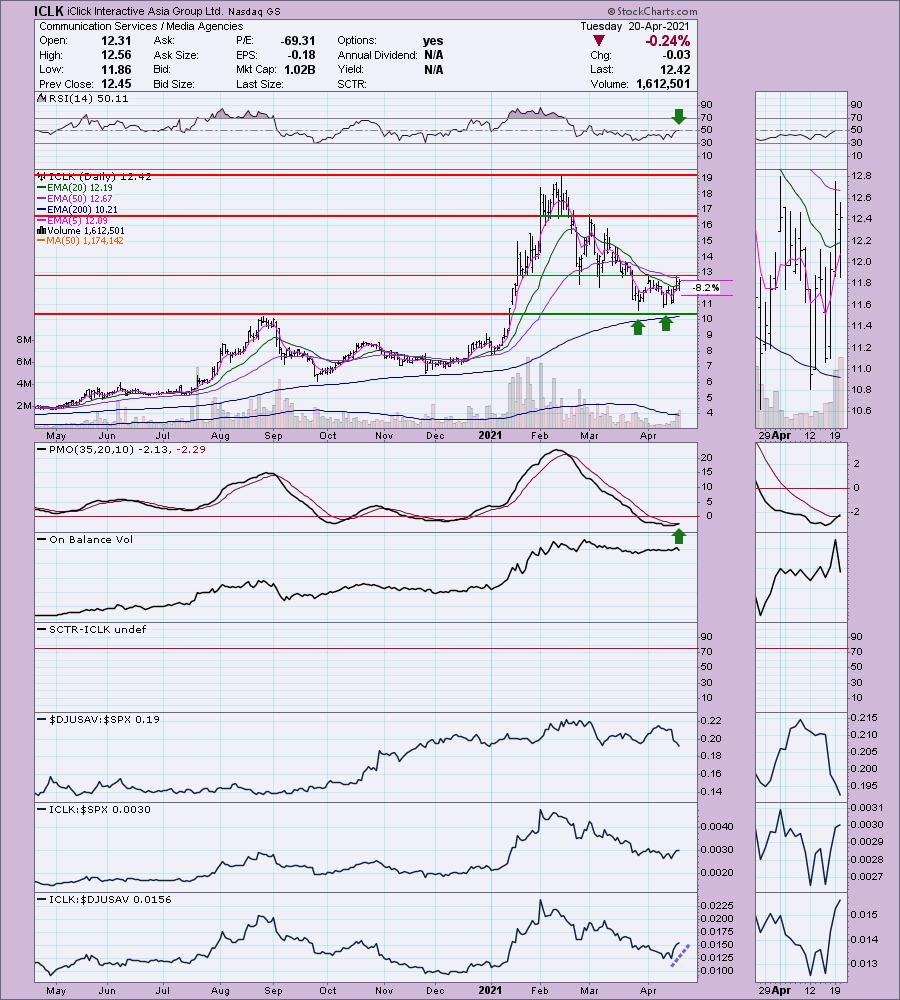
Below is the commentary and chart from Tuesday 4/20:
"ICLK is unchanged in after hours trading. Here is a fairly textbook bullish double-bottom pattern. Currently price hasn't crossed above the confirmation line nor the 50-EMA. This one is percolating with a brand new PMO crossover BUY signal and newly positive RSI. It's performed adequately against the SPX. It's outpaced its industry group, but the group has been underperforming, so I don't count that as much of a plus. The stop is set midway down the double-bottom pattern."
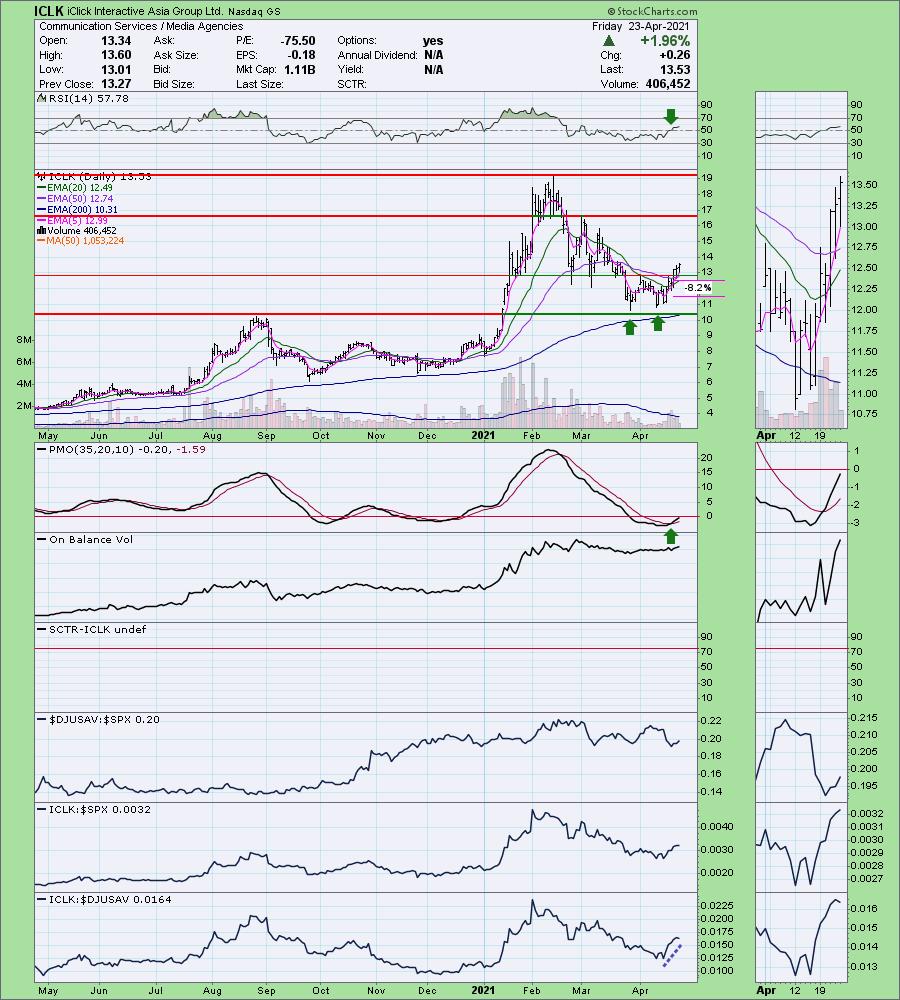
Here is today's chart:
The double-bottom pattern has since executed. The minimum upside target would take us to about $15.50. Everything on the chart is healthy, so I expect it to continue higher.
Don't forget, on Thursdays I look at reader-requested symbols, so shoot me an email at erin@decisionpoint.com. I read every email I receive and try to answer them all!
Dud:
National Beverage Corp. (FIZZ)
EARNINGS: 6/30/2021 (AMC)
National Beverage Corp. engages in the development, manufacture, market, and sale of flavored beverage products. Its brands include Big Shot, Clear Fruit, Crystal Bay, Everfresh, Everfresh Premier Varietals, Faygo, LaCroix, LaCroix Cúrate, Mr.Pure, Nicola, Ohana, Ritz, Rip It, Rip It 2oz Shot, Ritz and Shasta. The company was founded by Nick A. Caporella in 1985 and is headquartered in Fort Lauderdale, FL.
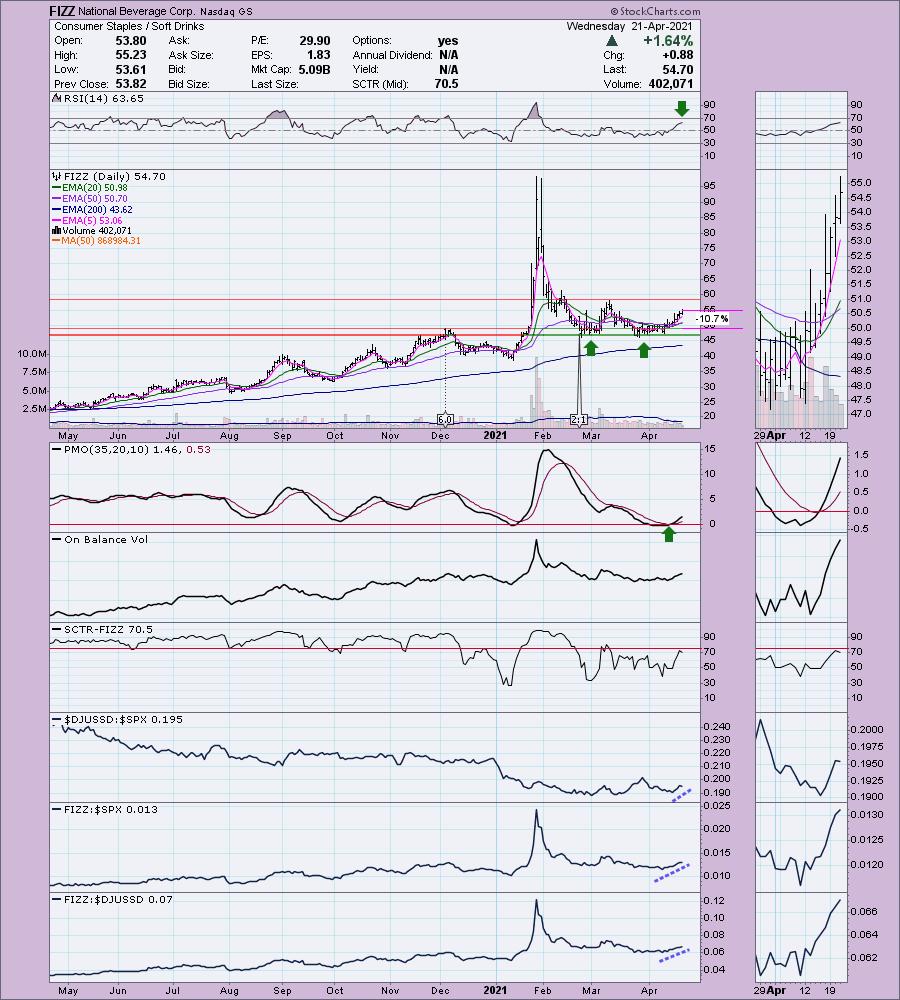
Below is the commentary and chart from Wednesday 4/21:
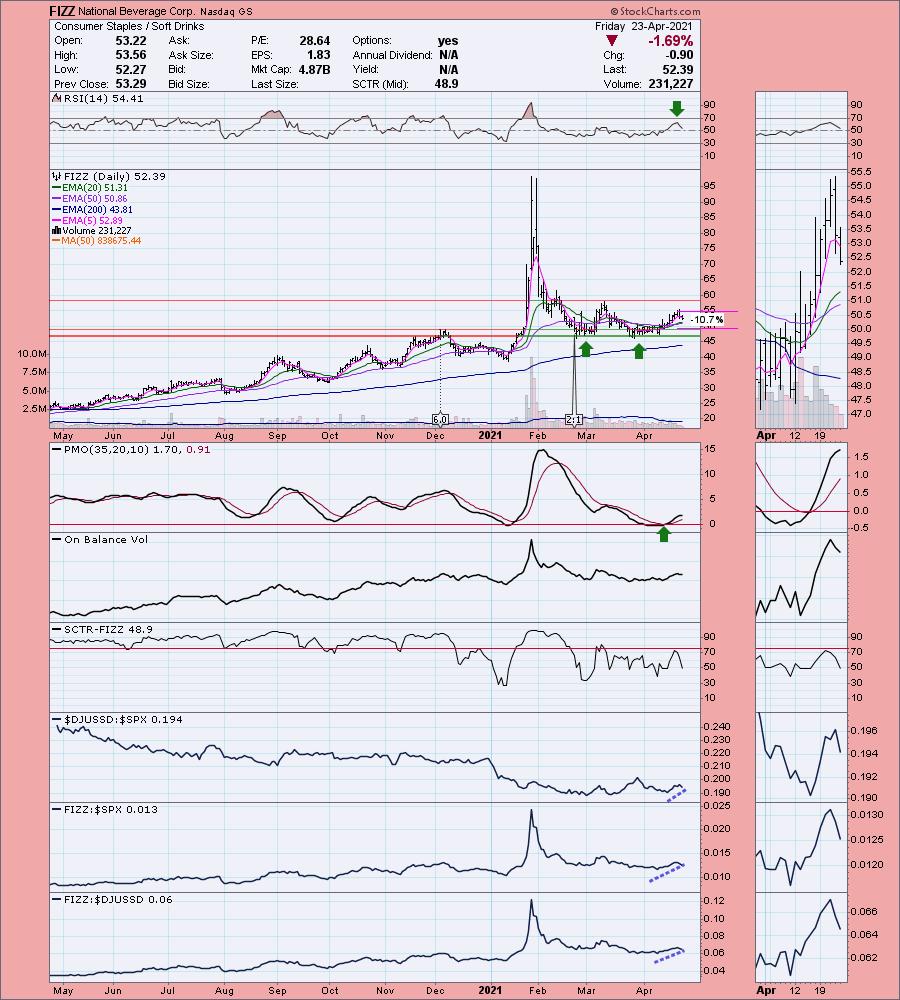
"FIZZ is down -1.16% in after hours trading. I'm in the process of trying to get it in after hours trading on a limit order. If it doesn't execute, I'll be watching in the morning. I covered FIZZ in the November 12th 2020 report. It has since gone through a 2:1 split so based on that, the close was an adjusted $40.83. The stop was never hit and it is up 34.0% since then. However, on that closing high from 1/27/2020, it was up over 111%. There is a nice double-bottom pattern. It hasn't actually executed yet, but we're lying in wait. The PMO gave us a crossover BUY signal and yesterday it had a positive 20/50-EMA "Silver Cross" which triggered an IT Trend Model BUY signal. Volume is coming in and it is beginning to outperform. The RSI is positive and not overbought. This looks like an excellent basing pattern for FIZZ to break from. The stop is deep and honestly could be deeper, but I opted to lay it on support at the December top."
Below is today's chart:
While this was the biggest loser this week, I have to say the chart doesn't look that bad. I'm not making excuses for it because I own it. The RSI remains positive. Although the PMO was damaged by the decline yesterday and today, it is still rising. Performance has tanked, but on two days of deep decline, it isn't surprising. If it cannot hold the 50-EMA, I will be selling it. I do see a possible cup and handle pattern developing so the expectation is that it will turn around here.
THIS WEEK's Sector Performance: 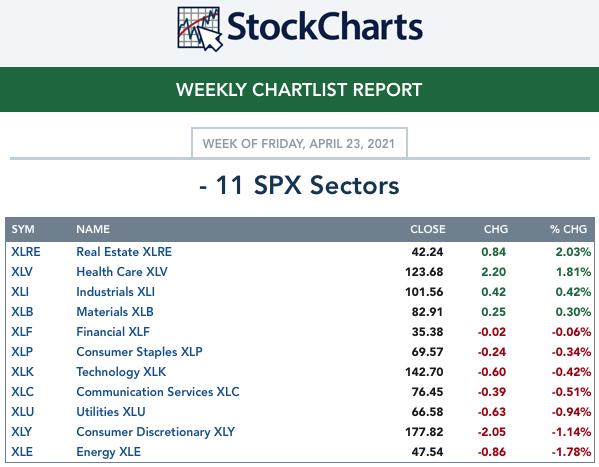
Click Here to view Carl's annotated Sector ChartList!
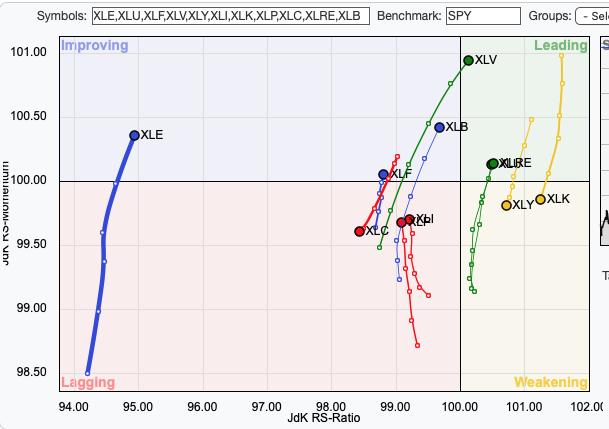
CONCLUSION:
There is quite a bit of overlap on the Relative Rotation Graph (RRG). Remember we want to seek out sectors that are moving in a Northeast direction. Nearly all of the sectors are doing this, or at least rising with the exception of XLC, XLK and XLY. This suggests we don't want to be in those areas of the market next week.
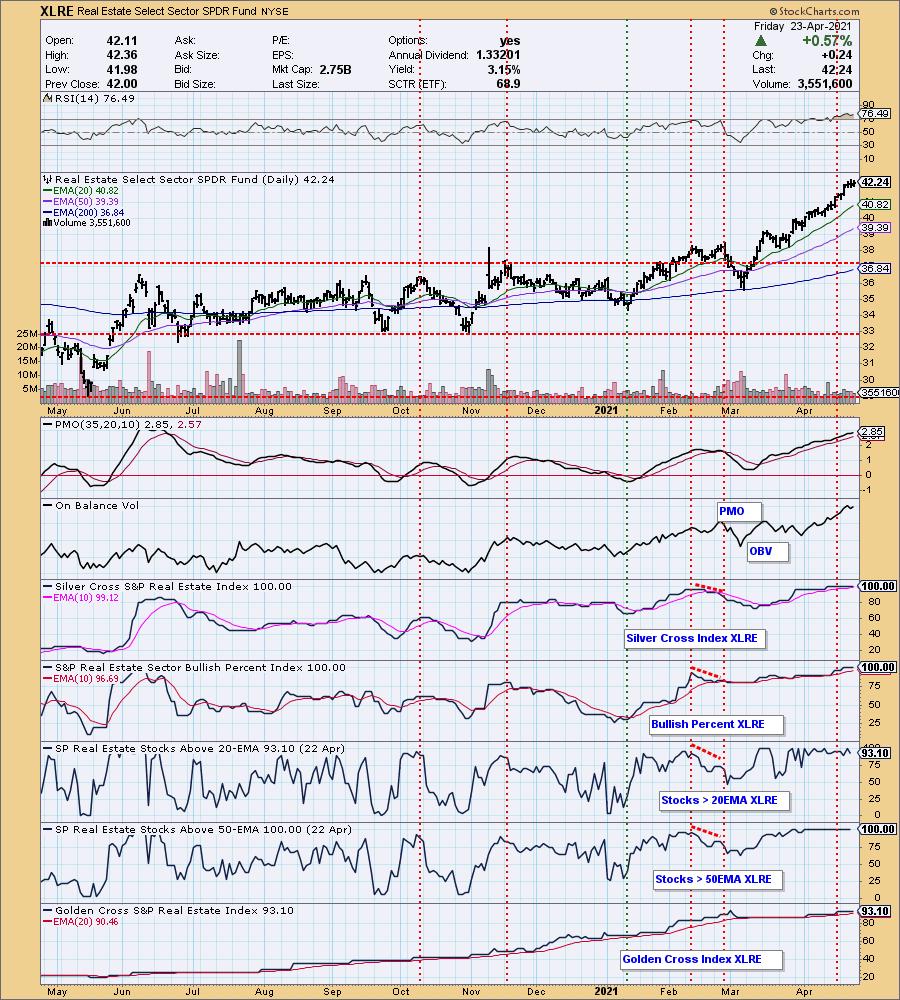
Sector to Watch: Real Estate (XLRE)
In the Diamond Mine today I explained why I like this sector the most moving into next week. The last part of this week XLRE paused. Notice its personality during this rally. It rallies strongly then digests, it rallies strongly and then digests... It's in digest mode right now which suggests to me it will rally next week. The technicals under the hood support this. They show strong participation. Granted this sector is highly overbought right now, but watch for more digestion and a follow-on rally. The market looks toppy again and this sector is considered "defensive".
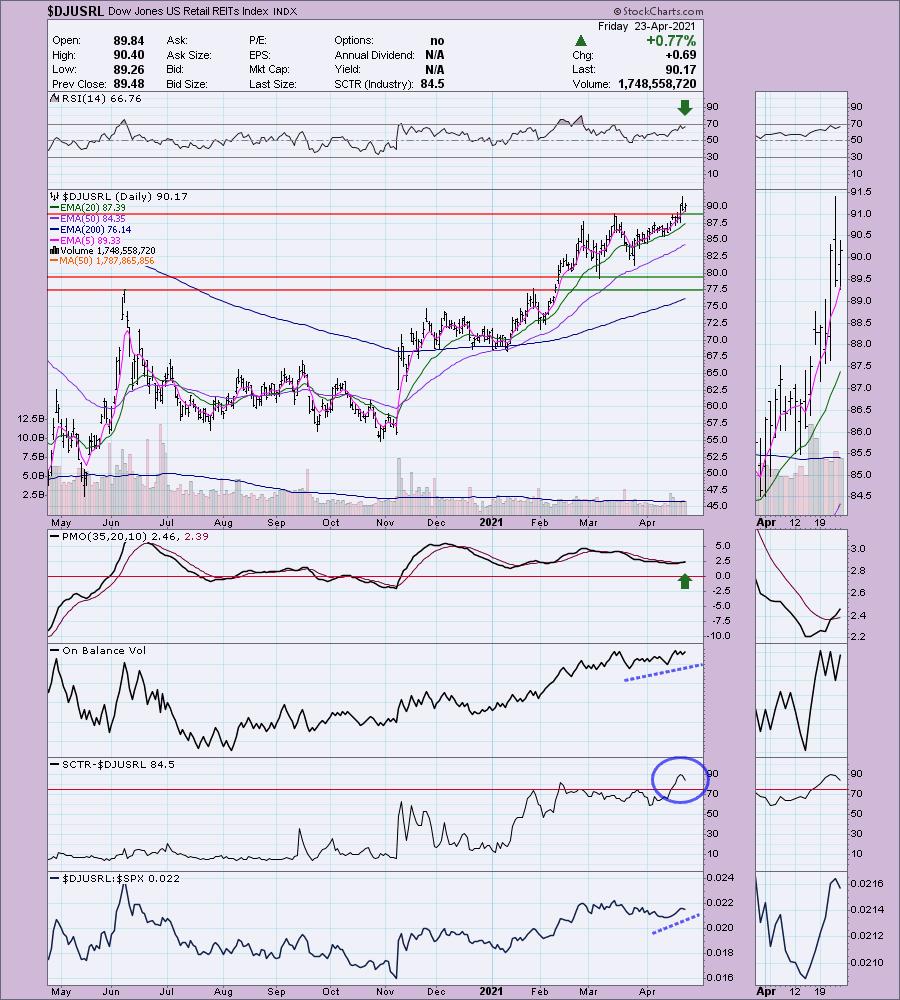
Industry Group to Watch: Retail REITs ($DJUSRL)
Last week Gold Miners (GDX) was my industry group to watch. It was up a modest +0.08%. I still like this industry group moving ahead. GDXJ, a "diamond in the rough" yesterday (full disclosure: I own GDXJ).
Really most of the Real Estate industry groups look healthy with the exception of Mortgage REITs. Checking out the different charts this morning, I decided I liked this one the best. It needs to stay above support, but even if it pulls back to the 20-EMA, it will still be bullish in my mind. In today's Diamond Mine I showed everyone how to find stocks within a strong industry group. Definitely a must see recording.
Go to our Sector ChartList on DecisionPoint.com to get an in depth view of all the sectors.
Technical Analysis is a windsock, not a crystal ball.
Have a great weekend & Happy Charting!
- Erin
erin@decisionpoint.com
Full Disclosure: I'm about 85% invested right now and 15% is in 'cash', meaning in money markets and readily available to trade with. This week I added Diamonds: FIZZ and GDXJ.
Watch the latest episode of DecisionPoint with Carl & Erin Swenlin on Mondays 7:00p EST or on the DecisionPoint playlist on the StockCharts TV YouTube channel here!
NOTE: The stocks reported herein are from mechanical trading model scans that are based upon moving average relationships, momentum and volume. DecisionPoint analysis is then applied to get five selections from the scans. The selections given should prompt readers to do a chart review using their own analysis process. This letter is not a call for a specific action to buy, sell or short any of the stocks provided. There are NO sure things or guaranteed returns on the daily selection of "diamonds in the rough."
Helpful DecisionPoint Links:
DecisionPoint Shared ChartList and DecisionPoint Chart Gallery
Price Momentum Oscillator (PMO)
Swenlin Trading Oscillators (STO-B and STO-V)