
Yesterday's "under the radar" industry group and stocks killed it today! I expect them to continue to outperform by a mile so if you didn't read yesterday's Diamonds Report, you really should. I found quite a few stocks today, but narrowed them down to my three for the day. You'll likely recognize all of their names. However, I have included the "runner ups" in the "Stocks to Review" section.
Cannabis stocks took off today. I did hop into ACB and took a small position in CLVR.
Note: On Memorial Day, May 31st, I WILL be holding the free DP Trading Room. Come join me!
Today's "Diamonds in the Rough" are: MAR, SONO and SQ.
Stocks/ETFs to Review (no order): DIS, NOW, OSPN, ACLS, AMED, KROS, KTOS, LHCG, OKTA and TWST.
 Diamond Mine REGISTRATION Information:
When: May 28, 2021 09:00 AM Pacific Time (US and Canada)
Topic: DecisionPoint Diamond Mine LIVE Trading Room
Register in advance for this webinar HERE.
After registering, you will receive a confirmation email containing information about joining the webinar, including the password. SAVE IT! Zoom doesn't always send out the reminders.
=======================================================================
Diamond Mine RECORDING Link:
Topic: DecisionPoint Diamond Mine (5/21/2021) LIVE Trading Room
Start Time : May 21, 2021 09:00 AM
Meeting Recording Link.
Access Passcode: May-21-21
***Click here to register for this recurring free DecisionPoint Trading Room on Mondays at Noon ET!***
+++++++++++++++++++++++++++++++++++++++++++++++++++++++++++++++++++++++++++++++
Free DP Trading Room RECORDING LINK:
Topic: DecisionPoint Trading Room
Start Time : May 24, 2021 08:55 AM
DP Trading Room Recording Link.
Access Passcode: may24-2021
For best results, copy and paste the access code to avoid typos.
Welcome to DecisionPoint Daily Diamonds, wherein I highlight five "diamonds in the rough." These are selected from the results of my DecisionPoint scans, which search for stocks that could benefit from the trend and condition of the market. Remember, these are not recommendations to buy or sell, but are the most interesting of the stocks that surfaced in my scans. My objective is to save you the work of the initial, tedious culling process, but you need to apply your own analysis to see if these stocks pique your interest as well. There are no guaranteed winners here!
Marriott Intl Inc (MAR)
EARNINGS: 8/9/2021 (BMO)
Marriott International, Inc. engages in the operation and franchise of hotel, residential, and timeshare properties. It operates through the following business segments: U.S. & Canada; Asia Pacific; and Europe, Middle East and Africa ("EMEA"). The company was founded by J. Wiliard Marriot and Alice Sheets Marriott in 1927 and is headquartered in Bethesda, MD.
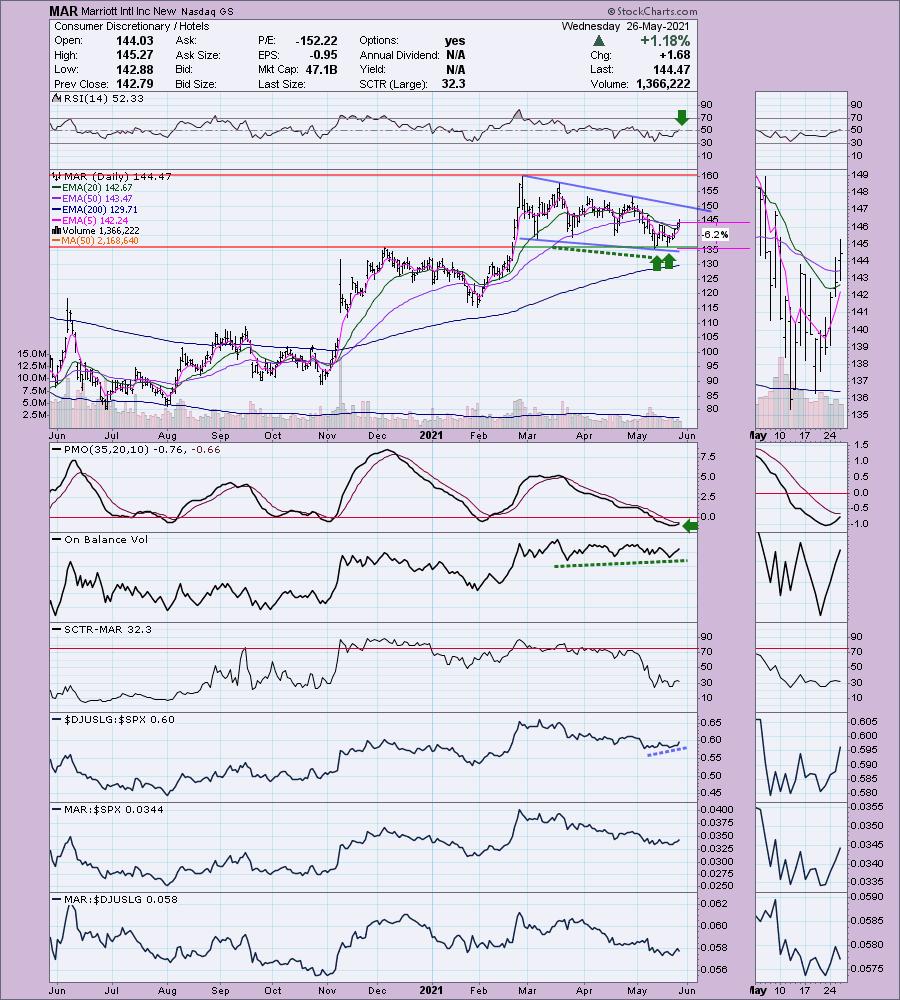
MAR is unchanged in after hours trading. The chart looks very favorable and I have to believe that with summer upon us that hotels will see far more guests than last year. The technicals are what I really care about though. There is a bullish falling wedge in the intermediate-term and a double-bottom in the short term. The RSI just entered positive territory and the PMO is rising toward a crossover BUY signal. We even have a positive OBV divergence. It's performing in line with the SPX for now, but you can see in the thumbnail that in the very short term, it has begun to outperform. I also like that the stop is very reasonable. You don't have to stick your neck out too far.
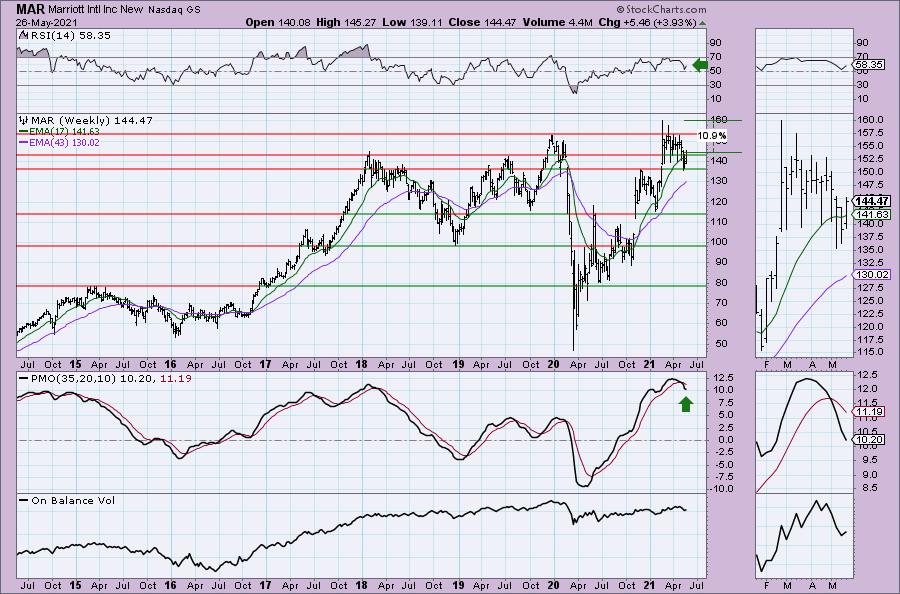
Support held at the 2020 top and is rising again. The RSI is positive. The PMO is beginning to decelerate somewhat. It is about 11% away from its all-time highs.
Sonos Inc. (SONO)
EARNINGS: 8/11/2021 (AMC)
Sonos, Inc. provides multi-room wireless smart home sound systems. It supports streaming services around the world, providing customers with access to music, Internet radio, podcasts, and audiobooks, with control from Android smartphones, iPhone, or iPad. The company was founded by Mai Trung, John MacFarlane, Craig A. Shelburne and Thomas S. Cullen in 2002 and is headquartered in Santa Barbara, CA.
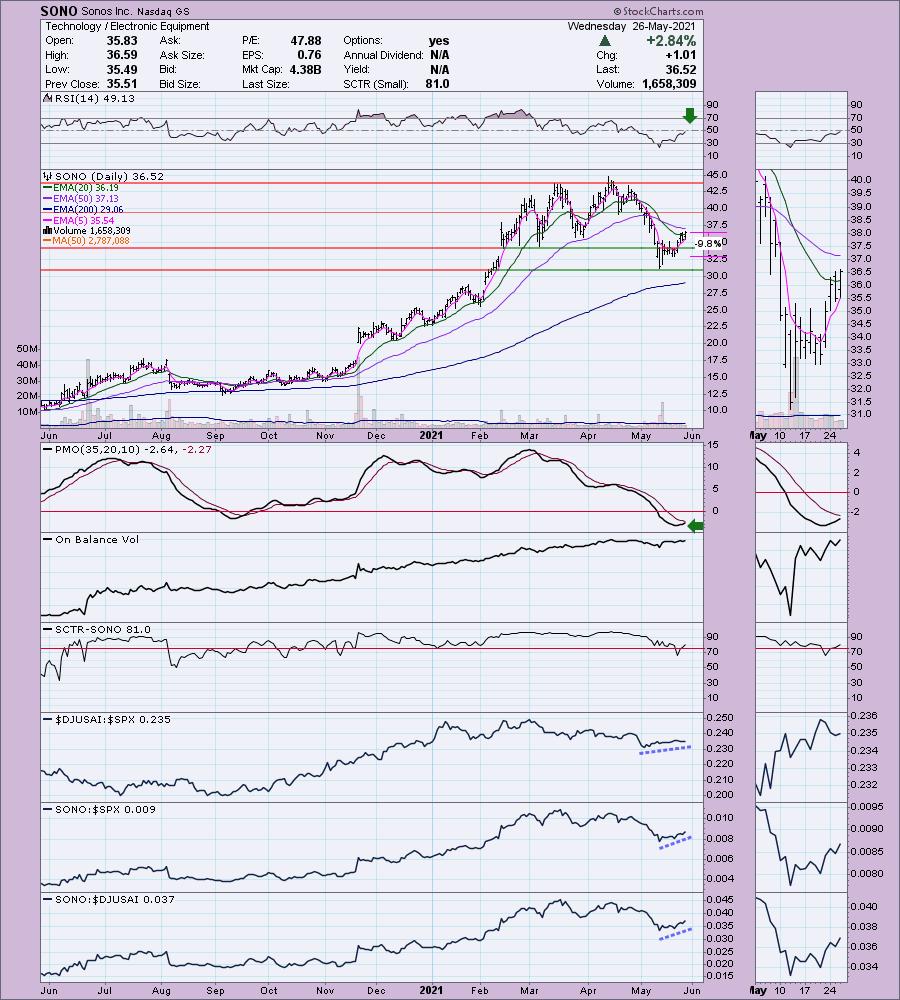
SONO is up +0.14% in after hours trading. I've covered SONO twice before on June 18th 2020 (the stop was never hit on this reader request so it is up +194.6% since) and October 27th 2020 (the 9.2% stop was hit days later, but after the stop was hit, it never looked back, if the stop were at 9.4% instead, the position would've been up +125.8%).
I love the Sonos products and would definitely recommend them all. As for the stock, I like it right now coming out of this deep correction. I saw this one on my scans yesterday, but I didn't like that it had closed below the 20-EMA near its low for the day. Today it closed above the 20-EMA. The RSI is nearing positive territory and the PMO is rising from oversold territory toward a crossover BUY signal. The 5-EMA is nearing a positive crossover the 20-EMA and that would be a ST Trend Model BUY signal. The group and SONO are beginning to outperform. The stop level was tough. The deepest I would set it is $32.50 or just above.
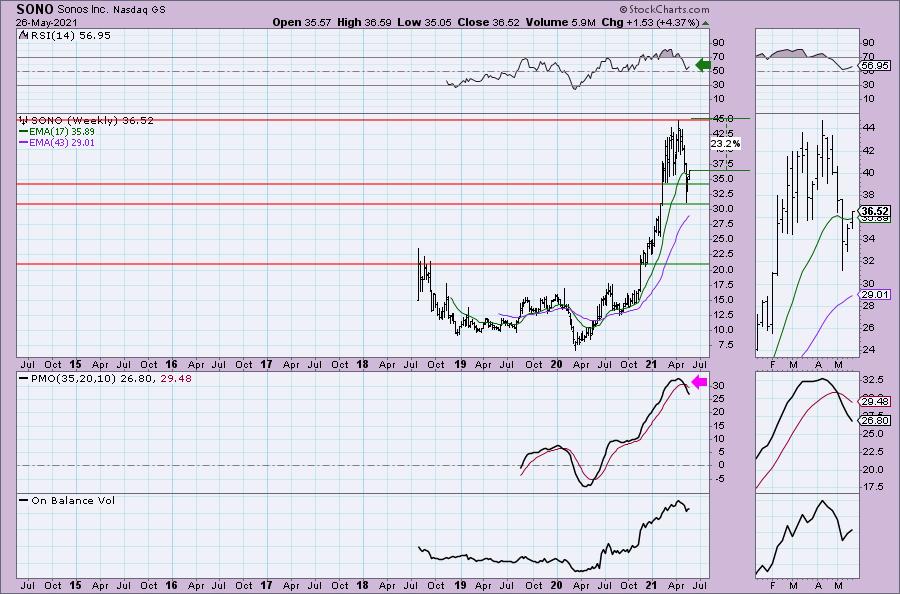
The weekly PMO doesn't look good, but it may be decelerating? The RSI turned up before reaching negative territory. I like that price has gotten above resistance and the 17-week EMA.
Square, Inc. (SQ)
EARNINGS: 8/5/2021 (AMC)
Square, Inc. engages in the provision of credit card payment processing solutions. It is a cohesive commerce ecosystem that helps sellers start, run, and grow their businesses. The firms sellers downloads the Square Point of Sale mobile app, they can quickly and easily take their first payment, typically within minutes. Its system, sellers gain access to features such as next-day settlements, digital receipts, payment dispute management, data security, and Payment Card Industry compliance. The firm offers additional point-of-sale services, financial services, and marketing services. The company was founded by Cameron Walters, Tristan O'Tierney, Randy Reddig, Jack Dorsey, and Jim McKelvey in February 2009 and is headquartered in San Francisco, CA.
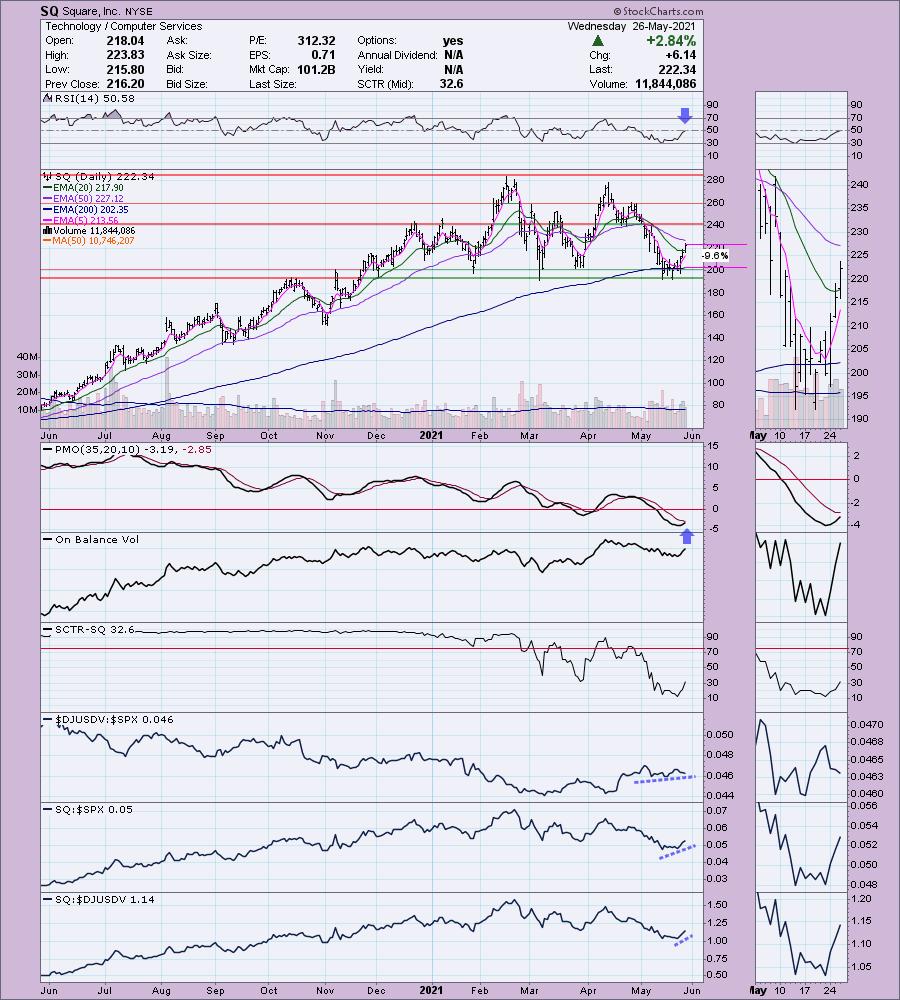
SQ is up +0.02% in after hours trading. I covered SQ in the September 29th 2020 issue of Diamonds. The stop was never hit so the position is up +35.0% currently. Technology has awakened and this stock finally is too. The RSI just reached positive territory and the PMO is rising toward a crossover BUY signal. Volume is coming in based on the OBV. The SCTR is rising and that's sufficient. It is beginning to outperform the group and the SPX. The stop is deeper than I prefer, but it needs to be given today's huge gain. If you watch the 5-min candlestick tomorrow, you might be able to get it on a pullback and set a lower stop than this, preferably at the May low.
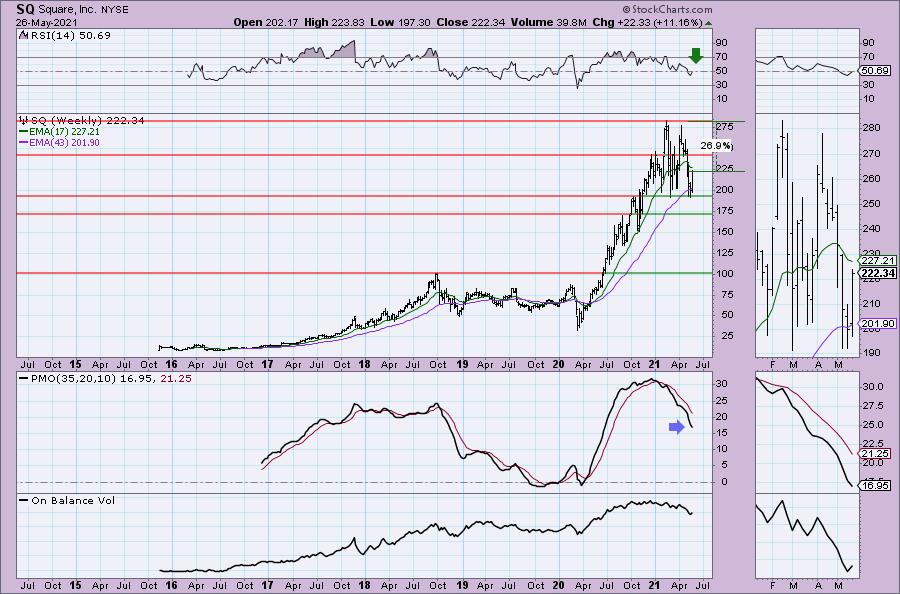
The weekly PMO is decelerating and the RSI just ticked back up into positive territory. I like how price bounced off intermediate-term support just below $200. Upside potential is nearly 27%.
Don't forget, on Thursdays I look at reader-requested symbols, so shoot me an email at erin@decisionpoint.com. I read every email I receive and try to answer them all!
Current Market Outlook:
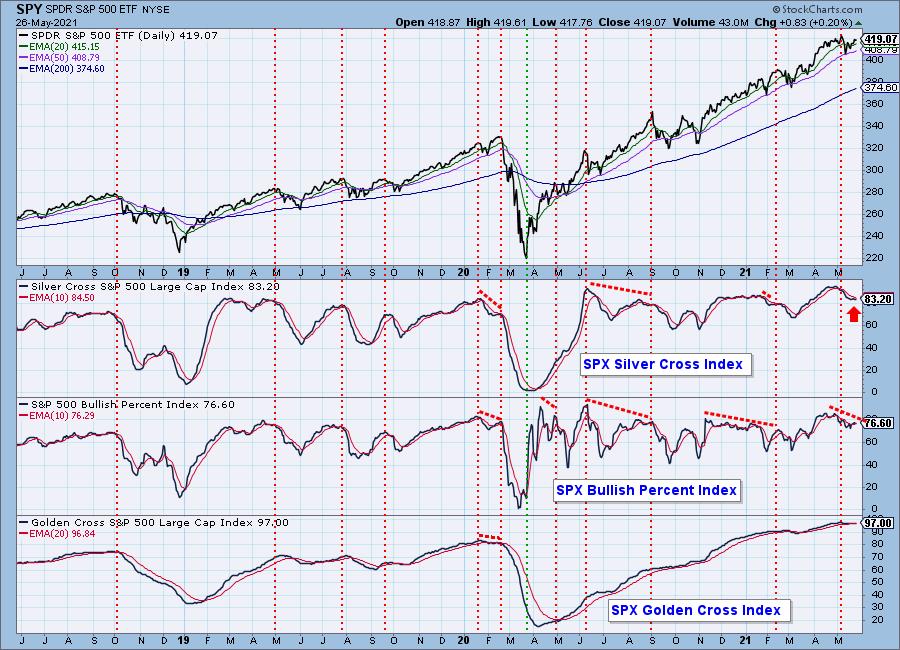
Market Environment: It is important to consider the odds for success by assessing the market tides. The following chart uses different methodologies for objectively showing the depth and trend of participation for intermediate- and long-term time frames.
- The Silver Cross Index (SCI) shows the percentage of SPX stocks on IT Trend Model BUY signals (20-EMA > 50-EMA)
- The Golden Cross Index (GCI) shows the percentage of SPX stocks on LT Trend Model BUY signals (50-EMA > 200-EMA)
- The Bullish Percent Index (BPI) shows the percentage of SPX stocks on Point & Figure BUY signals.
Don't forget that as a "Diamonds" member, you have access to our GCI/SCI curated ChartList on DecisionPoint.com. You'll find it under "Members Only" links on the left side on the Blogs and Links Page.
Here is the current chart:
Diamond Index:
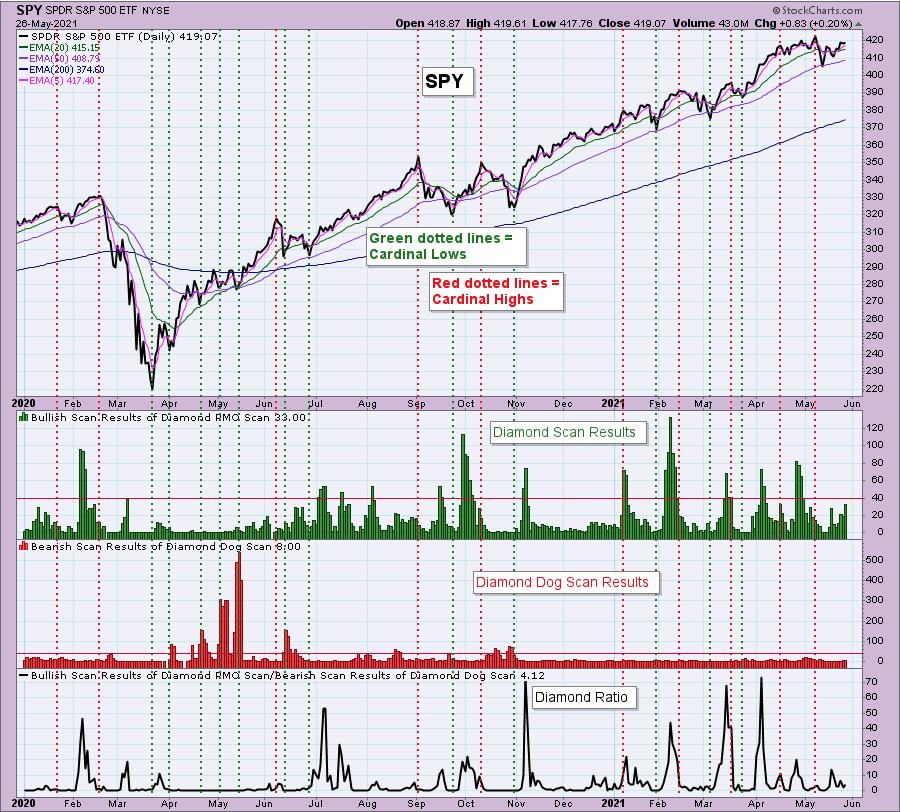
The Diamond Index chart looks at the number of scan results from my bullish Diamond PMO Scan and the number of scan results from the inverse Diamond Dog Scan. The Diamond Ratio divides the bullish results by the bearish results.
I only have data going back to October 2019 so I won't make any sweeping conclusions about the Diamond Index chart. I have marked cardinal tops with red dotted vertical lines and cardinal price bottoms with green dotted vertical lines. I believe that when the Diamond Dog results spike, it usually comes at a price bottom, or marks a strong continuation of the rising trend.
Unfortunately, the Diamond PMO Scan result numbers aren't providing much insight. The Diamond Ratio has promise, but again I don't see a clear correlation to the market tops/bottoms right now. I need to study and manipulate the data some more. Keep you posted!
Full Disclosure: I'm about 55% invested and 45% is in 'cash', meaning in money markets and readily available to trade with.
Technical Analysis is a windsock, not a crystal ball.
Happy Charting!
- Erin
erin@decisionpoint.com
Watch the latest episode of DecisionPoint with Carl & Erin Swenlin on Mondays 7:00p EST or on the DecisionPoint playlist on the StockCharts TV YouTube channel here!
NOTE: The stocks reported herein are from mechanical trading model scans that are based upon moving average relationships, momentum and volume. DecisionPoint analysis is then applied to get five selections from the scans. The selections given should prompt readers to do a chart review using their own analysis process. This letter is not a call for a specific action to buy, sell or short any of the stocks provided. There are NO sure things or guaranteed returns on the daily selection of "diamonds in the rough."
Helpful DecisionPoint Links:
DecisionPoint Shared ChartList and DecisionPoint Chart Gallery
Price Momentum Oscillator (PMO)
Swenlin Trading Oscillators (STO-B and STO-V)
For more links, go to DecisionPoint.com
