
One industry group revealed some very interesting turnaround stocks that right now are "under the radar". They won't be soon! I ran "Carl's Scan" which finds down and out stocks that are beginning to reverse and show promise. This scan doesn't always produce good "diamonds in the rough" as it is fairly clear on some that overhead resistance will hold them back or relative performance isn't good. Many times the RSIs are negative.
In today's case, Cannabis stocks arrived in my results and I really like the way these charts are shaping up for a reversal. Very soon Congress will be presenting legislation to legalize or at least remove many of the restrictions for its use (maybe drop from Schedule 1 drug list? Not clear yet if it will). These stocks have been beaten down to oblivion and now I see strong reversals taking place. These would be longer-term, but will require early oversight to make sure the reversal isn't a fake out. Renewable Energy is losing momentum after what looked like a strong reversal. We don't want the same to happen on these.
I also added Boeing (BA), it has a very bullish chart and is also reversing. I recommend doing some homework on the "Stocks to Consider" today. It was difficult to pick my favorites.
Note: On Memorial Day, May 31st, I WILL be holding the free DP Trading Room. Come join me!
Today's "Diamonds in the Rough" are: ACB, BA, CGC and CLVR.
Stocks/ETFs to Review (no order): IIPR, JBL, CVNA, CGNX and TDC.
 Diamond Mine REGISTRATION Information:
When: May 28, 2021 09:00 AM Pacific Time (US and Canada)
Topic: DecisionPoint Diamond Mine LIVE Trading Room
Register in advance for this webinar HERE.
After registering, you will receive a confirmation email containing information about joining the webinar, including the password. SAVE IT! Zoom doesn't always send out the reminders.
=======================================================================
Diamond Mine RECORDING Link:
Topic: DecisionPoint Diamond Mine (5/21/2021) LIVE Trading Room
Start Time : May 21, 2021 09:00 AM
Meeting Recording Link.
Access Passcode: May-21-21
***Click here to register for this recurring free DecisionPoint Trading Room on Mondays at Noon ET!***
+++++++++++++++++++++++++++++++++++++++++++++++++++++++++++++++++++++++++++++++
Free DP Trading Room RECORDING LINK:
Topic: DecisionPoint Trading Room
Start Time : May 24, 2021 08:55 AM
DP Trading Room Recording Link.
Access Passcode: may24-2021
For best results, copy and paste the access code to avoid typos.
Welcome to DecisionPoint Daily Diamonds, wherein I highlight five "diamonds in the rough." These are selected from the results of my DecisionPoint scans, which search for stocks that could benefit from the trend and condition of the market. Remember, these are not recommendations to buy or sell, but are the most interesting of the stocks that surfaced in my scans. My objective is to save you the work of the initial, tedious culling process, but you need to apply your own analysis to see if these stocks pique your interest as well. There are no guaranteed winners here!
Aurora Cannabis Inc. (ACB)
EARNINGS: 9/21/2021 (AMC)
Aurora Cannabis, Inc. engages in the production, distribution and sale of cannabis products. It also produces and sells indoor cultivation systems and hemp related food products. The company was founded by Terry Booth and Steve Dobler on December 21, 2006 and is headquartered in Calgary, Canada.
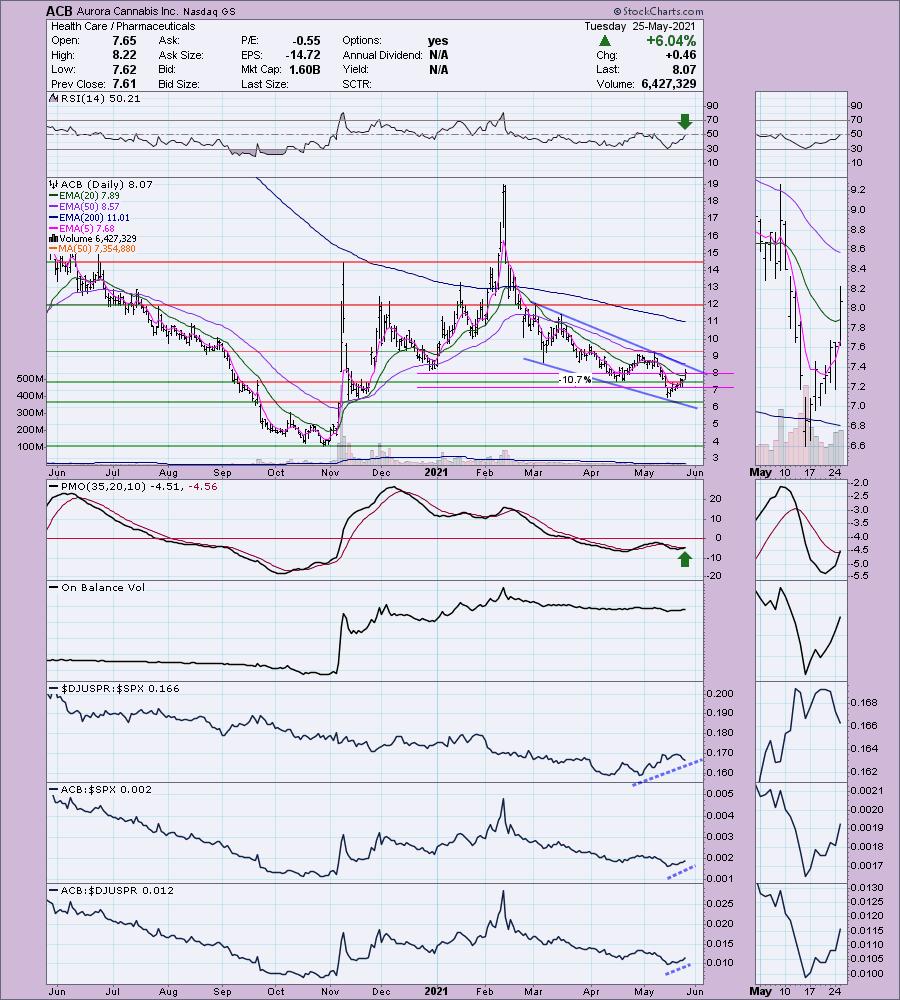
ACB is up +0.74% in after hours trading. Here's our first cannabis stock. It is low-priced so be sure to position size appropriately to manage risk. The RSI just entered positive territory and the PMO is on a BUY signal today. These are the exact conditions I use to find a buy point on a 5-minute candlestick. There is a bullish falling wedge, although it hasn't broken out of it yet. I like that we had a strong rally above the 20-EMA. Pharma is beginning to wane against the SPX near-term, but relative performance is trending upward. ACB is outperforming both its group and the SPX. It is tough to set a stop given today's powerful move up, but I think anything just below the April trough is appropriate.
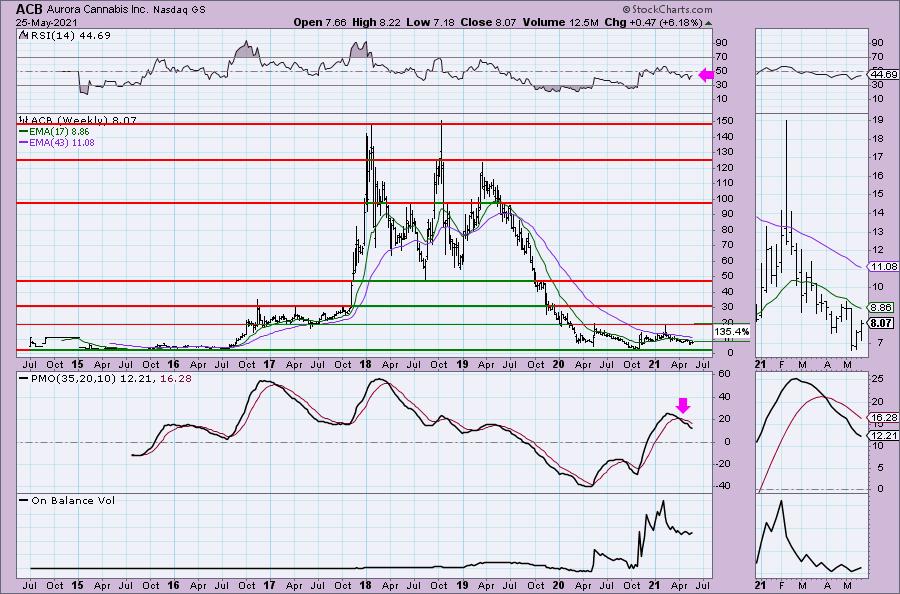
The weekly charts on the "diamonds in the rough" today are pretty stinky, but the stocks have been beat down so it shouldn't surprise us to see falling PMOs and negative RSIs. We're trying to get in on this early.
Boeing Co. (BA)
EARNINGS: 7/28/2021 (BMO)
The Boeing Co. is an aerospace company, which engages in the manufacture of commercial jetliners and defense, space and security systems. It operates through the following segments: Commercial Airplanes; Defense, Space and Security; Global Services; and Boeing Capital. The Commercial Airplanes segment includes the development, production, and market of commercial jet aircraft and provides fleet support services, principally to the commercial airline industry worldwide. The Defense, Space and Security segment refers to the research, development, production and modification of manned and unmanned military aircraft and weapons systems for global strike, including fighter and combat rotorcraft aircraft and missile systems; global mobility, including tanker, rotorcraft and tilt-rotor aircraft; and airborne surveillance and reconnaissance, including command and control, battle management and airborne anti-submarine aircraft. The Global Services segment provides services to commercial and defense customers. The Boeing Capital segment seeks to ensure that Boeing customers have the financing they need to buy and take delivery of their Boeing product and manages overall financing exposure. The company was founded by William Edward Boeing on July 15, 1916 and is headquartered in Chicago, IL.
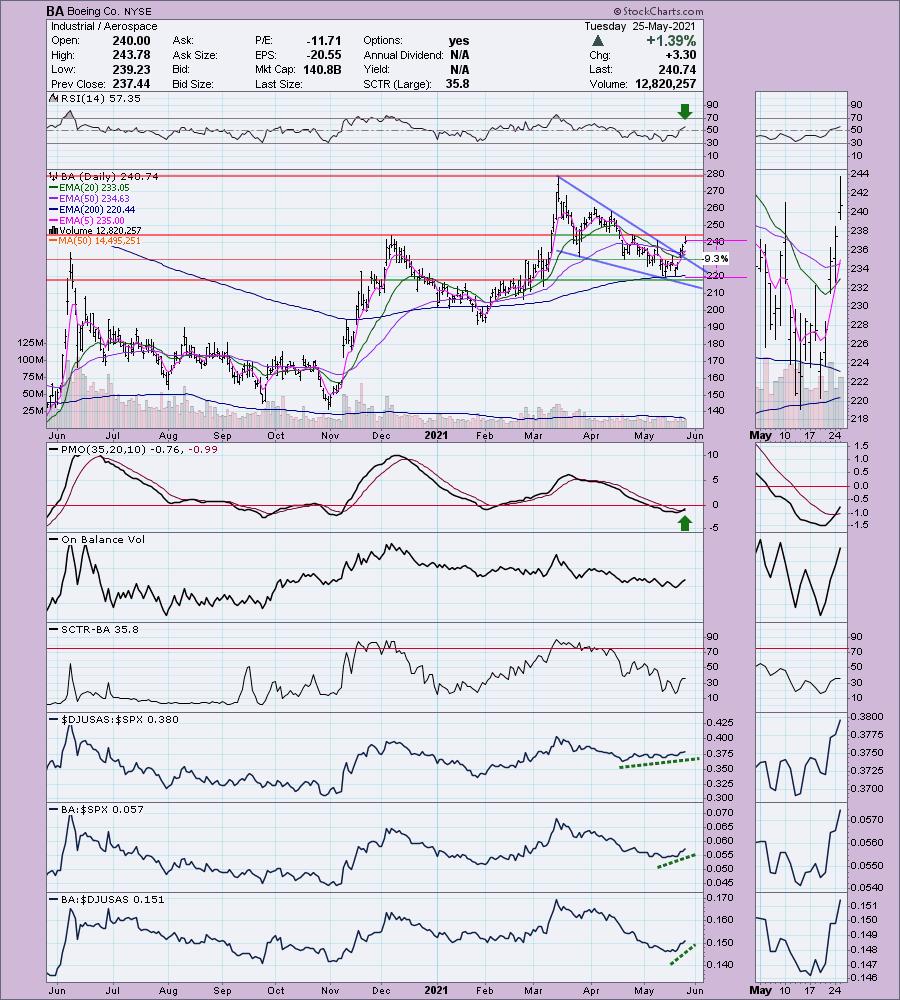
BA is up +0.21% in after hours trading. I covered BA back on May 29th, 2020 as a reader request that I was bullish on. The stop was never hit so the position is currently up 65.1%. Here we have a familiar bullish falling wedge. Price has already broken to the upside as expected and has now vaulted above the 5/20/50-EMAs. A Short-Term Trend Model BUY signal was triggered today as the 5-EMA crossed above the 20-EMA. It has reached overhead resistance at the December top, but given the newly positive RSI and PMO crossover BUY signal, I don't think it will have a problem with it. It's performing quite well against the group and SPX. The group is slowly beginning to outperform the SPX. The stop is set just below the 200-EMA.
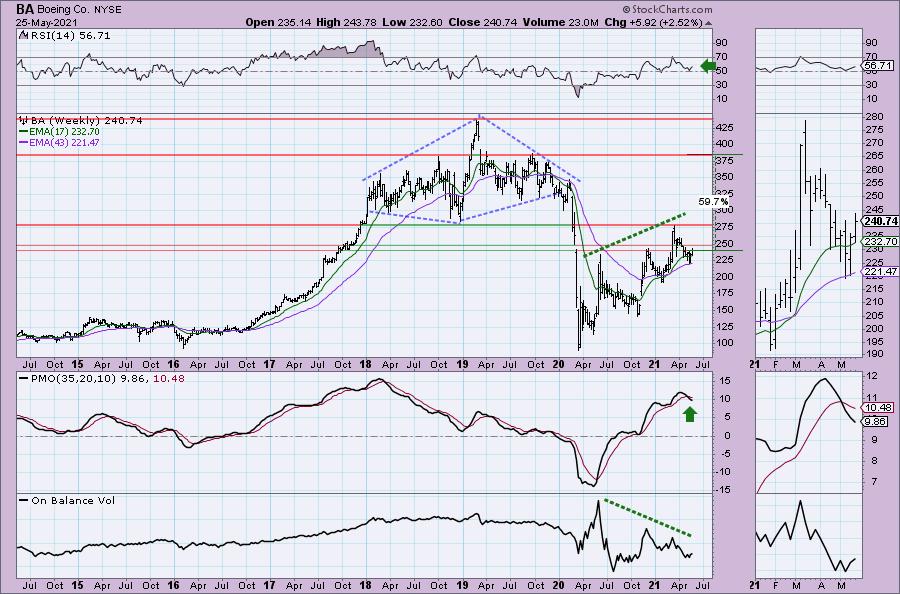
While the weekly PMO is on a SELL signal, it does appear to be decelerating somewhat. The weekly RSI is positive. You can see the resistance zone that BA is up against right now and there is a strong negative divergence with the OBV that I don't like. However, short term, I think we could at least reach $275. I annotated a "diamond" pattern that occurred between 2018 and 2020. These are reversal patterns that are rarely seen so here's your opportunity to view one :-).
Canopy Growth Corp. (CGC)
EARNINGS: 6/1/2021 (BMO) ** REPORTS TUESDAY **
Canopy Growth Corp. engages in the production and sale of medical cannabis. The company offers products including oils and concentrates, soft gel capsules and hemp. It focuses on the treatment of chronic pain, seizures, muscle spasms, nausea, and loss of appetite. The company was founded by Bruce Linton on August 5, 2009 and is headquartered in Smith Falls, Canada.
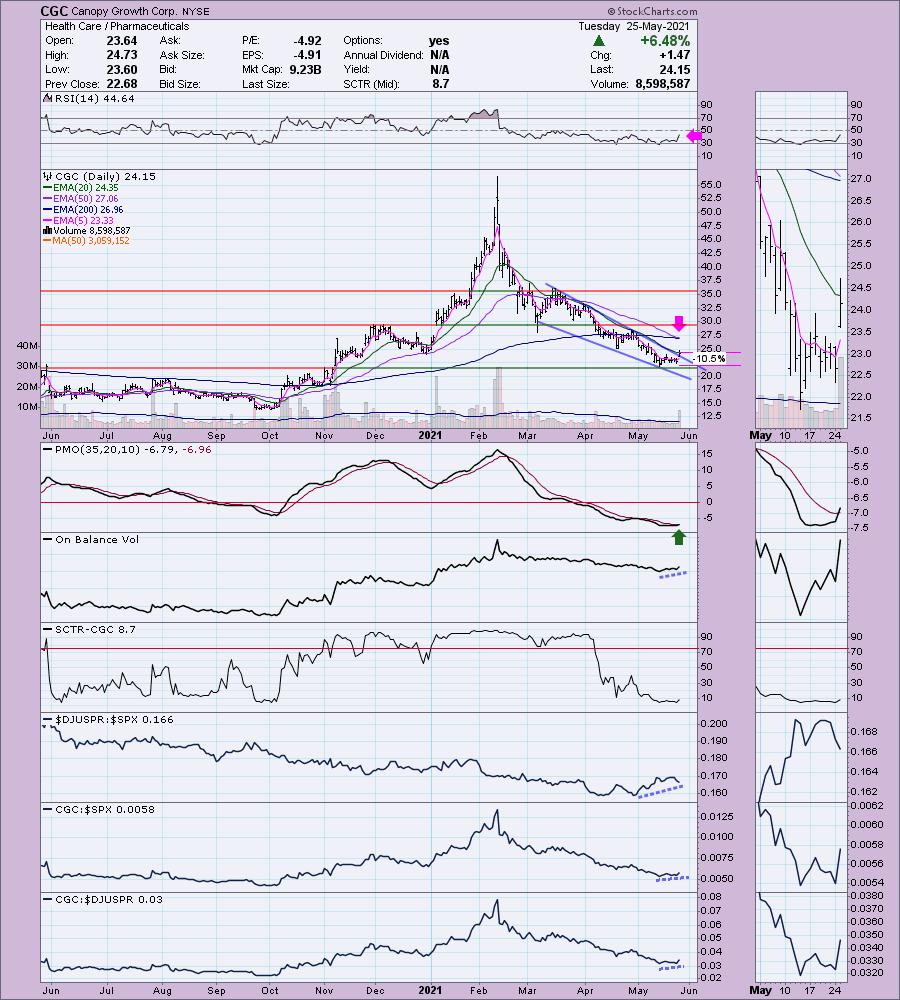
CGC is up +0.33% in after hours trading. CGC reports earnings on Tuesday and I really have no idea which way it will go, so if you give it a try, you may want to research the fundamentals a bit first. Normally I wouldn't present a chart like this one given the brand new "death cross" of the 50/200-EMAs, but I believe it is at a reversal point with upside potential that is staggering. The OBV is rising which is positive and we do have a brand new PMO BUY crossover BUY signal. The RSI is negative, but it is beginning to rise again. It's beginning to outperform the group and the SPX. In the thumbnail you can see a small bullish double-bottom. Today rally pushed price above the confirmation line. The stop is set at the first bottom.
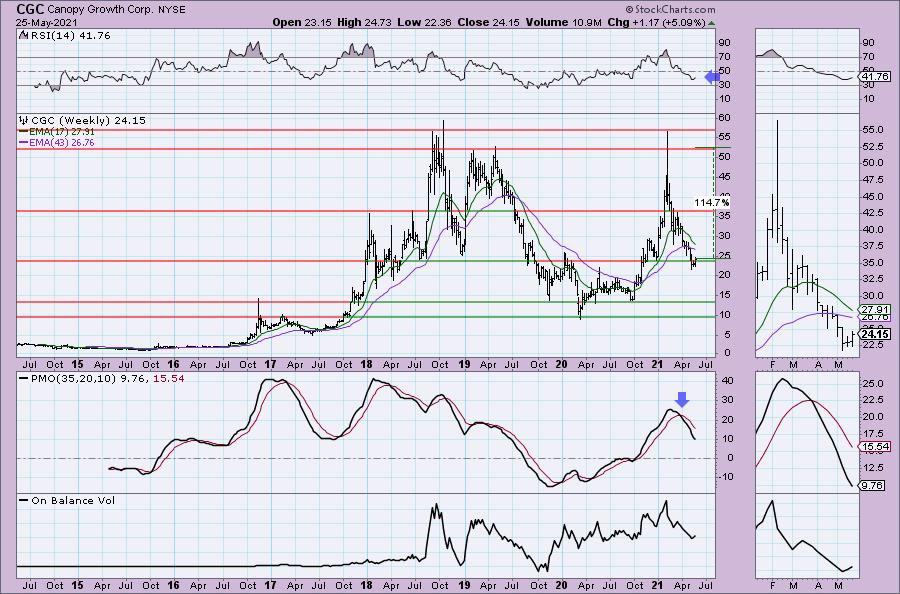
I'm not thrilled at all with CGC's weekly chart. The RSI is negative and the PMO is on a SELL signal and diving lower. If it can hold this support level, there is some great upside potential. I don't know if it will reclaim all-time highs, but even if it only reaches $35, that's an over 50% gain.
Clever Leaves International Inc. (CLVR)
EARNINGS: 8/12/2021 (AMC)
Clever Leaves Holdings, Inc. operates as a holding company. It produces pharmaceutical-grade cannabinoids. The company was founded on July 23, 2020 and is headquartered in New York, NY.
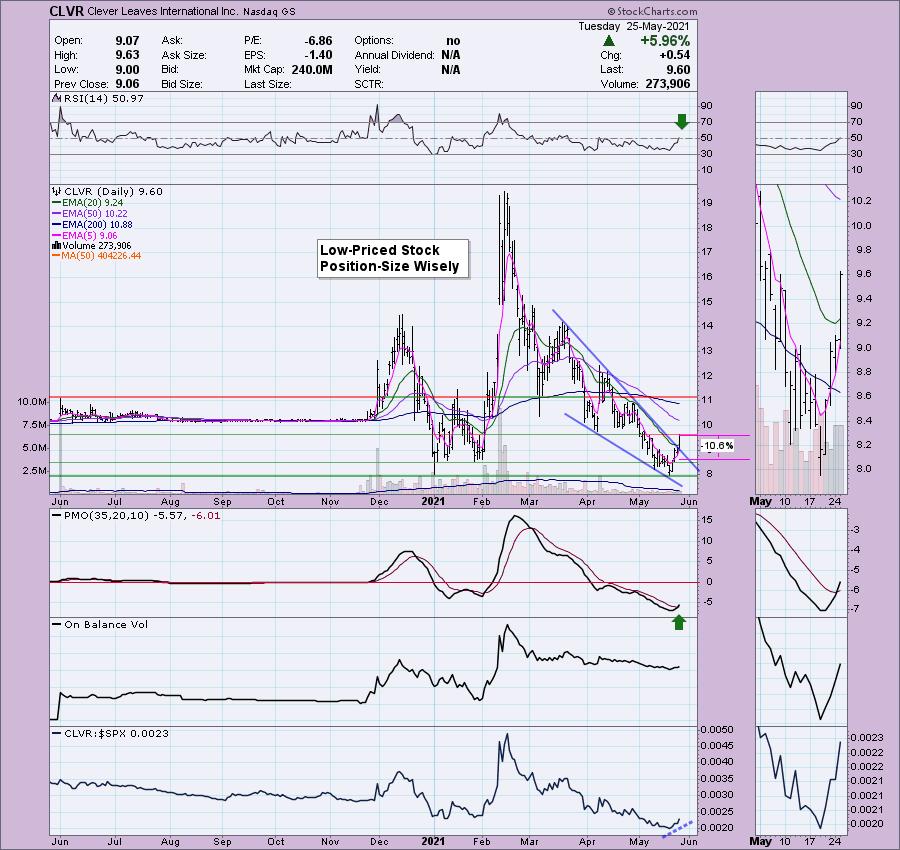
I'm not happy to report that CLVR is down -3.12% in after hours trading. However, even with that drop, it remains above the 20-EMA. It did hit overhead resistance so it isn't completely surprising to see it pulling back. There are plenty of positives on the chart. The RSI just reached positive territory. There is a large bullish falling wedge that resolved upward as expected today. The PMO just triggered a crossover BUY signal. We did see very strong volume coming in on this recent rally out of the May low. It is performing better than the SPX right now. The stop is very deep, another reason to position size carefully. If I could bring the stop down further I would, but I don't do stops that are much higher than 10%. This is already a stretch.
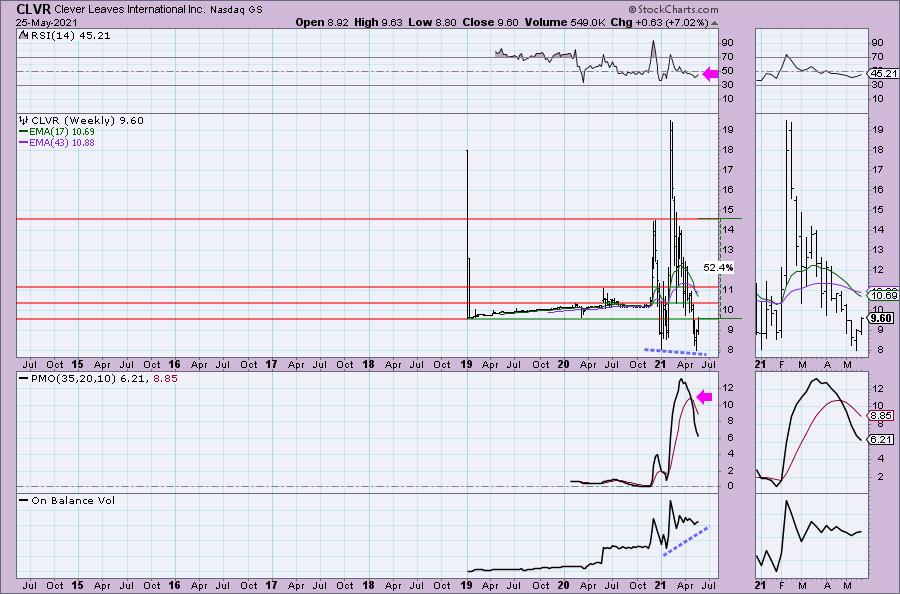
Overhead resistance is strong on the weekly chart. The weekly PMO is beginning to decelerate somewhat, but the RSI is still negative. There is an interesting positive divergence with the weekly OBV that could point to a recovery here. Just be careful with this one.
Don't forget, on Thursdays I look at reader-requested symbols, so shoot me an email at erin@decisionpoint.com. I read every email I receive and try to answer them all!
Current Market Outlook:
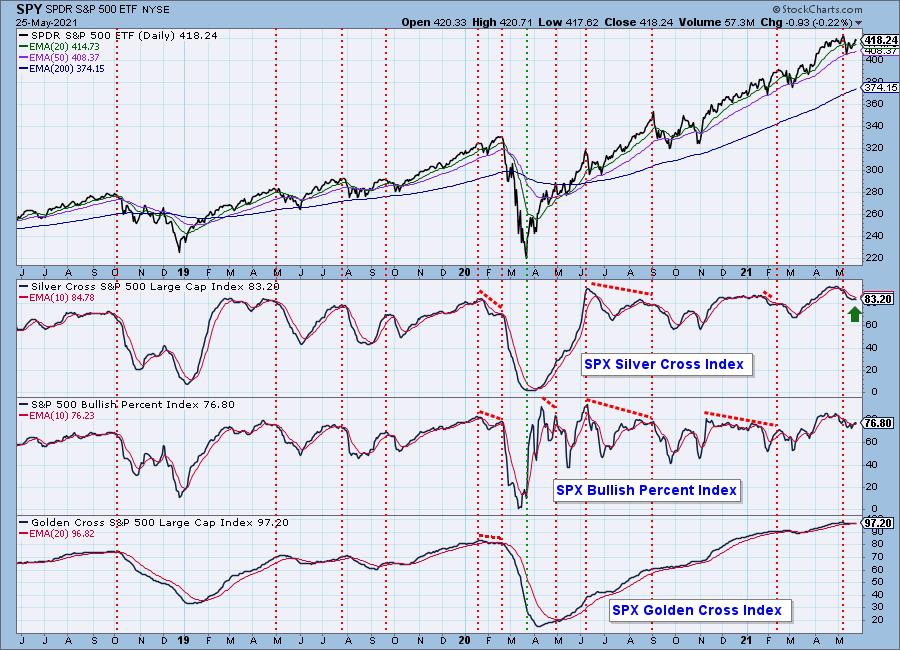
Market Environment: It is important to consider the odds for success by assessing the market tides. The following chart uses different methodologies for objectively showing the depth and trend of participation for intermediate- and long-term time frames.
- The Silver Cross Index (SCI) shows the percentage of SPX stocks on IT Trend Model BUY signals (20-EMA > 50-EMA)
- The Golden Cross Index (GCI) shows the percentage of SPX stocks on LT Trend Model BUY signals (50-EMA > 200-EMA)
- The Bullish Percent Index (BPI) shows the percentage of SPX stocks on Point & Figure BUY signals.
Don't forget that as a "Diamonds" member, you have access to our GCI/SCI curated ChartList on DecisionPoint.com. You'll find it under "Members Only" links on the left side on the Blogs and Links Page.
Here is the current chart:
Diamond Index:
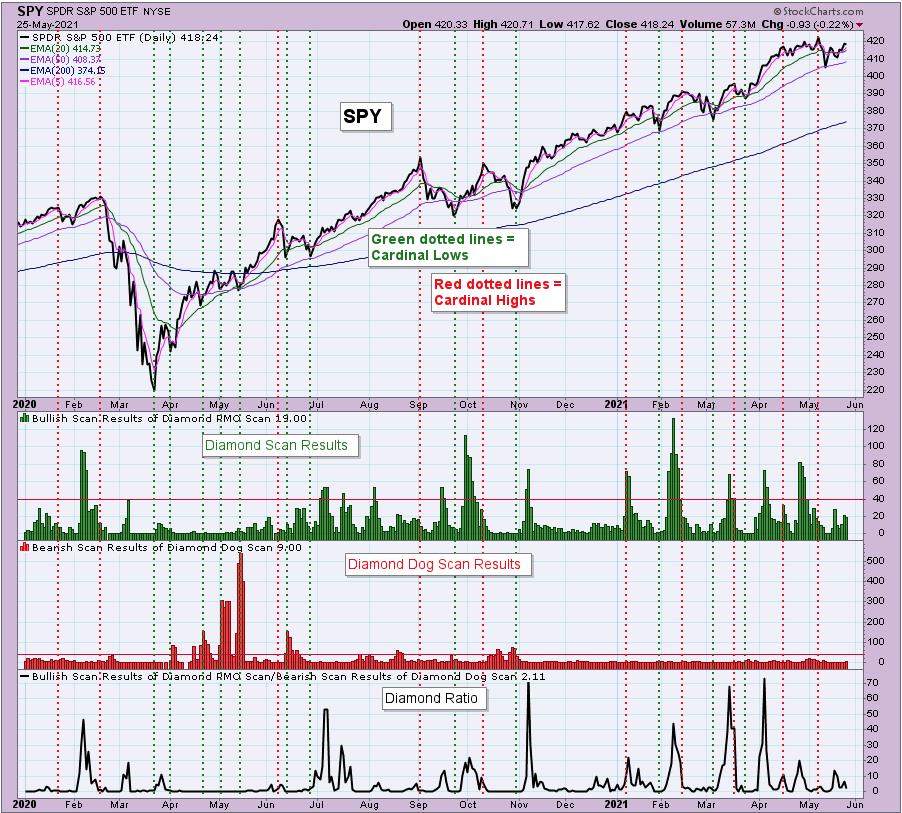
The Diamond Index chart looks at the number of scan results from my bullish Diamond PMO Scan and the number of scan results from the inverse Diamond Dog Scan. The Diamond Ratio divides the bullish results by the bearish results.
I only have data going back to October 2019 so I won't make any sweeping conclusions about the Diamond Index chart. I have marked cardinal tops with red dotted vertical lines and cardinal price bottoms with green dotted vertical lines. I believe that when the Diamond Dog results spike, it usually comes at a price bottom, or marks a strong continuation of the rising trend.
Unfortunately, the Diamond PMO Scan result numbers aren't providing much insight. The Diamond Ratio has promise, but again I don't see a clear correlation to the market tops/bottoms right now. I need to study and manipulate the data some more. Keep you posted!
Full Disclosure: I'm about 50% invested and 50% is in 'cash', meaning in money markets and readily available to trade with. Will likely add one of these cannabis stocks tomorrow.
Technical Analysis is a windsock, not a crystal ball.
Happy Charting!
- Erin
erin@decisionpoint.com
Watch the latest episode of DecisionPoint with Carl & Erin Swenlin on Mondays 7:00p EST or on the DecisionPoint playlist on the StockCharts TV YouTube channel here!
NOTE: The stocks reported herein are from mechanical trading model scans that are based upon moving average relationships, momentum and volume. DecisionPoint analysis is then applied to get five selections from the scans. The selections given should prompt readers to do a chart review using their own analysis process. This letter is not a call for a specific action to buy, sell or short any of the stocks provided. There are NO sure things or guaranteed returns on the daily selection of "diamonds in the rough."
Helpful DecisionPoint Links:
DecisionPoint Shared ChartList and DecisionPoint Chart Gallery
Price Momentum Oscillator (PMO)
Swenlin Trading Oscillators (STO-B and STO-V)
For more links, go to DecisionPoint.com
