
I had some great Reader Requests today, it was hard to decide! I'll list the ones I didn't look at in the "Stocks to Review" list because the majority of these stocks look enticing.
The four requests I picked today are breaking out or reversing off key moving averages. I still love the cannabis stocks so I decided to present the ETF, MJ as another alternative if you aren't comfortable trading the companies themselves. Upside potential is killer. The idea for MJ actually came from Danielle Shay, Director of Options at SimplerTrading during today's recording of "The Pitch". I'll tweet the link out this evening, but I believe you can see it live or on demand on StockChartsTV at 3:30p. Another weed stock to consider is TLRY. Just remember these stocks can be quite volatile so using the ETF may be a good option depending on your risk tolerance.
Tomorrow is the "Diamond Mine" trading room at Noon ET. Here is the registration link. It's also below (where it always is).
Note: On Memorial Day, May 31st, I WILL be holding the free DP Trading Room. Come join me! Register Here (once registered, you do not need to register again since it is a free recurring webinar).
Today's "Diamonds in the Rough" are: AVNW, INMD, KBH, MGM and MJ.
Stocks/ETFs to Review (no order): TLRY, MTH, PHM, LGIH, CWK, ITRN, VIAV, ADSK, BNED, PANW, PODD, UMC, ASAN, FCEL and CDNA.
 Diamond Mine REGISTRATION Information:
When: May 28, 2021 09:00 AM Pacific Time (US and Canada)
Topic: DecisionPoint Diamond Mine LIVE Trading Room
Register in advance for this webinar HERE.
After registering, you will receive a confirmation email containing information about joining the webinar, including the password. SAVE IT! Zoom doesn't always send out the reminders.
=======================================================================
Diamond Mine RECORDING Link:
Topic: DecisionPoint Diamond Mine (5/21/2021) LIVE Trading Room
Start Time : May 21, 2021 09:00 AM
Meeting Recording Link.
Access Passcode: May-21-21
***Click here to register for this recurring free DecisionPoint Trading Room on Mondays at Noon ET!***
+++++++++++++++++++++++++++++++++++++++++++++++++++++++++++++++++++++++++++++++
Free DP Trading Room RECORDING LINK:
Topic: DecisionPoint Trading Room
Start Time : May 24, 2021 08:55 AM
DP Trading Room Recording Link.
Access Passcode: may24-2021
For best results, copy and paste the access code to avoid typos.
Welcome to DecisionPoint Daily Diamonds, wherein I highlight five "diamonds in the rough." These are selected from the results of my DecisionPoint scans, which search for stocks that could benefit from the trend and condition of the market. Remember, these are not recommendations to buy or sell, but are the most interesting of the stocks that surfaced in my scans. My objective is to save you the work of the initial, tedious culling process, but you need to apply your own analysis to see if these stocks pique your interest as well. There are no guaranteed winners here!
Aviat Networks Inc. (AVNW)
EARNINGS: 8/26/2021 (AMC)
Aviat Networks, Inc. engages in the design, manufacture, and sale of wireless network products and solutions. Its product includes wireless transmission networking systems for microwave and millimeter wave networking applications such as microwave routers, microwave switches, and split mount RF unit. It also offers services such as network planning and design, site surveys and construction, systems integration, installation, maintenance, network monitoring, training, and customer services. The company was founded in 1984 and is headquartered in Austin, TX.
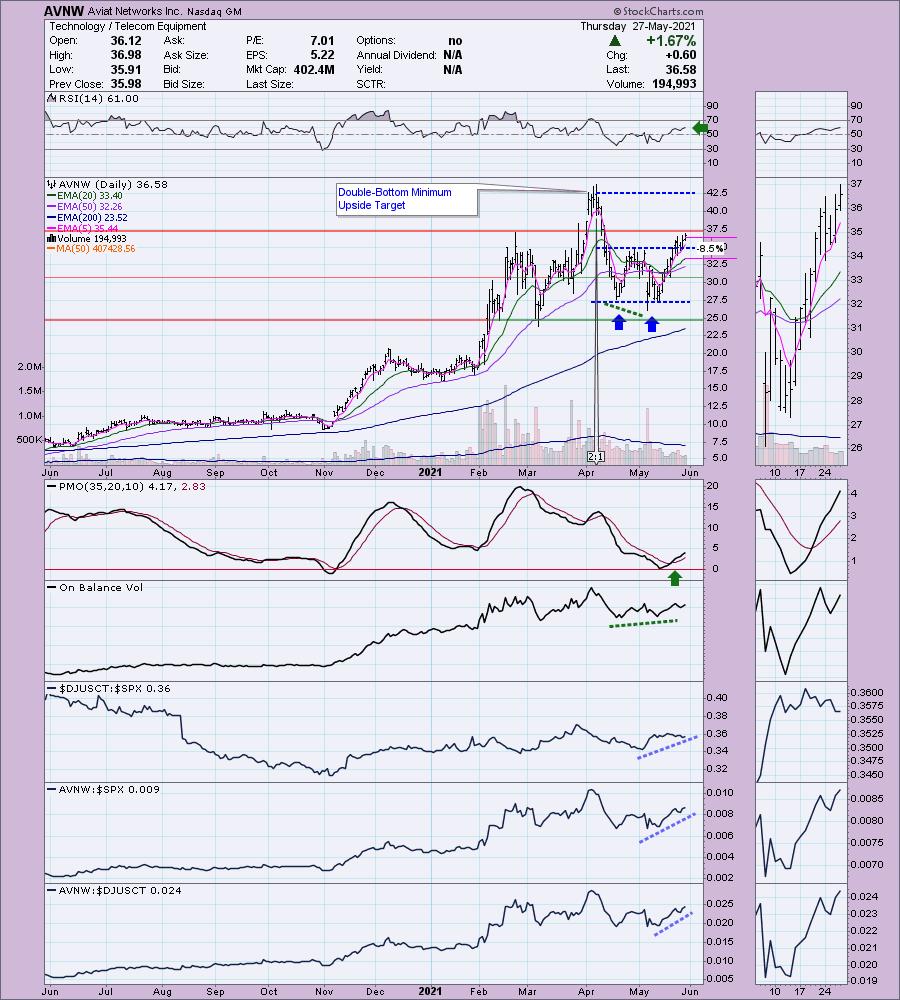
AVNW is up +0.85% in after hours trading. We have an Adam & Even double-bottom that has executed as expected with a breakout above the confirmation line. The minimum upside target of the pattern would take price to overhead resistance at the April high. Currently the RSI is positive and the PMO is on a crossover BUY signal. You'll also notice an OBV positive divergence led into the current rally. The stop is set below the 20-EMA.
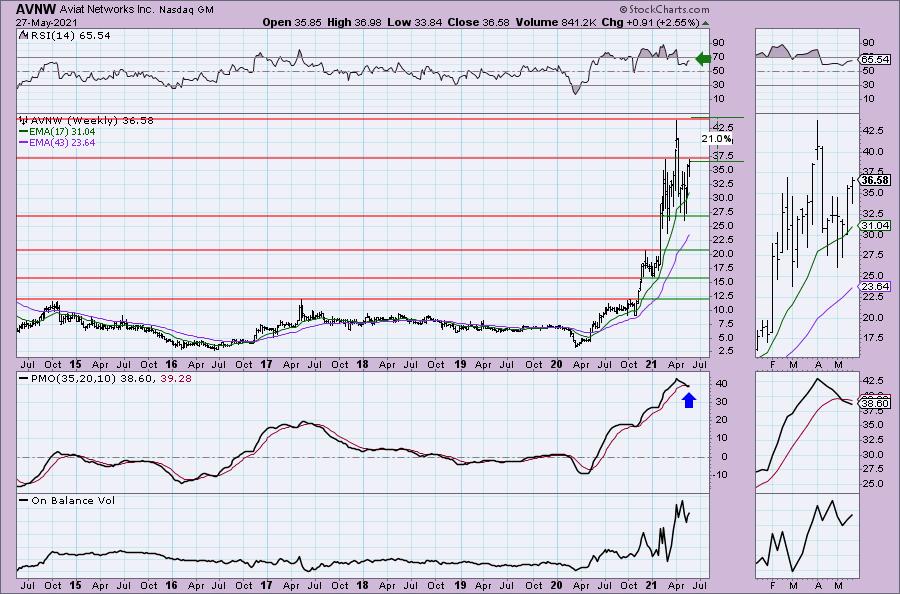
The weekly PMO is decelerating after a crossover SELL signal. The weekly RSI is positive and not overbought. Upside potential is at least 21%.
InMode Ltd. (INMD)
EARNINGS: 8/4/2021 (BMO)
InMode Ltd. designs, develops, manufactures and markets minimally-invasive aesthetic medical products. It also designs, develops, manufactures and markets non-invasive medical aesthetic products that target a array of procedures including permanent hair reduction, facial skin rejuvenation, wrinkle reduction, cellulite treatment, skin appearance and texture and superficial benign vascular and pigmented lesions. The company was founded by Moshe Mizrahy and Michael Kreindel on January 2, 2008 and is headquartered in Yokneam, Israel.
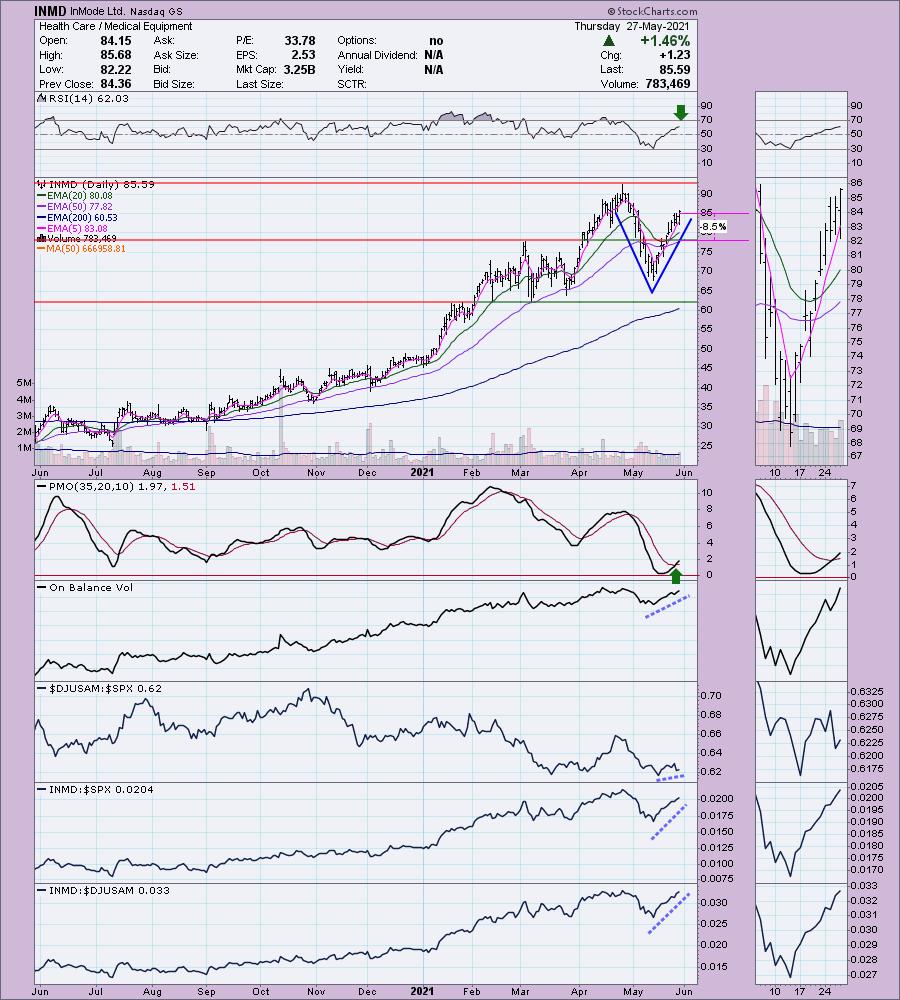
INMD is down -1.26% in after hours trading. After a very steep rising trend, it wouldn't surprise me if we started to see some consolidation or a slowing of the that trend. It is a bullish "V" bottom pattern that does suggest price will breakout above the April top. The RSI is positive and the OBV is confirming the rally. It is performing very well against the SPX and its group. The stop is set at support at the March high.
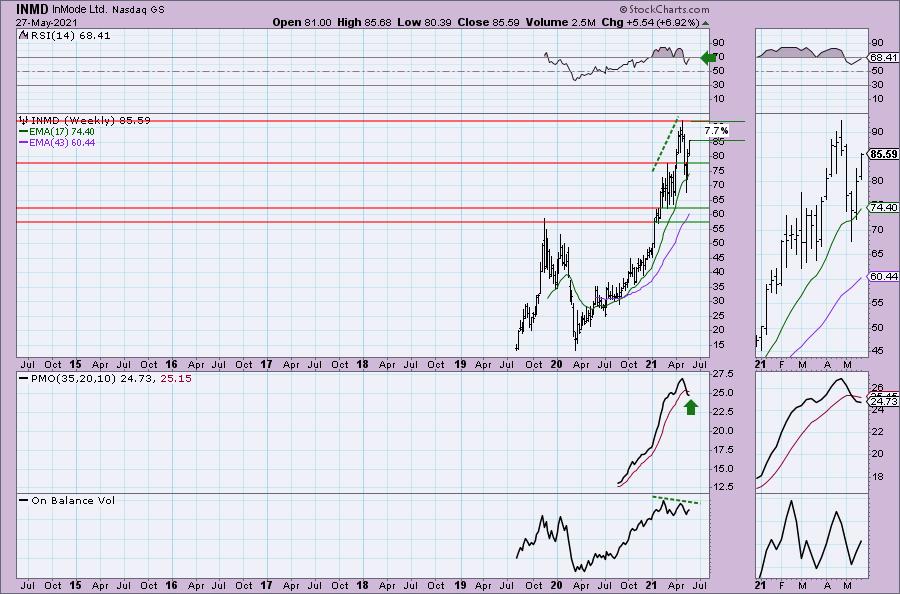
The weekly PMO is turning up after a crossover SELL signal. The weekly RSI is positive, although starting to get overbought again. The biggest problem for this stock is the negative divergence between price tops and weekly OBV tops.
KB Home (KBH)
EARNINGS: 6/24/2021 (AMC)
KB Home engages in selling and building a variety of new homes. It builds various types of homes, including attached and detached single-family homes, townhomes, and condominiums. The firm operates through the following segments: West Coast, Southwest, Central, and Southeast. It offer homes in development communities, at urban in-fill locations and as part of mixed-use projects. The company was founded in 1957 and is headquartered in Los Angeles, CA.
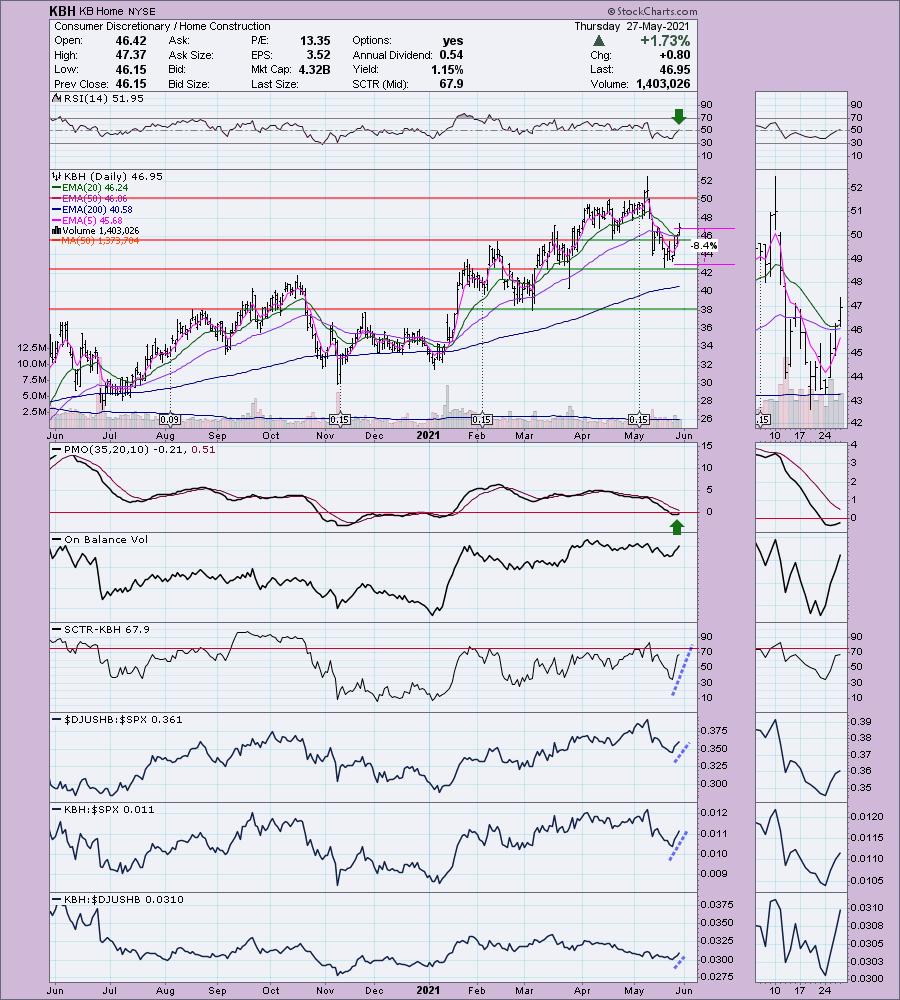
KBH is unchanged in after hours trading. I covered KBH in the November 18th 2020 Diamonds Report. The nearly hit on the January trough, but the close was above it. It is currently up +33.7% since then. Today's breakout above the 20-EMA prevented a negative crossover the 50-EMA. The PMO has bottomed and is moving higher. The RSI has just hit positive territory above net neutral (50). Volume is definitely coming in. The SCTR has shot up and is nearly in the "hot zone" above 75 (meaning it would be in the top quartile of all mid-cap stocks). The group is beginning to outperform again. KBH is beginning to outperform its group. It is also outperforming the SPX. The stop is set just below the closing low this week.
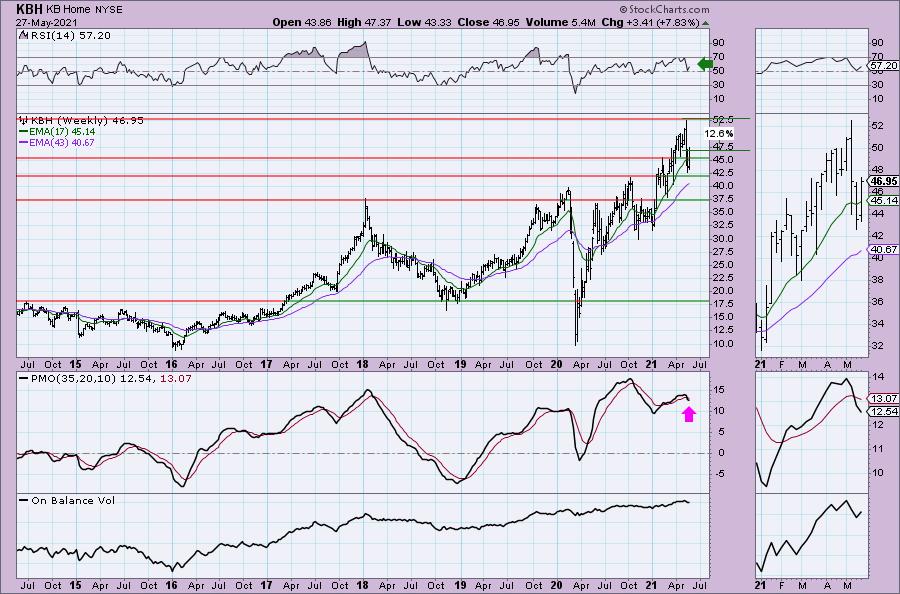
The weekly PMO is beginning to decelerate, but is still pointed decidedly downward. The weekly RSI looks better--it reversed before reaching negative territory. If it reaches its all-time high that would be a 12%+ gain. However, I am expecting a breakout.
MGM Resorts International (MGM)
EARNINGS: 7/29/2021 (AMC)
MGM Resorts International is a holding company, which engages in the ownership and operations of casino resorts. The firm's casino resorts offer gaming, hotel, convention, dining, entertainment, retail, and other resort amenities. It operates through the following business segments: Las Vegas Strip Resorts, Regional Operations and MGM China. The Las Vegas Strip Resorts segment consists of the following casino resorts: Bellagio, MGM Grand Las Vegas, Mandalay Bay, The Mirage, Luxor, New York-New, Excalibur, Park MGM, and Circus Las Vegas. The Regional Operations segment consists of the following casino resorts: MGM Grand Detroit in Detroit, Michigan; Beau Rivage in Biloxi, Mississippi; Gold Strike Tunica in Tunica, Mississippi; Borgata in Atlantic City, New Jersey; MGM National Harbor in Prince George's County, Maryland; and MGM Springfield in Springfield, Massachusetts. The MGM China segment consists of MGM Macau and MGM Cotai. The company was founded by Kerkor Kerkorian on January 29, 1986 and is headquartered in Las Vegas, NV.
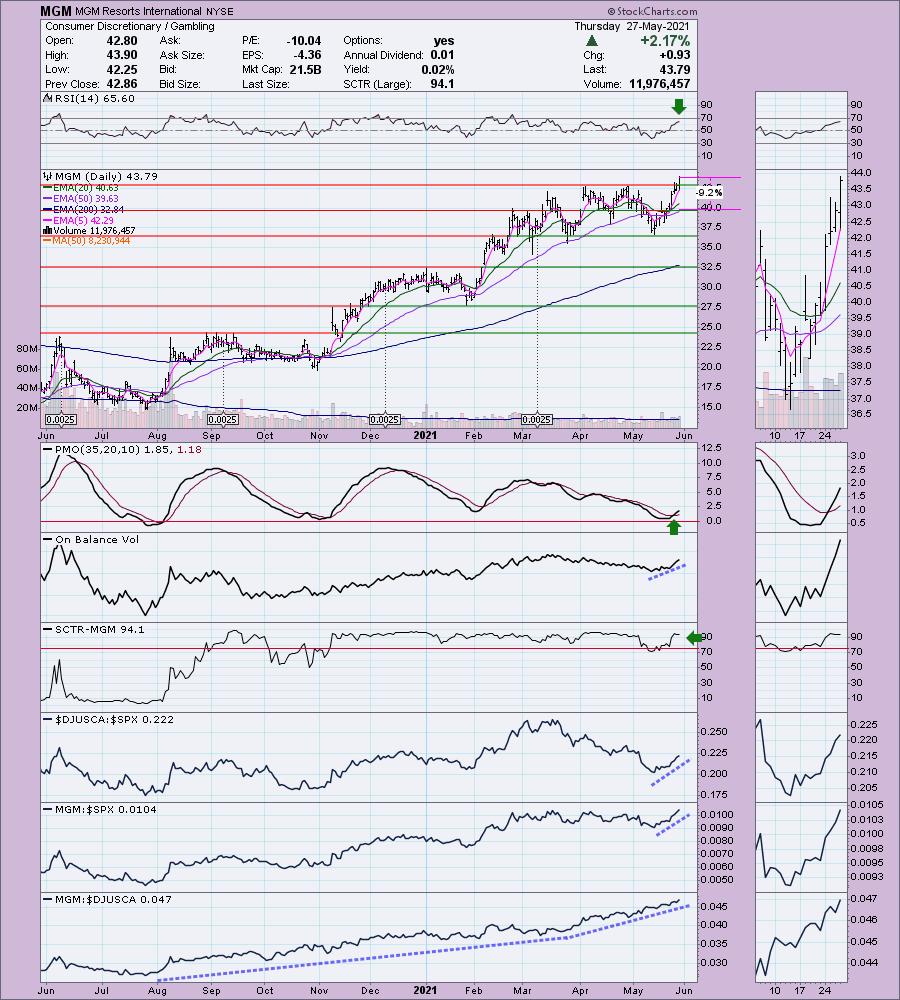
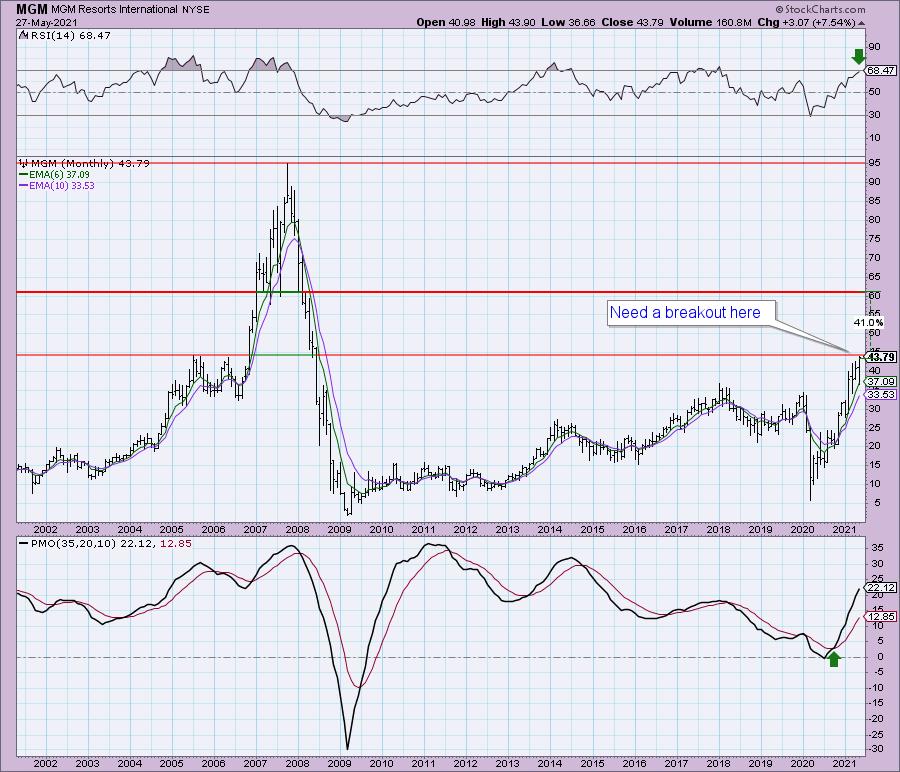
MGM is down -0.11% in after hours trading. I really like today's breakout that is accompanied by a positive and not overbought RSI, and a PMO crossover BUY signal. The OBV is currently confirming the rally. The SCTR is first rate and MGM is clearly one of the stocks you want to own in this industry group given its consistent outperformance within its group. We also see it outperforming the SPX as well. The stop is a bit deep set at the 50-EMA.
The weekly PMO has turned up on this week's stellar performance. The weekly RSI is a bit on the overbought side, but certainly acceptable. The OBV is confirming the rising trend. It's not visible on the weekly chart, so I've included the monthly below the weekly so you can see the upside potential should price break above the current level.
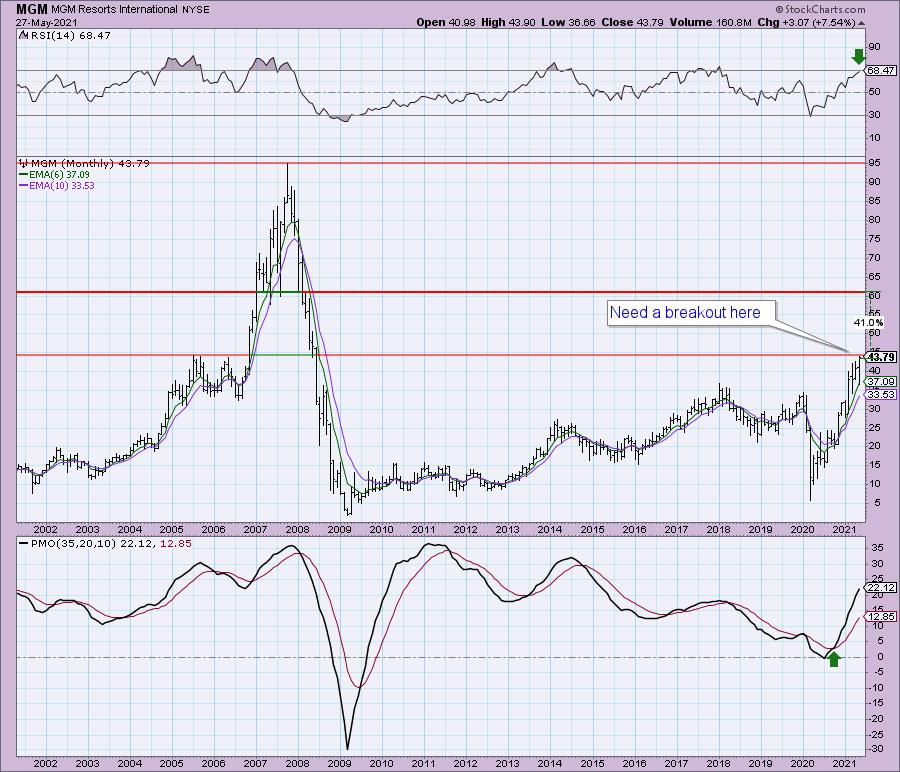
My biggest issue with MGM is that it is hitting strong overhead resistance as I type. Based on the monthly PMO we should get the breakout. However, RSI could be warning us the move is nearing its end given it is getting overbought.
ETFMG Alternative Harvest ETF (MJ)
EARNINGS: N/A
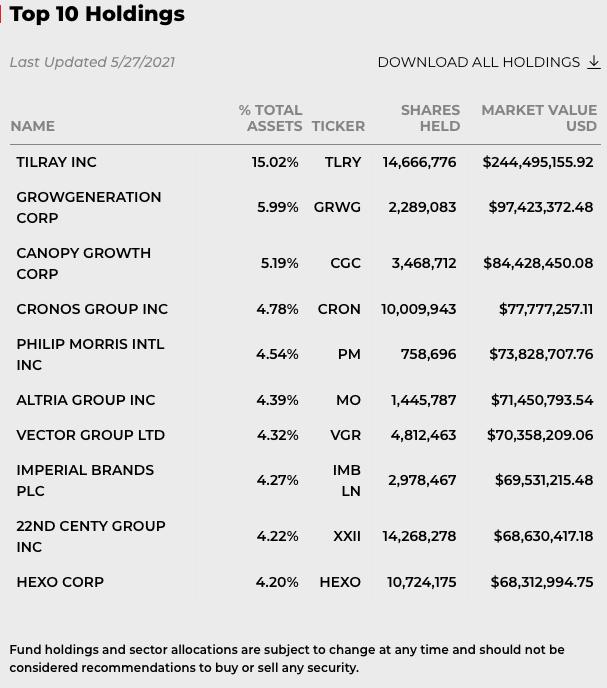
MJ tracks a market-cap-weighted index of global firms engaged in the legal cultivation, production, marketing or distribution of cannabis, cannabinoids or tobacco products.
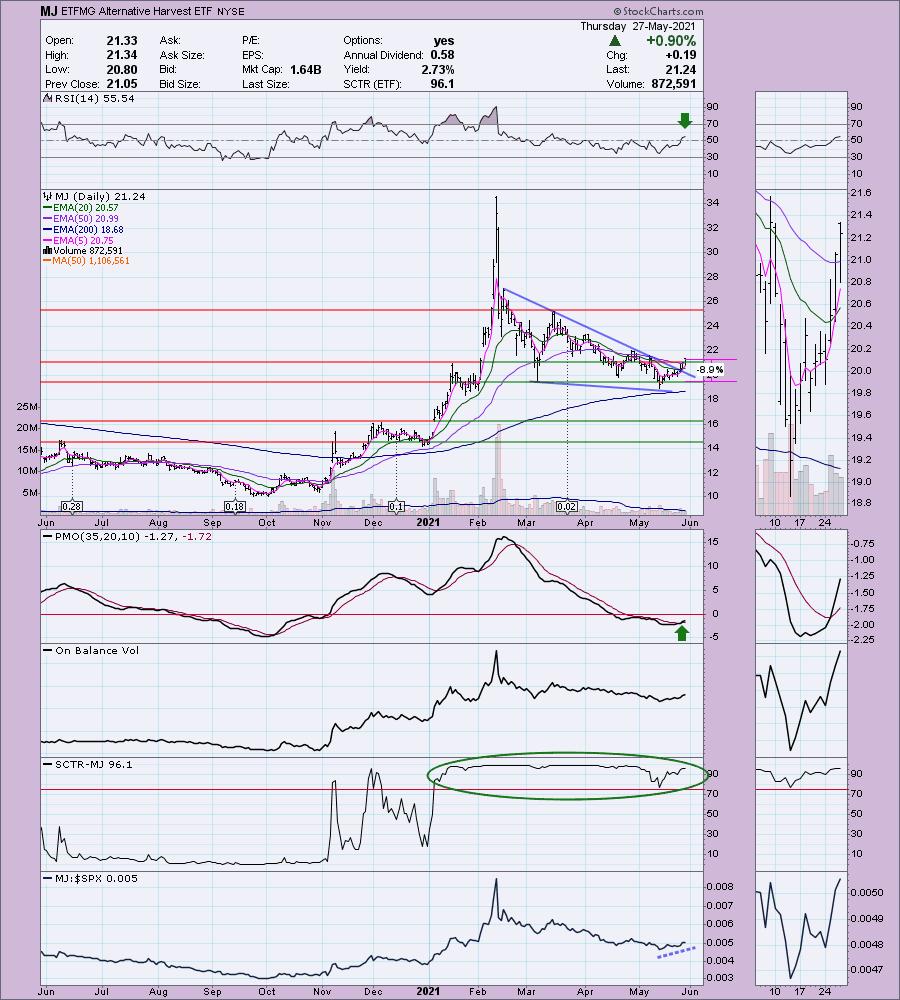
MJ is up +0.05% in after hours trading. If you're a little uncomfortable investing in individual cannabis stocks then here a vehicle you can consider. There is a bullish falling wedge and price has executed it by resolving upward as expected. The RSI just hit positive territory as price followed through on yesterday's close above the 50-EMA. The PMO is on a crossover BUY signal in oversold territory. It is in the top 5% of all ETFs tracked by StockCharts based on the SCTR of 96.1. The OBV is confirming the rally and this fund is beginning to outperform the SPX. The stop is aligned with the March low.
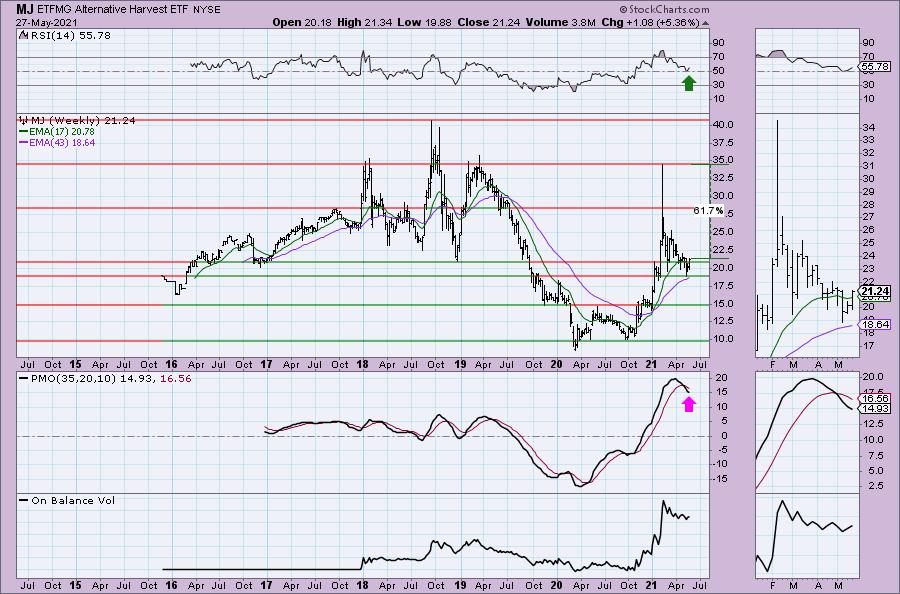
I'm not a fan of the weekly PMO, but after the decline it had, it isn't surprising to see this weekly PMO SELL signal. Upside potential is excellent. Even if you go with the upside target of $27, that's a 30% gain.
Don't forget, on Thursdays...
I look at reader-requested symbols, so shoot me an email at erin@decisionpoint.com. I read every email I receive and try to answer them all!
Current Market Outlook:
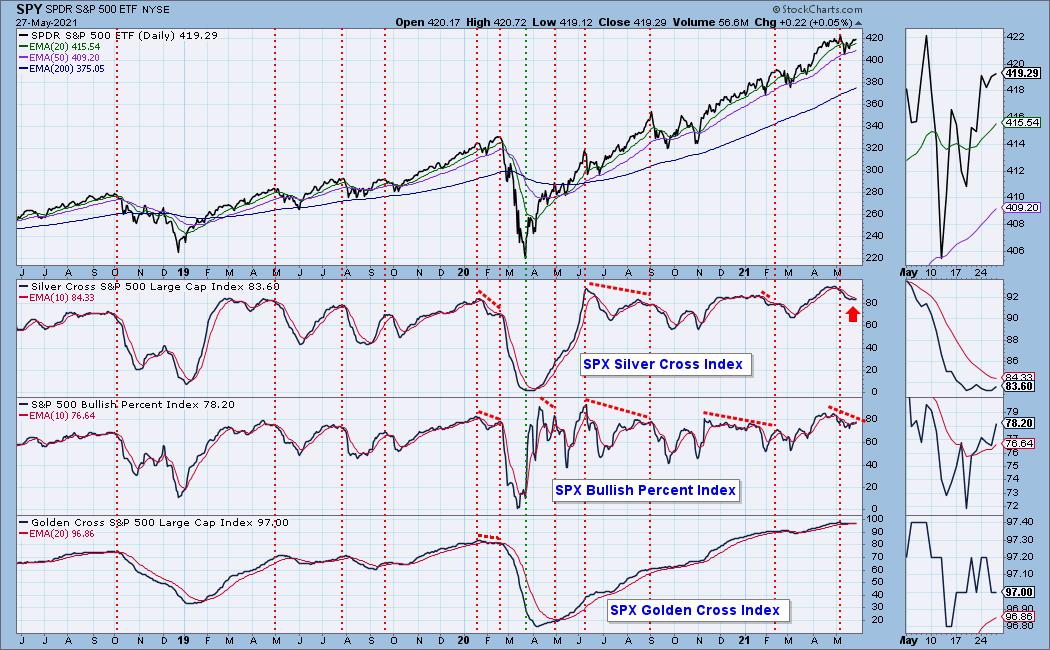
Market Environment: It is important to consider the odds for success by assessing the market tides. The following chart uses different methodologies for objectively showing the depth and trend of participation for intermediate- and long-term time frames.
- The Silver Cross Index (SCI) shows the percentage of SPX stocks on IT Trend Model BUY signals (20-EMA > 50-EMA)
- The Golden Cross Index (GCI) shows the percentage of SPX stocks on LT Trend Model BUY signals (50-EMA > 200-EMA)
- The Bullish Percent Index (BPI) shows the percentage of SPX stocks on Point & Figure BUY signals.
Don't forget that as a "Diamonds" member, you have access to our GCI/SCI curated ChartList on DecisionPoint.com. You'll find it under "Members Only" links on the left side on the Blogs and Links Page.
Here is the current chart:
Diamond Index:
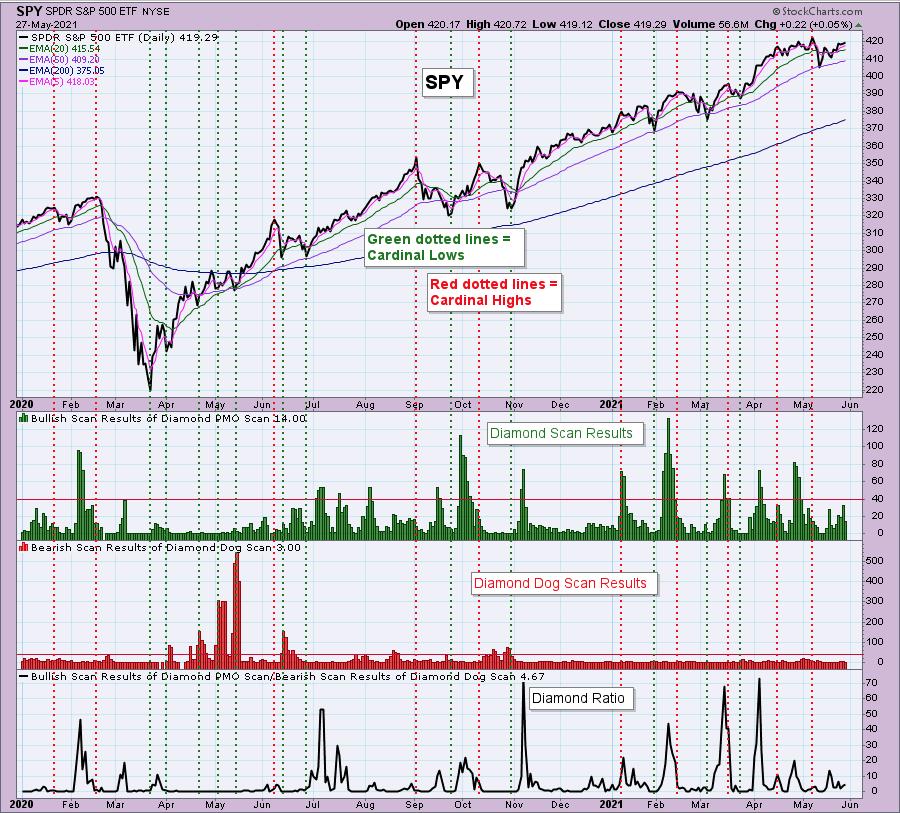
The Diamond Index chart looks at the number of scan results from my bullish Diamond PMO Scan and the number of scan results from the inverse Diamond Dog Scan. The Diamond Ratio divides the bullish results by the bearish results.
I only have data going back to October 2019 so I won't make any sweeping conclusions about the Diamond Index chart. I have marked cardinal tops with red dotted vertical lines and cardinal price bottoms with green dotted vertical lines. I believe that when the Diamond Dog results spike, it usually comes at a price bottom, or marks a strong continuation of the rising trend.
Unfortunately, the Diamond PMO Scan result numbers aren't providing much insight. The Diamond Ratio has promise, but again I don't see a clear correlation to the market tops/bottoms right now. I need to study and manipulate the data some more. Keep you posted!
Full Disclosure: I'm about 65% invested and 35% is in 'cash', meaning in money markets and readily available to trade with.
Technical Analysis is a windsock, not a crystal ball.
Happy Charting!
- Erin
erin@decisionpoint.com
Watch the latest episode of DecisionPoint with Carl & Erin Swenlin on Mondays 7:00p EST or on the DecisionPoint playlist on the StockCharts TV YouTube channel here!
NOTE: The stocks reported herein are from mechanical trading model scans that are based upon moving average relationships, momentum and volume. DecisionPoint analysis is then applied to get five selections from the scans. The selections given should prompt readers to do a chart review using their own analysis process. This letter is not a call for a specific action to buy, sell or short any of the stocks provided. There are NO sure things or guaranteed returns on the daily selection of "diamonds in the rough."
Helpful DecisionPoint Links:
DecisionPoint Shared ChartList and DecisionPoint Chart Gallery
Price Momentum Oscillator (PMO)
Swenlin Trading Oscillators (STO-B and STO-V)
For more links, go to DecisionPoint.com
