
Given the lack of reader requests for tomorrow and the Diamond PMO scan returned zero results (even the Diamond Dog scan produced just one), it is clear that the selection is limited as far as trades go. The market is at a crossroads so tread lightly.
I will always have some "Diamonds in the Rough" to add for Reader Request Day tomorrow, but I like it best when I have plenty of symbols from you. It gives me an idea of what types of stocks you are bullish about and gives me insight on areas of the market that I may've missed.
Today, I'm returning to the Home Builders industry group. I had two come up in my PMO Crossover scan results that you'll recognize: DR Horton (DHI) and LGI Homes (LGIH). Last time we hit it big on the Home Builders group. I'm not as bullish on them as I was then, mainly because of the internal weakness in the market, but the charts do look favorable.
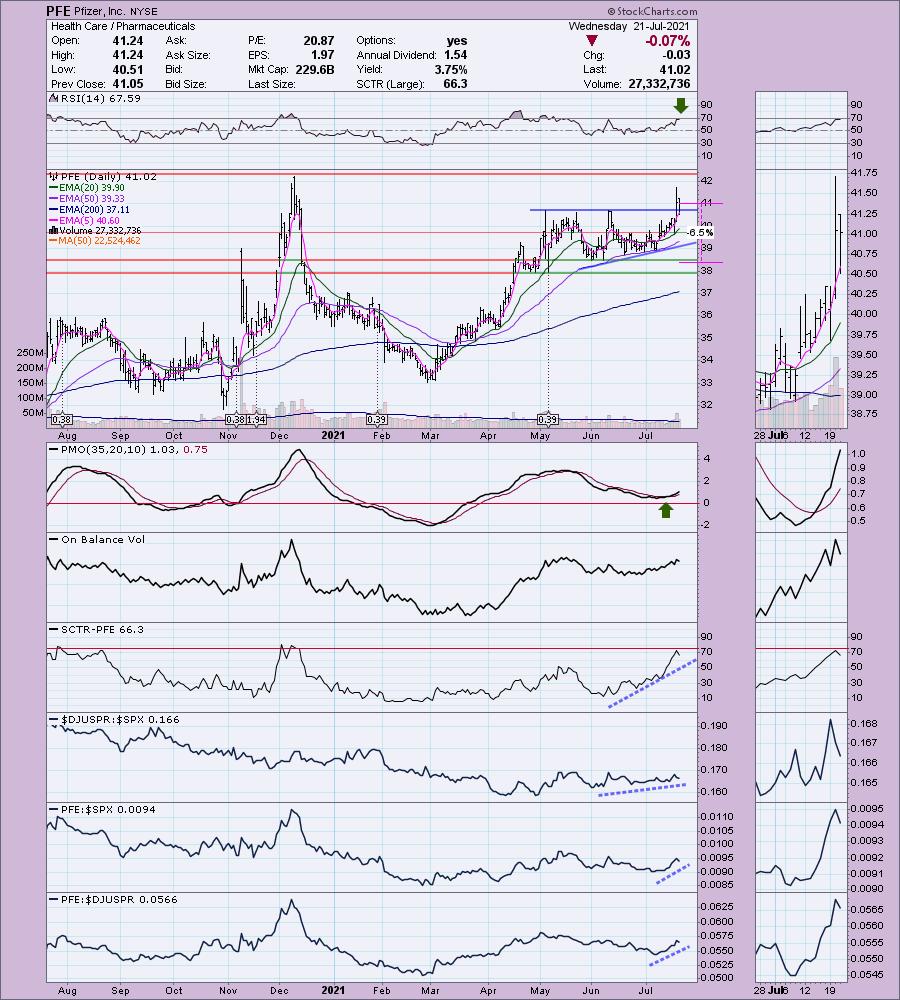
I'm also including Pfizer (PFE) which has a very bullish daily and weekly chart. It hit my scans yesterday which is why it was on my short list of 'Stocks to Review' yesterday. It deserves the spotlight today.
Announcement: Very shortly I'll be recording my webinar "Under the Hood" Indicators at the Synergy Traders event at 7:00p ET. Even though you are reading this likely after the event, you can still register to get the recording from them. Here is the link.
Today's "Diamonds in the Rough" are: DHI, LGIH and PFE.
Stocks to Review ** (no order): ATKR, CWEN, RCII and HD.
** The "Stocks to Review" are stocks that were on my short list for the day.
 Diamond Mine Information:
RECORDING LINK "Bonus" Diamond Mine Wednesday (7/14):
Topic: Make-up DecisionPoint Diamond Mine (7/14/2021) LIVE Trading Room
Start Time : Jul 14, 2021 08:59 AM
Meeting Recording LINK for 7/14 is HERE.
Access Passcode: July-14th
RECORDING LINK FRIDAY (7/16) Diamond Mine:
Topic: DecisionPoint Diamond Mine (7/16/2021) LIVE Trading Room
Start Time : Jul 16, 2021 09:02 AM
Meeting Recording Link for 7/16 is HERE.
Access Passcode: July-16th
REGISTER NOW for Friday 7/23 Diamond Mine:
When: Jul 23, 2021 09:00 AM Pacific Time (US and Canada)
Topic: DecisionPoint Diamond Mine (07/23/2021) LIVE Trading Room
Register in advance for this webinar HERE.
Save the registration confirmation email with login instructions in case Zoom doesn't notify you in time.
Free DP Trading Room (7/19) RECORDING LINK:
Topic: DecisionPoint Trading Room
Start Time : Jul 19, 2021 08:57 AM
Meeting Recording for DP Trading Room (7/19) Link is HERE.
Access Passcode: July/19th
Guest: Leslie Jouflas, CMT - Free DP Trading Room (7/12) RECORDING LINK:
Topic: DecisionPoint Trading Room
Start Time : Jul 12, 2021 09:00 AM
Meeting Recording for DP Trading Room is HERE.
Access Passcode: W72^WzSb
For best results, copy and paste the access code to avoid typos.
Welcome to DecisionPoint Daily Diamonds, wherein I highlight five "Diamonds in the Rough." These are selected from the results of my DecisionPoint scans, which search for stocks that could benefit from the trend and condition of the market. Remember, these are not recommendations to buy or sell, but are the most interesting of the stocks that surfaced in my scans. My objective is to save you the work of the initial, tedious culling process, but you need to apply your own analysis to see if these stocks pique your interest as well. There are no guaranteed winners here!
DR Horton Inc. (DHI)
EARNINGS: 7/22/2021 (BMO) *** REPORTS TOMORROW **
D.R. Horton, Inc. engages in the construction and sale of single-family housing. It operates through the following segments: Homebuilding and Financial Services. The Homebuilding segment includes the sub-segments East, Midwest, Southeast, South Central, Southwest and West regions. The Financial Services segment provides mortgage financing and title agency services to homebuyers in many of its homebuilding markets. The company was founded by Donald Ray Horton in 1978 and is headquartered in Arlington, TX.
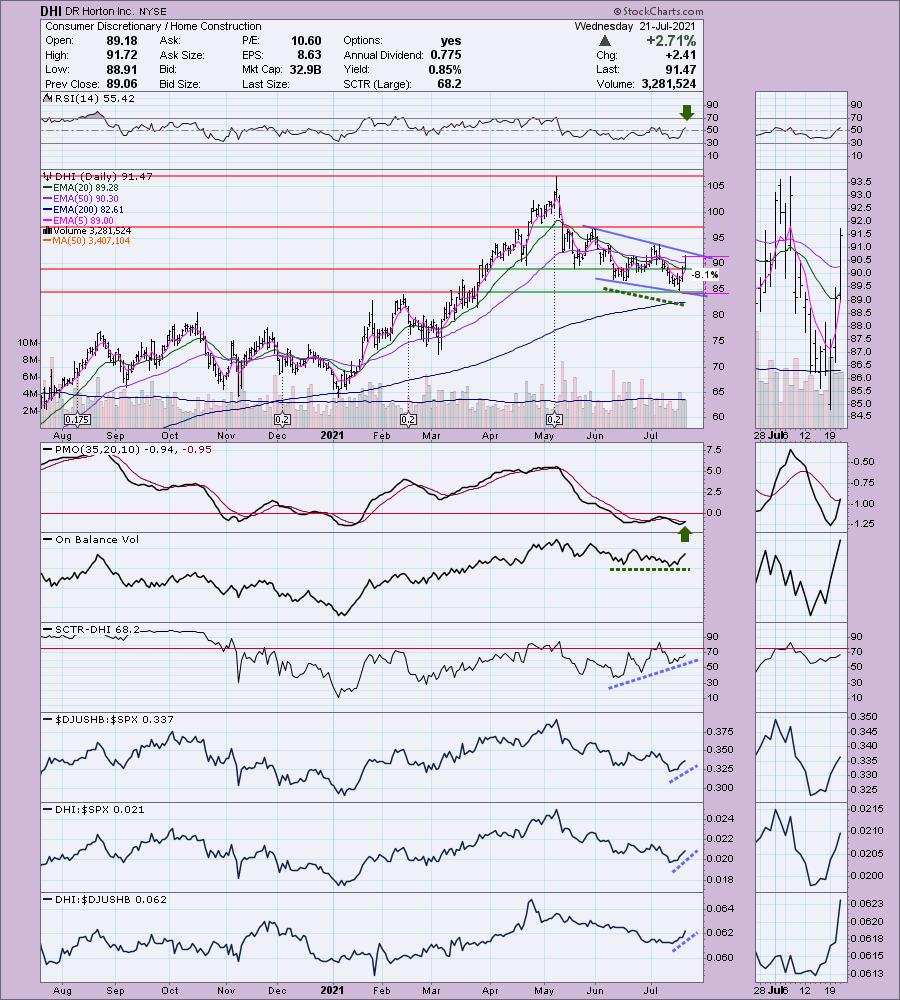
DHI is up +0.19% in after hours trading. It does report earnings tomorrow, so you'll definitely want to watch how investors handle it before entering. I covered DHI in the January 19th 2021 DP Diamonds Report. Even with the correction from the May top, the original position would still be open and sitting on a +28.3% gain right now. Home Builders were definitely a big winner for Diamonds back in January. As the fine print always says, "Past performance is no guarantee of future results", but I do have to say it is poised to breakout again. The RSI is now in positive territory and not overbought. Price is in a bullish falling wedge, although it hasn't executed the pattern with a breakout yet. The PMO is on a new crossover BUY signal and the OBV while not in a perfect positive divergence, it is showing flat lows in comparison to declining lows on price. Relative performance is very good. The SCTR is trending toward the "hot zone" above 75. The stop level is deeper than I like it given the market is shaky right now, but you could also tighten it up to about 4% and be just below the April/May lows.
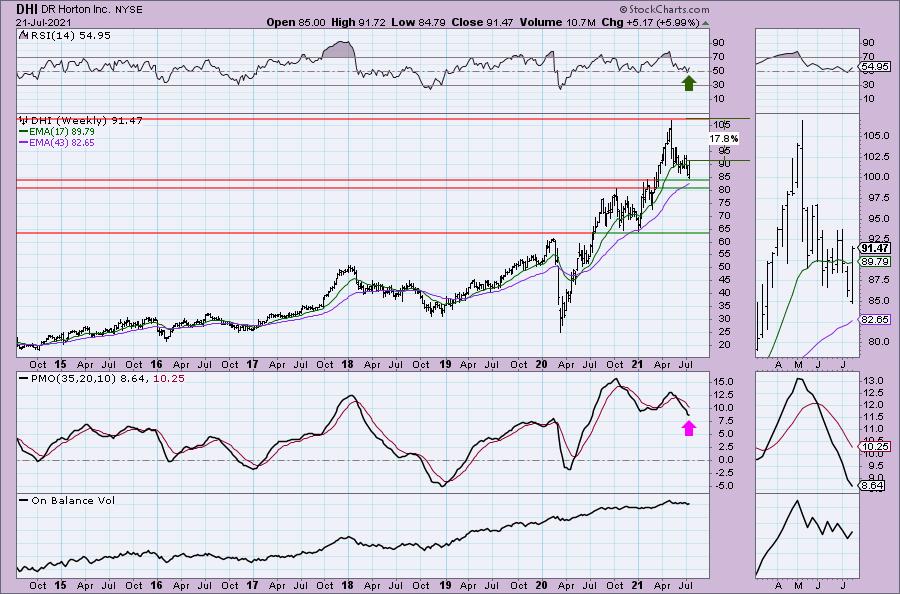
We have a flag-like price pattern, but I'm mostly interested in the way it is holding support above the 2020 high and the 43-week EMA. The weekly RSI is positive. The PMO doesn't look good, but it does appear it is at least considering a deceleration.
LGI Homes, Inc. (LGIH)
EARNINGS: 8/3/2021 (BMO)
LGI Homes, Inc. engages in the design, construction, marketing, and sale of new homes. It focuses on residential land development business. It operates through the following segments: Central, West, Southeast, Florida, and Northwest. The company was founded by Eric Thomas Lipar in 2003 and is headquartered in The Woodlands, TX.
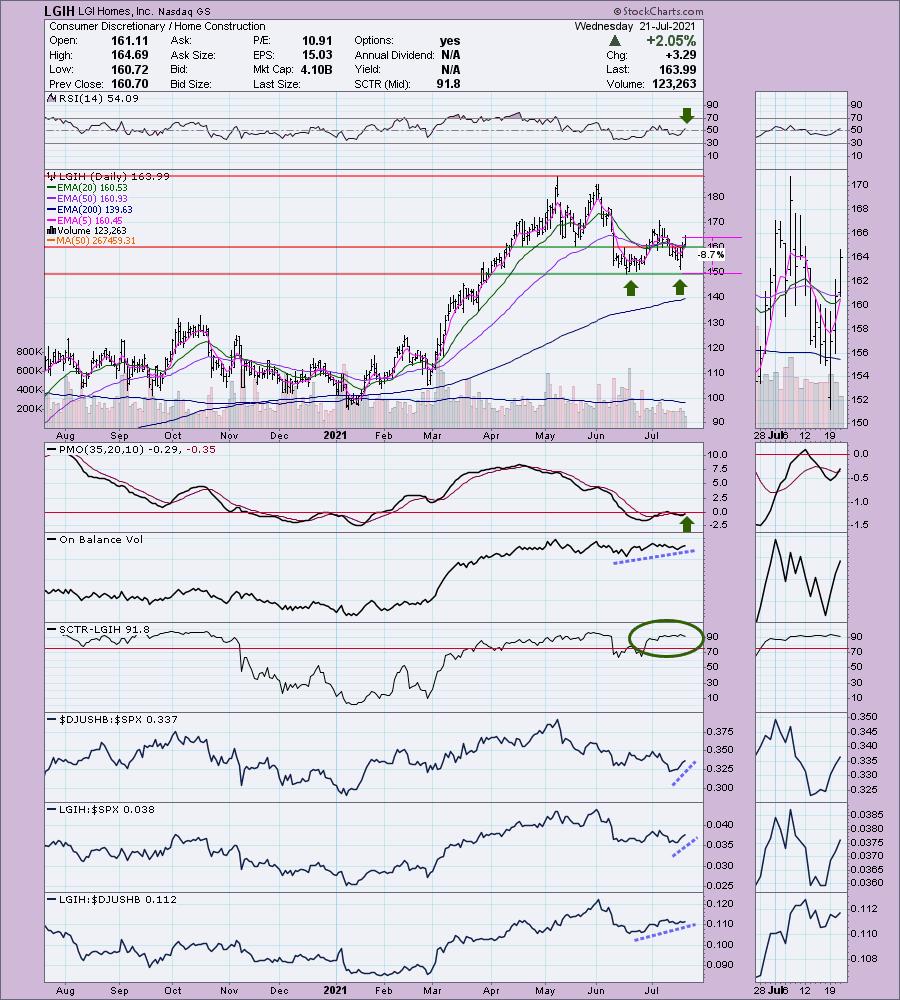
LGIH is unchanged in after hours trading. I covered LGIH a few days after DHI on January 21st 2021. The stop was never triggered and despite the correction in June, the position is currently up +50%. I like the chart again today. The RSI just hit positive territory and price has formed a bullish double-bottom. Should price breakout above the confirmation line at $170, the minimum upside target of the pattern would take price to $190. The PMO has whipsawed into a crossover BUY signal and I note that the 5-EMA is about to cross above the 20-EMA for a ST Trend Model BUY signal. The SCTR is healthy and you can see the industry group is outperforming. DHI is outperforming the industry group and the SPX. The SCTR has been sitting in the "hot zone" for the past month. The stop is also deeper than I'd like given market weakness, but it is the logical place to put it.
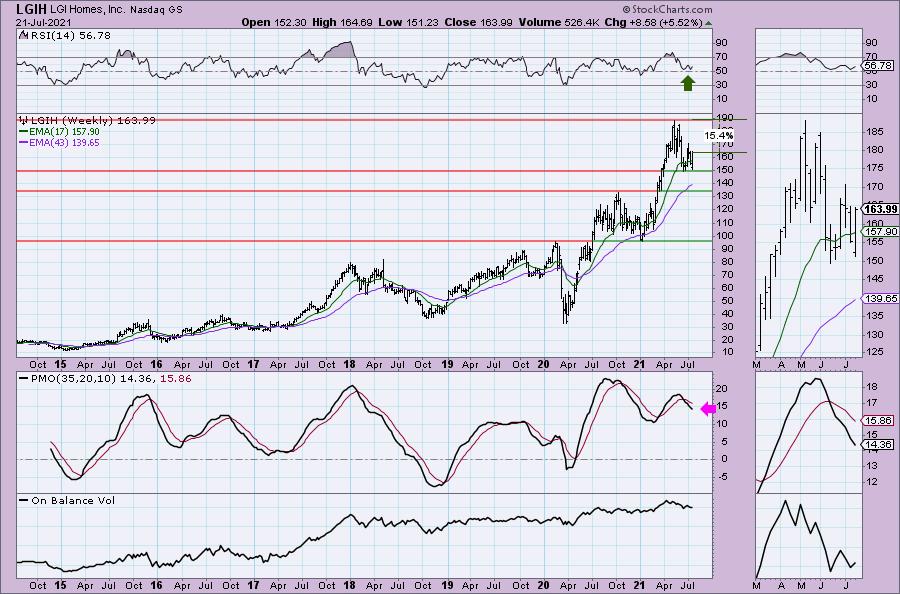
Like DHI, the weekly chart isn't particularly great, but it also has a flag-like look and is holding support at $150. The weekly RSI is positive and not overbought. The weekly PMO has some work to do.
Pfizer, Inc. (PFE)
EARNINGS: 7/28/2021 (BMO)
Pfizer Inc. engages in the discovery, development, and manufacture of healthcare products specializes in medicines, vaccine, and consumer healthcare. It operates through the Pfizer Innovative Health (IH) and Pfizer Essential Health (EH) segments. The IH segment focuses on the development and commercializing medicines and vaccines for internal medicine, oncology, inflammation and immunology, rate disease, and consumer healthcare. The EH segment is involved in development and supply of branded generics, generic sterile injectable products, biosimilars, and select branded products including anti-infectives. The company was founded by Charles Pfizer Sr. and Charles Erhart in 1849 and is headquartered in New York, NY.
PFE is up +0.22% in after hours trading. I covered PFE on January 12th 2021 and March 3rd 2021. The 5.5% stop was hit on the February decline. However, the March 3rd position was nearly perfect timing so it is up a whopping +105.5% since then. Sure wish I'd put this one in my portfolio back then. Price is breaking out of a bullish ascending triangle. The RSI is positive although getting overbought. The PMO looks great after an earlier crossover BUY signal this month. The OBV is confirming the rally. The SCTR is getting healthier even though it isn't in the "hot zone" yet. The group is performing alright, but PFE is outperforming it and the SPX. The stop is a comfortable 6.5%.
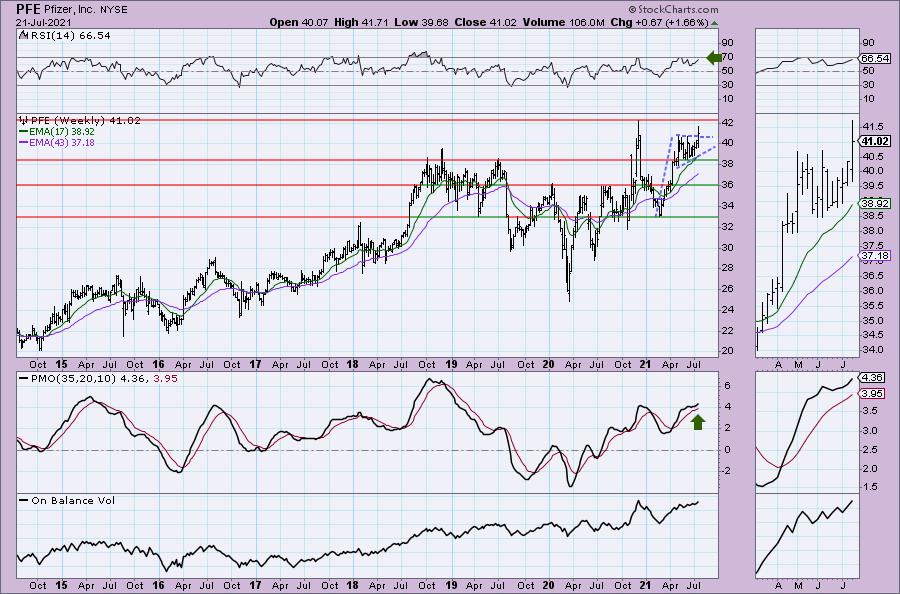
The weekly chart looks fantastic with a positive weekly RSI and weekly PMO that has bottomed above the signal line and is not overbought. This week's breakout is executing a bullish flag formation. Overhead resistance is nearing at the all-time high, but given the positivity of both the daily and weekly charts, I'm looking for a breakout to new all-time highs and then some.
Join me at Synergy Trader's educational event featuring top analysts sharing their "Favorite Indicators". I'll be doing my presentation on:
"Under the Hood" Indicators
If you haven't registered for my free webinar tomorrow at 7:00p ET, it is time to do so! I will discussing my "favorite indicators" and giving you more tips on properly timing your entries and exits. As always your support is greatly appreciated! Recordings will be sent by them, so they only go to those who register. So register HERE asap!
Don't forget, on Thursdays I look at reader-requested symbols, so shoot me an email at erin@decisionpoint.com. I read every email I receive and try to answer them all!
Current Market Outlook:
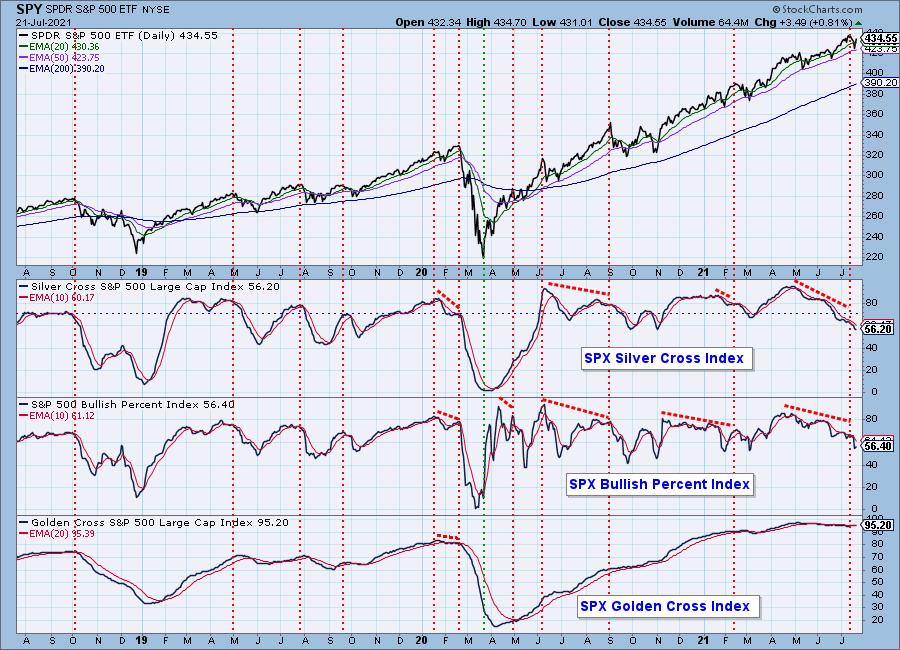
Market Environment: It is important to consider the odds for success by assessing the market tides. The following chart uses different methodologies for objectively showing the depth and trend of participation for intermediate- and long-term time frames.
- The Silver Cross Index (SCI) shows the percentage of SPX stocks on IT Trend Model BUY signals (20-EMA > 50-EMA)
- The Golden Cross Index (GCI) shows the percentage of SPX stocks on LT Trend Model BUY signals (50-EMA > 200-EMA)
- The Bullish Percent Index (BPI) shows the percentage of SPX stocks on Point & Figure BUY signals.
Don't forget that as a "Diamonds" member, you have access to our GCI/SCI curated ChartList on DecisionPoint.com. You'll find it under "Members Only" links on the left side on the Blogs and Links Page.
Here is the current chart:
Full Disclosure: I'm about 30% invested and 70% is in 'cash', meaning in money markets and readily available to trade with.
Technical Analysis is a windsock, not a crystal ball.
Happy Charting!
- Erin
erin@decisionpoint.com
Watch the latest episode of DecisionPoint with Carl & Erin Swenlin on Mondays 7:00p EST or on the DecisionPoint playlist on the StockCharts TV YouTube channel here!
NOTE: The stocks reported herein are from mechanical trading model scans that are based upon moving average relationships, momentum and volume. DecisionPoint analysis is then applied to get five selections from the scans. The selections given should prompt readers to do a chart review using their own analysis process. This letter is not a call for a specific action to buy, sell or short any of the stocks provided. There are NO sure things or guaranteed returns on the daily selection of "Diamonds in the Rough."
Helpful DecisionPoint Links:
DecisionPoint Shared ChartList and DecisionPoint Chart Gallery
Price Momentum Oscillator (PMO)
Swenlin Trading Oscillators (STO-B and STO-V)
For more links, go to DecisionPoint.com