
Thursday is Reader Request Day. I had two requests come in for the QQQ so I'll be taking an in depth look at that sector using our "under the hood" indicators. The other three requests have bullish charts. You'll recognize some of these names.
I'm not feeling well today, so I'll keep it brief.
Don't forget to sign up for tomorrow's live Diamond Mine trading room. The link is below and right here!
Today's "Diamonds in the Rough": QQQ, TCEHY, TRV and UPWK.

RECORDING LINK Friday (10/1):
Topic: DecisionPoint Diamond Mine (10/1/2021) LIVE Trading Room
Start Time : Oct 1, 2021 09:00 AM
Meeting Recording Link HERE.
Access Passcode: October/1st
REGISTRATION FOR FRIDAY 10/8 Diamond Mine:
When: Oct 8, 2021 09:00 AM Pacific Time (US and Canada)
Topic: DecisionPoint Diamond Mine (10/8/2021) LIVE Trading Room
Register in advance for this webinar HERE.
Save the registration confirmation email with login instructions in case Zoom doesn't notify you in time.

Topic: DecisionPoint Trading Room
Start Time : Oct 4, 2021 09:00 AM
Meeting Recording LINK.
Access Passcode: October%4th
For best results, copy and paste the access code to avoid typos.
Welcome to DecisionPoint Daily Diamonds, wherein I highlight five "Diamonds in the Rough." These are selected from the results of my DecisionPoint scans, which search for stocks that could benefit from the trend and condition of the market. Remember, these are not recommendations to buy or sell, but are the most interesting of the stocks that surfaced in my scans. My objective is to save you the work of the initial, tedious culling process, but you need to apply your own analysis to see if these stocks pique your interest as well. There are no guaranteed winners here!
Invesco QQQ Trust (QQQ)
EARNINGS: N/A
QQQ tracks a modified-market-cap-weighted index of 100 NASDAQ-listed stocks.
Predefined Scans Triggered: Parabolic SAR Buy Signals and Entered Ichimoku Cloud.
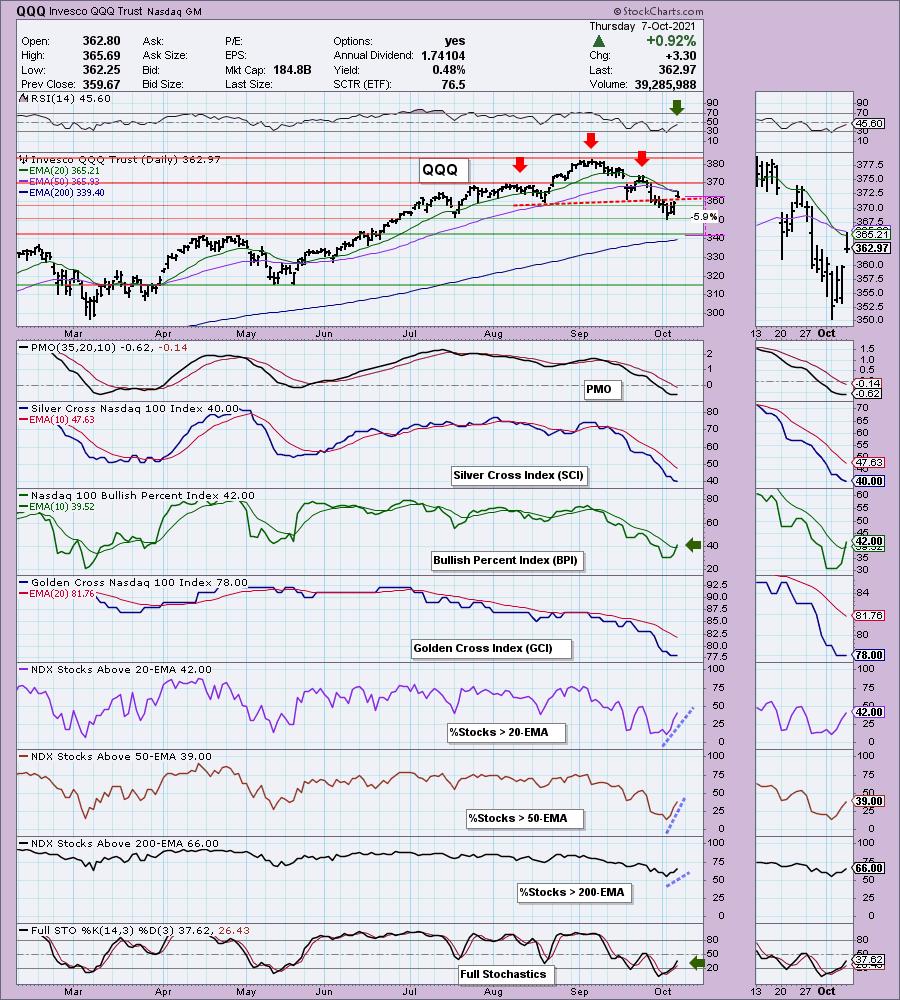
QQQ is up +0.08% in after hours trading. Two subscribers wrote in about shorting the QQQ due to the large head and shoulders patterns. I was also asked how good these patterns are at fulfilling. I believe we did indeed have a bearish head and shoulders pattern. But I also believe that it was fulfilled on the breakdown and successful test of the July low. Now it is head back up. I'm not happy with price closing so far beneath its high, but it did hit overhead resistance at the 20/50-EMAs. I'm bullish on the QQQ though.
Looking at the indicators, we can see that the RSI is nearing positive territory, the BPI just had a positive crossover and we now have participation percentages above the 20/50-EMAs reading higher than the SCI. This means the SCI has an opportunity to turn up and that we have a bullish bias. The PMO and Stochastics are turning up. I wouldn't be shorting right now. This looks like it could be a solid short-term bottom.
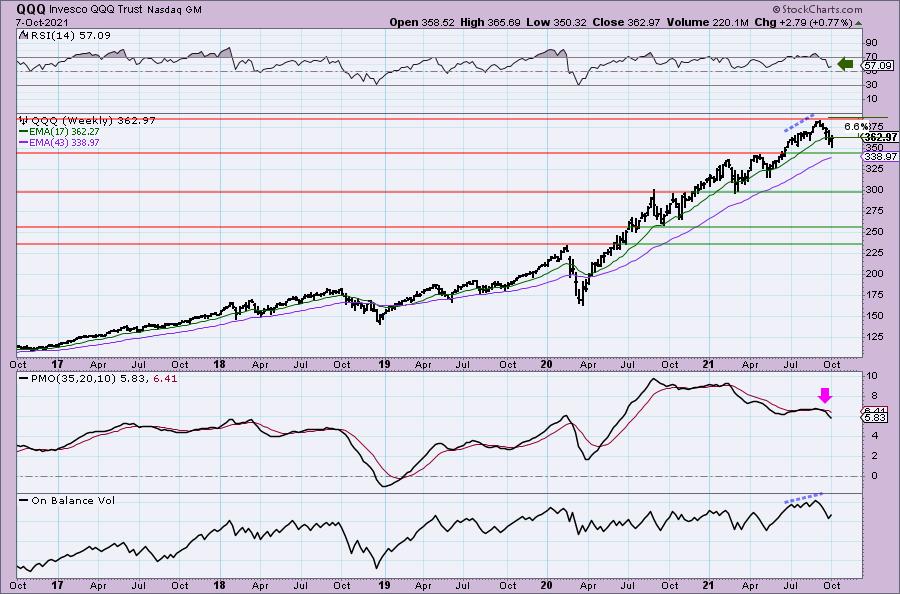
The weekly chart shows a positive RSI. We don't normally compare rising tops on indicators, I'm only pointing out there because OBV tops are rising, there is no negative divergence. The weekly PMO is ugly and I really don't see it shifting gears yet. It's reached near-term oversold territory, so a switch in direction might not be far off if this short-term bottom holds into the intermediate term with new all-time highs.
Tencent Holdings Ltd. (TCEHY)
EARNINGS: 11/17/2021 (BMO)
Tencent Holdings Ltd. is an investment holding company. It operates through the following segments: Value-Added Services, FinTech and Business Services, Online Advertising, and Others. The Value-added Services segment involves online and mobile games, community value-added services, and applications across various Internet and mobile platforms. The FinTech and Business Services segment provides fintech and cloud services, which include commissions from payment, wealth management and other services. The Online Advertising segment represents display based and performance based advertisements. The Other segment consists of trademark licensing, software development services, software sales, and other services. The company was founded by Yi Dan Chen, Hua Teng Ma, Chen Ye Xu, Li Qing Zeng, and Zhi Dong Zhang on November 11, 1998 and is headquartered in Shenzhen, China.
Predefined Scans Triggered: Elder Bar Turned Green, New CCI Buy Signals, Bullish MACD Crossovers, Moved Above Upper Bollinger Band, Parabolic SAR Buy Signals, Entered Ichimoku Cloud and P&F Double Top Breakout.
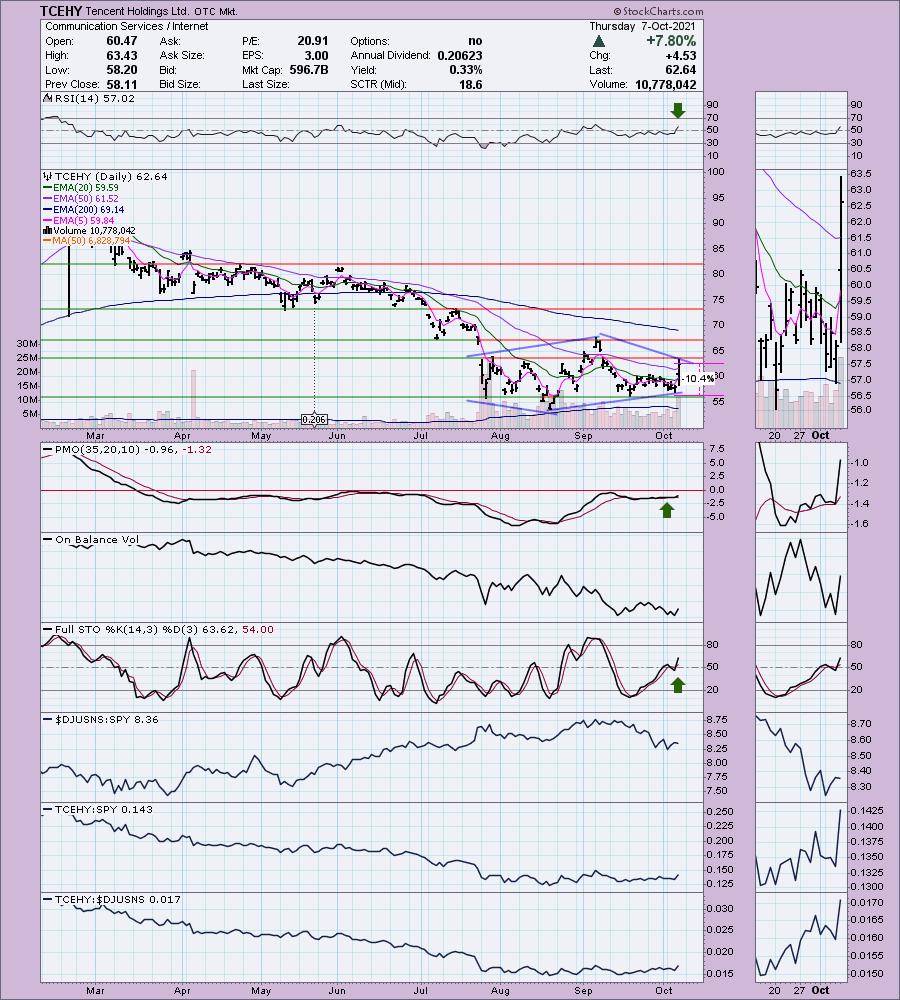
TCEHY is unchanged in after hours trading. I've covered Tencent three times before. Here is the link to the last time, April 1st 2021. You'll find the links to the two prior times in that report. Given the steady breakdown, I'm sure all of those positions were eventually stopped out, but they were highly profitable at one point.
I will tell you these charts a bullish, but I am not a proponent of investing in China-related stocks. Their financial practices have always been somewhat suspect and now with the disruption of the Chinese financial system by the President Xi, I would enter into these stocks with eyes wide open.
Price is forming a diamond reversal pattern. These are pretty rare and we don't actually have a top, I drew the trendline to the current top. I can't speak of upside targets with this pattern, it just suggests an intermediate-term bottom may be coming in. The RSI is positive and rising and the PMO has bottomed above its signal line which is especially bullish. This is a solid area of support for price to bounce from. Stochastics are positive and rising. Today a new ST Trend Model "bronze cross" Buy signal as the 5-EMA crossed above the 20-EMA. Relative strength of the group is suspect. TCEHY has been performing about as well as the SPY and it does appear to be showing an increase of relative strength. The stop has to be fairly deep given today's giant rally.
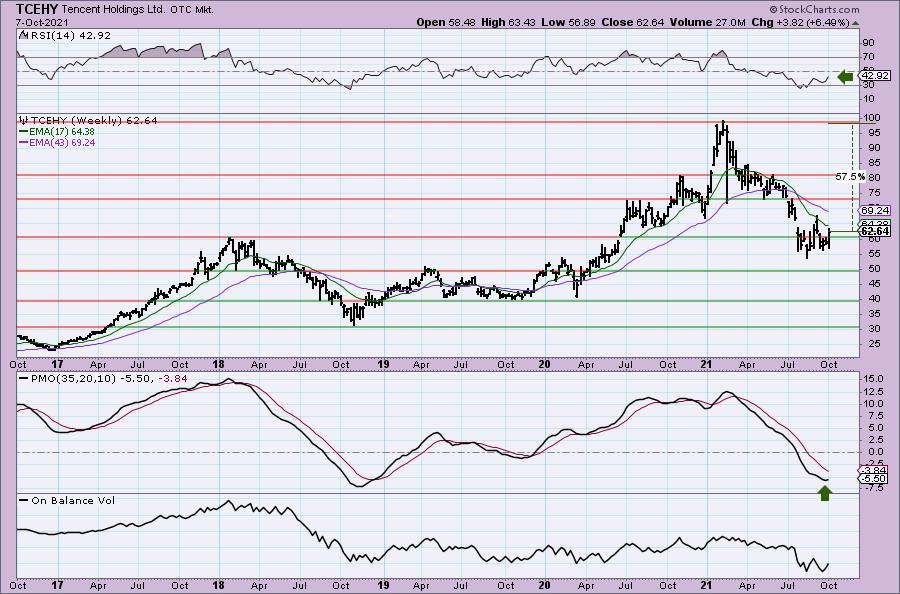
The weekly RSI is negative, but it is rising out of oversold territory. The PMO has bottomed which could also signify an intermediate-term bottom.
The Travelers Cos., Inc. (TRV)
EARNINGS: 10/19/2021 (BMO)
The Travelers Cos., Inc. is a holding company, which engages in the provision of commercial and personal property and casualty insurance products and services. It operates through the following business segments: Business Insurance, Bond and Specialty Insurance, and Personal Insurance. The Business Insurance segment offers a broad array of property and casualty insurance, and insurance related services to its customers. The Bond and Specialty Insurance segment includes surety, fidelity, management liability, professional liability, and other property and casualty coverage and related risk management services. The Personal Insurance segment consists of products of automobile and homeowners insurance are complemented by a broad suite of related coverages. The company was founded in 1853 and is headquartered in New York, NY.
Predefined Scans Triggered: Bullish MACD Crossovers, Moved Above Ichimoku Cloud and Parabolic SAR Buy Signals.
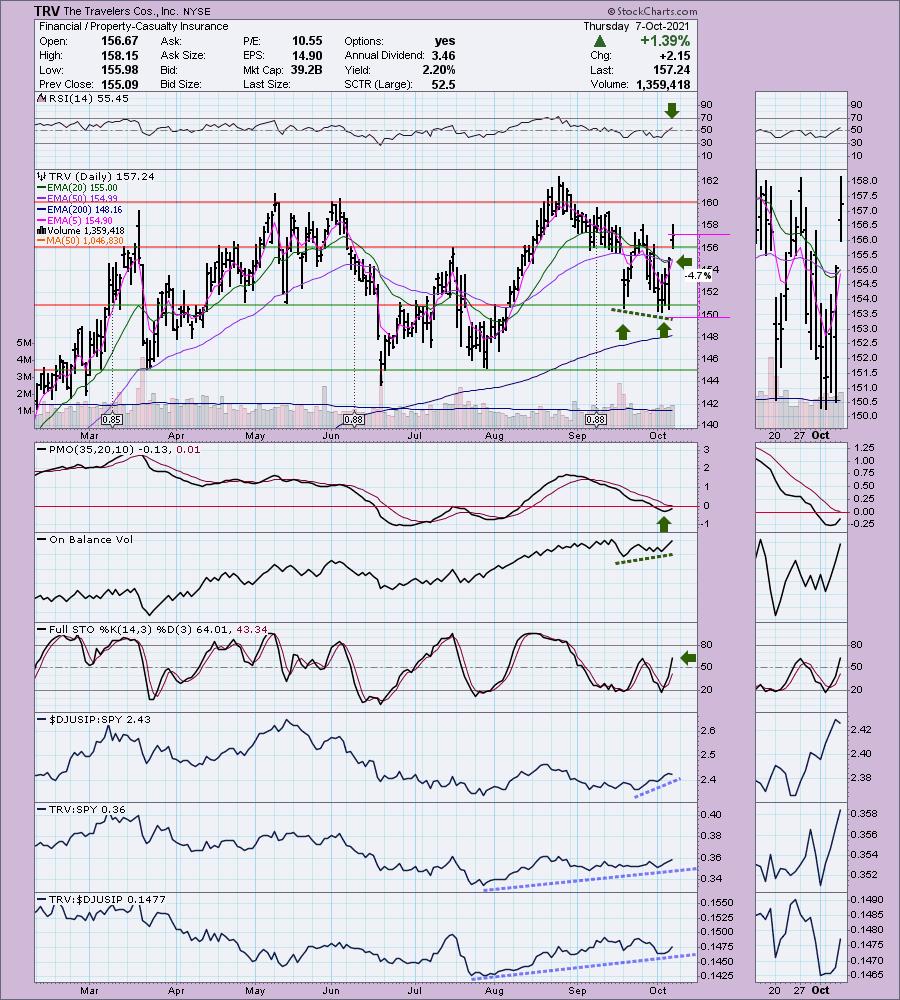
TRV is up +0.17% in after hours trading. Last Friday, I suggested watching the Financial sector. One reader took that to heart and provided me with plenty to choose from, but this one came from another subscriber. I think it verifies that this sector still has some strength left. I liked this one due to the strong positive OBV divergence leading into this rally. Those generally lead to sustained rallies. This is also part of a double-bottom pattern. Price is nearing the confirmation line right now. The RSI just entered positive territory and the PMO has turned up. Stochastics are strong and are also suggesting a sustained rally ahead. The stop is easily made tight as the recent support level isn't that far away.
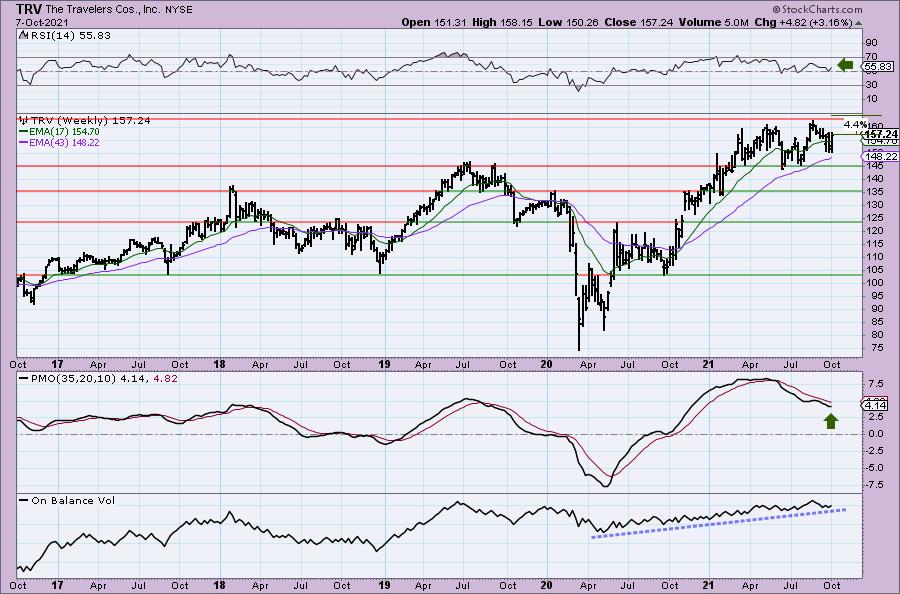
The weekly RSI is positive and rising and the PMO is decelerating and turning back up. The OBV has been consistently rising with price. I believe it will set new all-time highs.
Upwork Inc. (UPWK)
EARNINGS: 10/27/2021 (AMC)
Upwork, Inc. operates an online marketplace that enables businesses to find, hire, and pay freelancers for short-term and longer-term projects. Its marketplace offerings include Upwork Basic, Upwork Plus, Upwork Business, Upwork Enterprise, and Upwork Payroll. The company was founded by Odysseas Tsatalos and Efstratios Karamanlakis in December 2013 and is headquartered in San Francisco, CA.
Predefined Scans Triggered: New CCI Buy Signals, Parabolic SAR Buy Signals and P&F Low Pole.
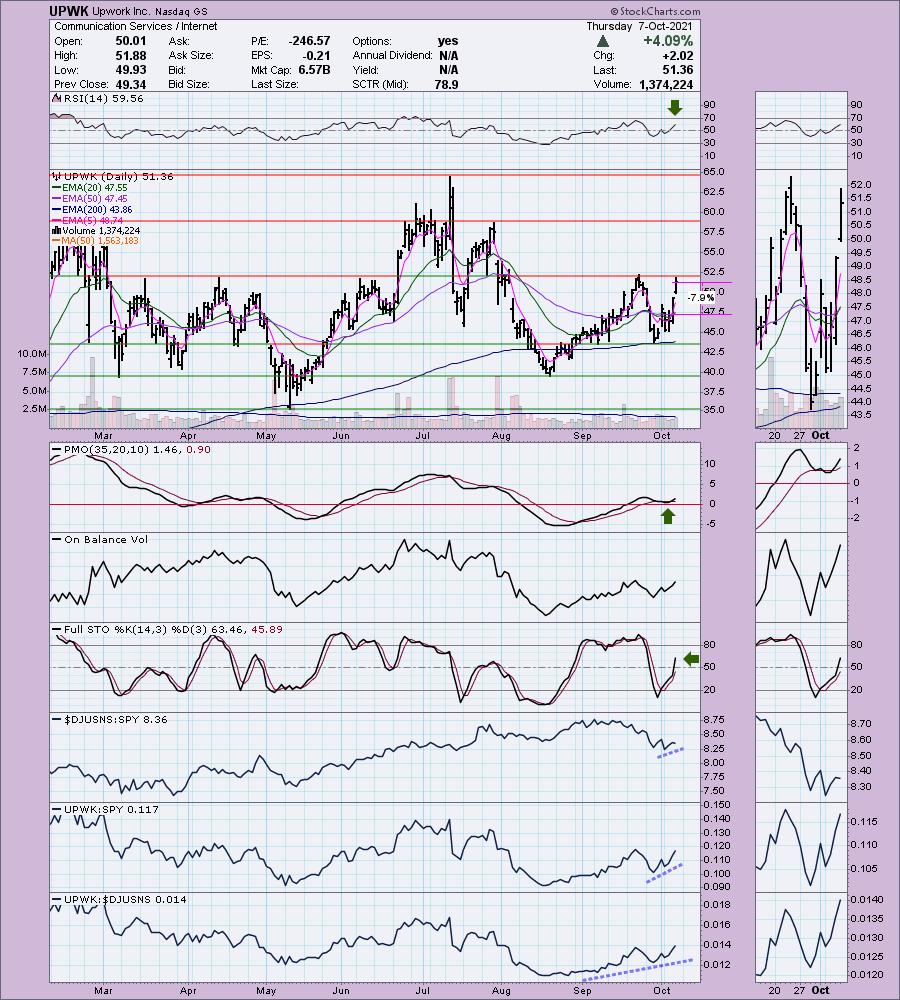
UPWK is unchanged in after hours trading. It rallied strongly today and triggered a "Silver Cross" Buy Signal. The PMO is rising on a BUY signal after kissing the signal line above zero. The RSI is in positive territory and not overbought. The OBV is confirming the move and Stochastics are very positive. Relative strength is also very good. The stop is set below the EMAs.
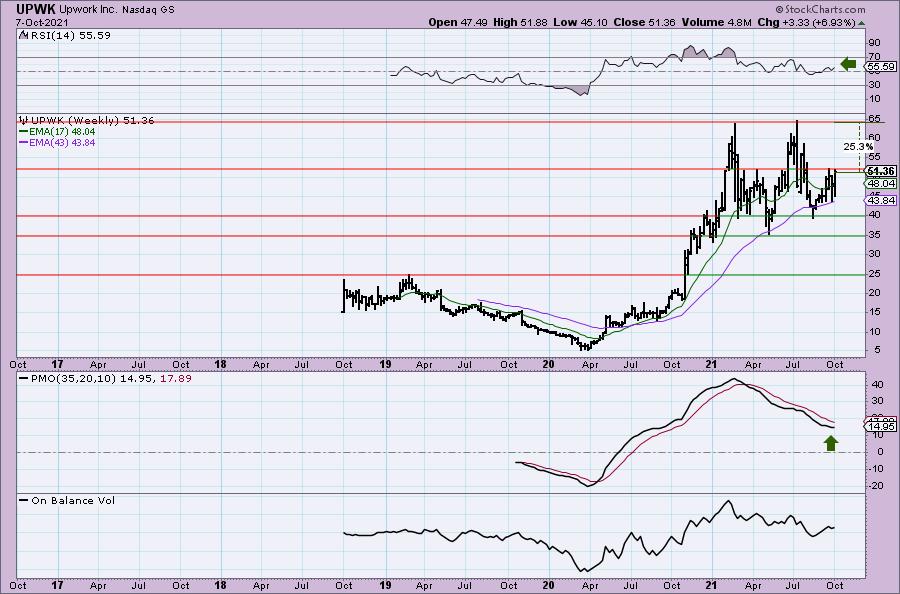
The PMO is decelerating again and the weekly RSI is positive. Upside potential is a move to all-time highs about 25% away.
Don't forget, on Thursdays I look at reader-requested symbols, click HERE to shoot me an email. I read every email I receive and try to answer them all!
Current Market Outlook:
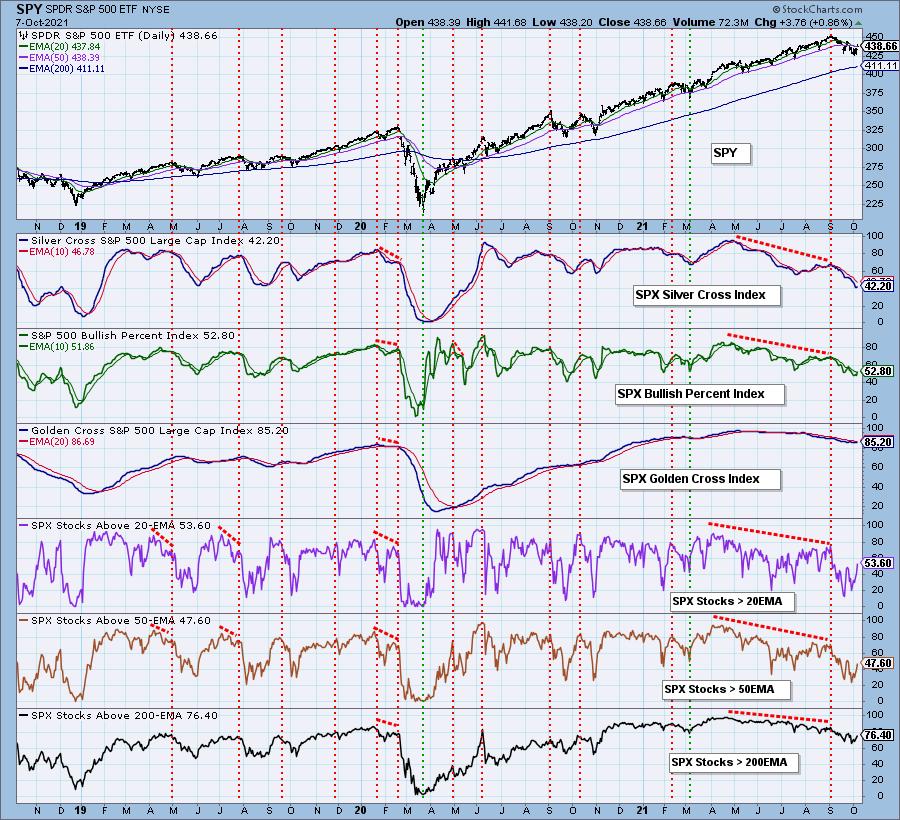
Market Environment: It is important to consider the odds for success by assessing the market tides. The following chart uses different methodologies for objectively showing the depth and trend of participation for intermediate- and long-term time frames.
- The Silver Cross Index (SCI) shows the percentage of SPX stocks on IT Trend Model BUY signals (20-EMA > 50-EMA)
- The Golden Cross Index (GCI) shows the percentage of SPX stocks on LT Trend Model BUY signals (50-EMA > 200-EMA)
- The Bullish Percent Index (BPI) shows the percentage of SPX stocks on Point & Figure BUY signals.
Don't forget that as a "Diamonds" member, you have access to our GCI/SCI curated ChartList on DecisionPoint.com. You'll find it under "Members Only" links on the left side on the Blogs and Links Page.
Here is the current chart:
Full Disclosure: I'm about 70% invested and 30% is in 'cash', meaning in money markets and readily available to trade with.
I'm required to disclose if I currently own a stock and if I may buy it within the next 72 hours.
Technical Analysis is a windsock, not a crystal ball.
Happy Charting!
- Erin
erin@decisionpoint.com
Watch the latest episode of DecisionPoint with Carl & Erin Swenlin on Mondays 7:00p EST or on the DecisionPoint playlist on the StockCharts TV YouTube channel here!
NOTE: The stocks reported herein are from mechanical trading model scans that are based upon moving average relationships, momentum and volume. DecisionPoint analysis is then applied to get five selections from the scans. The selections given should prompt readers to do a chart review using their own analysis process. This letter is not a call for a specific action to buy, sell or short any of the stocks provided. There are NO sure things or guaranteed returns on the daily selection of "Diamonds in the Rough."
Helpful DecisionPoint Links:
DecisionPoint Shared ChartList and DecisionPoint Chart Gallery
Price Momentum Oscillator (PMO)
Swenlin Trading Oscillators (STO-B and STO-V)
For more links, go to DecisionPoint.com