
More all-time highs and a breakout has flipped the script on sector rotation. We are now seeing Technology back in the limelight. But that isn't the only sector enjoying the rally, Consumer Discretionary is back on track while Industrials and Materials are maintaining strength.
Reader requests were light this week, but I did find some interesting ones to share today. Of course, I have included one of my own, AMRC, a Heavy Construction stock that is looking to breakout especially given the proposed infrastructure plan.
On today's Chartwise Women, Mary Ellen and I discussed the new Biden infrastructure plan and how that is affecting the market and relative strength within it. We looked at lots of stocks that are pivoting, so be sure and check out the show HERE. Speaking of Mary Ellen, she will be joining me in Monday's free trading room! Don't miss it! I'm sure she will share her stock picks and many of her MEM Edge portfolio winners.
I didn't realize until yesterday that Friday was a holiday, I always assume the market is open, because it seems it always is. Therefore, this week there won't be a Recap. However, I am still holding the Diamond Mine tomorrow. We can review these stocks in more detail and concentrate on looking forward into next week.
Today's "Diamonds in the Rough" are: AMRC, FRPT, MELI, NEE and TCEHY.
 Diamond Mine REGISTRATION Information:
When: Apr 2, 2021 09:00 AM Pacific Time (US and Canada)
Topic: DecisionPoint Diamond Mine (04/02/2021) LIVE Trading Room
Register in advance for this webinar HERE.
After registering, you will receive a confirmation email containing information about joining the webinar, including the password.
=======================================================================
Diamond Mine RECORDING Link from 3/26/2021:
Topic: DecisionPoint Diamond Mine (03/26/2021) LIVE Trading Room
Start Time : Mar 26, 2021 08:58 AM
Meeting Recording HERE.
Access Passcode: i$6DFL+U
***Click here to register for this recurring free DecisionPoint Trading Room on Mondays at Noon ET!***
+++++++++++++++++++++++++++++++++++++++++++++++++++++++++++++++++++++++++++++++
Free DP Trading Room RECORDING LINK:
Topic: DecisionPoint Trading Room
Start Time : Mar 29, 2021 08:54 AM
DP Trading Room Meeting Recording HERE.
Access Passcode: f^mTv+1?
For best results, copy and paste the access code to avoid typos.
Welcome to DecisionPoint Daily Diamonds, wherein I highlight five "diamonds in the rough." These are selected from the results of my DecisionPoint scans, which search for stocks that could benefit from the trend and condition of the market. Remember, these are not recommendations to buy or sell, but are the most interesting of the stocks that surfaced in my scans. My objective is to save you the work of the initial, tedious culling process, but you need to apply your own analysis to see if these stocks pique your interest as well. There are no guaranteed winners here!
Ameresco Inc. (AMRC)
EARNINGS: 5/3/2021 (AMC)
Ameresco, Inc. engages in the provision of energy services, including energy efficiency, infrastructure upgrades, asset sustainability, and renewable energy solutions for businesses and organizations throughout North America and Europe. It operates through the following segments: U.S. Regions, U.S. Federal, Canada, Non-Solar Distributed Generation (DG), and All Other. The U.S. Regions, U.S. Federal, and Canada segments offers energy efficiency products and services, such as design, engineering and installation of equipment and other measures to improve the efficiency and control the operation of a facility's energy infrastructure; and renewable energy solutions and services. The Non-Solar DG sells electricity, processed renewable gas fuel, heat or cooling, produced from renewable sources of energy, other than solar, and generated by small-scale plants; and operations and maintenance services for customer owned small-scale plants. The All Other segment focuses on the provision of enterprise energy management services, consulting services, and integrated-photovoltaic. The company was founded by George Peter Sakellaris on April 25, 2000 and is headquartered in Framingham, MA.
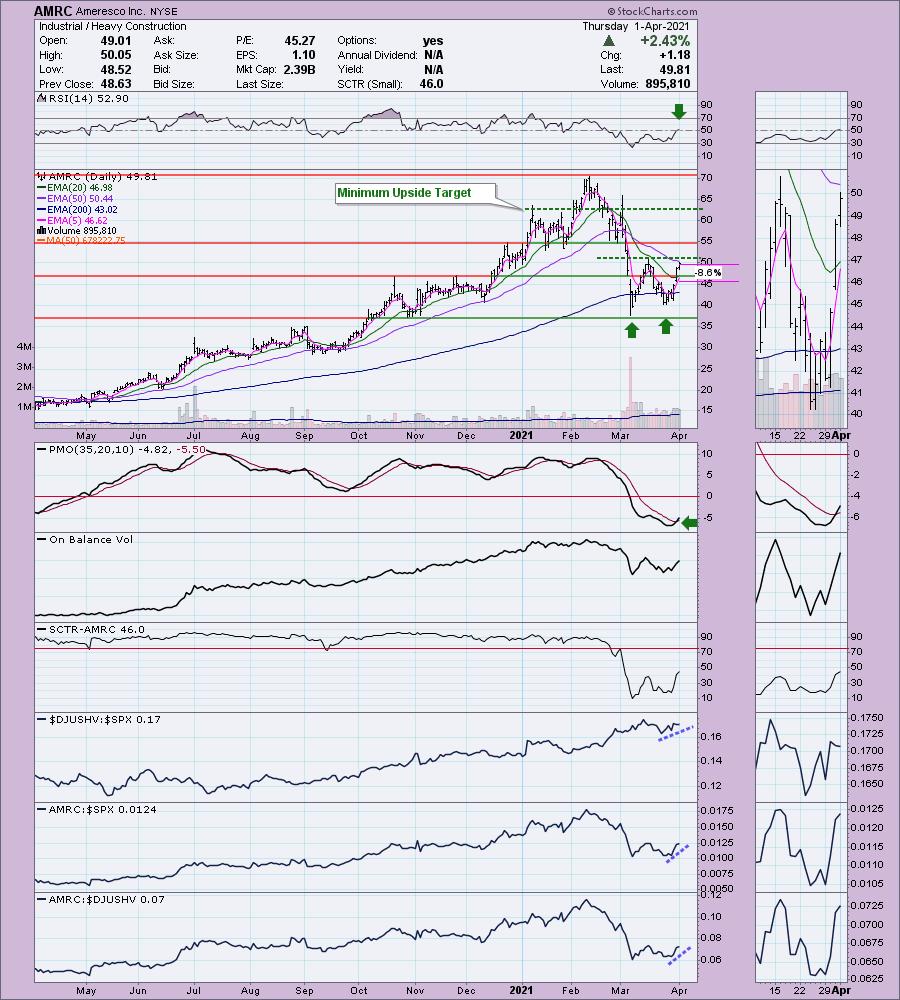
AMRC is up +0.38% in after hours trading. This is my selection today. Read the description of this company. It hits nearly all of the points in the Biden infrastructure plan--"US Regions, US Federal...", "energy infrastructure" and "renewable energy". This one is definitely on my radar for next week. It has a double-bottom with an upside target around $63. The PMO just triggered a crossover BUY signal and the RSI is now in positive territory. It's beginning to outperform, you can see that the SCTR is rising quickly in response. The stop is set below support at the late 2020 tops.
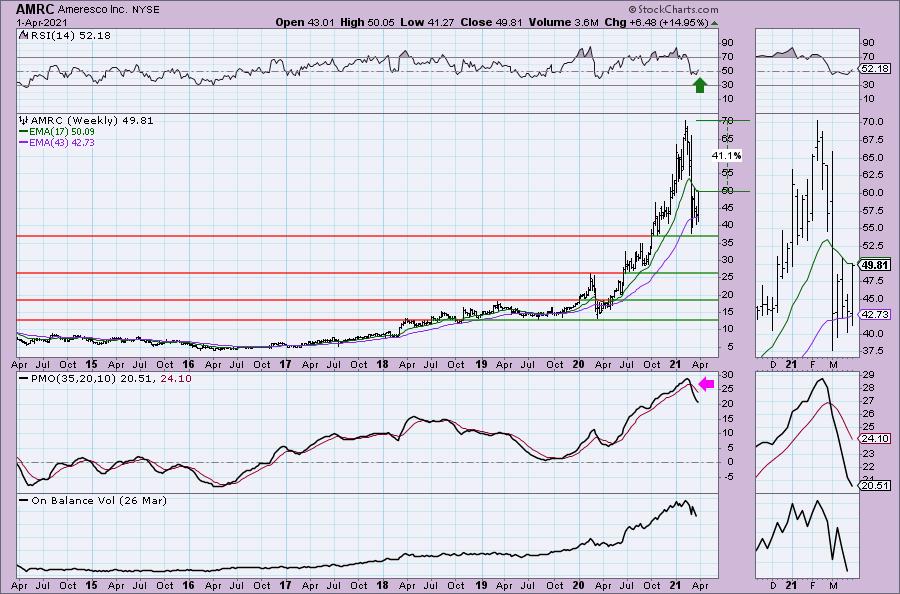
You'll probably notice that a lot of "diamonds in the rough" have less than appetizing weekly charts. The scans try to catch new momentum and that generally occurs after a period of negative momentum. Hence the declining PMO on overbought SELL signals. AMRC's PMO appears to be decelerating somewhat and the RSI just reentered positive territory. If it can reach this year's high, that would be an over 40% gain.
Freshpet Inc. (FRPT)
EARNINGS: 5/3/2021 (AMC)
Freshpet, Inc. engages in the manufacturing, marketing, and distribution of pet food and pet treats for dogs and cats. Its products are sold throughout the United States and in Canada under the Freshpet Select, Vital and Nature's Fresh brands. Its products include deli fresh grain free chicken recipe for dogs; dog joy turkey and apple bites treats for dogs; nature's fresh grain free chicken recipe for cats; and vital grain free chicken and ocean whitefish recipe for cats. The company was founded by Scott Morris and Cathal Walsh in November 2004 and is headquartered in Secaucus, NJ.
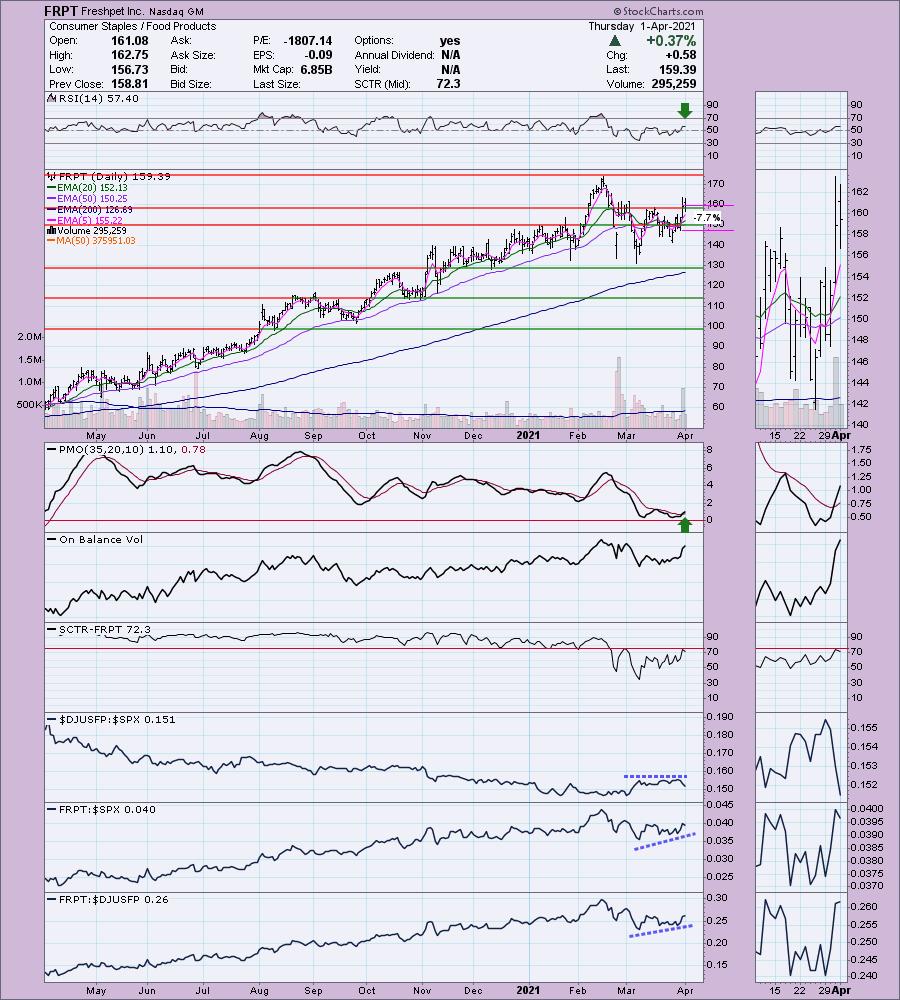
FRPT is up +0.38% in after hours trading. I covered this in the March 25 2020 Diamonds Report. The stop was never hit and it is currently up 176% since I presented it. It's had a rocky 2021, but it is looking good again for entry. The PMO just triggered a crossover BUY signal and the RSI is positive. Volume is really coming in on the current rally. It's been outperforming somewhat. Look at the last week, the industry group is tanking, but FRPT is outperforming it and the SPX. I suppose you could look at this as a double-bottom, but mainly I am impressed with the breakout and subsequent pullback toward the breakout point. The stop is set somewhat tight at this week's intraday low.
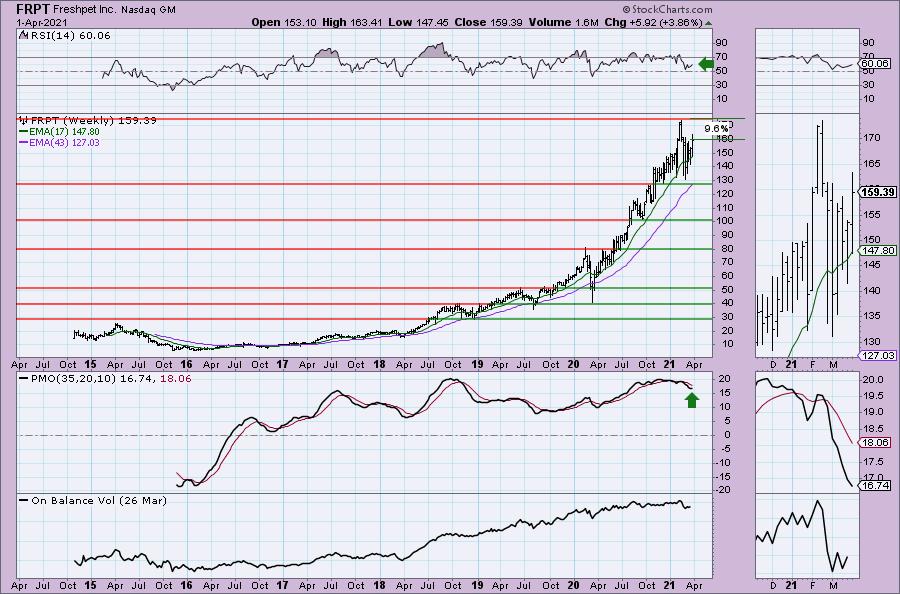
The RSI is positive, but the PMO is far from healthy. I believe a tight stop here is a good idea as the last time it failed, it was a long way down.
MercadoLibre Inc. (MELI)
EARNINGS: 5/4/2021 (AMC)
MercadoLibre, Inc. engages in the provision of online commerce platform with focus on e-commerce and its related services. It operates through the following geographical segments: Brazil, Argentina, Mexico, Venezuela, and Other Countries. The firm provides users a mechanism for buying, selling and paying as well as collecting, generating leads, and comparing lists through e-commerce transactions. The company was founded by Marcos Eduardo Galperin on October 15, 1999 and is headquartered in Buenos Aires, Argentina.
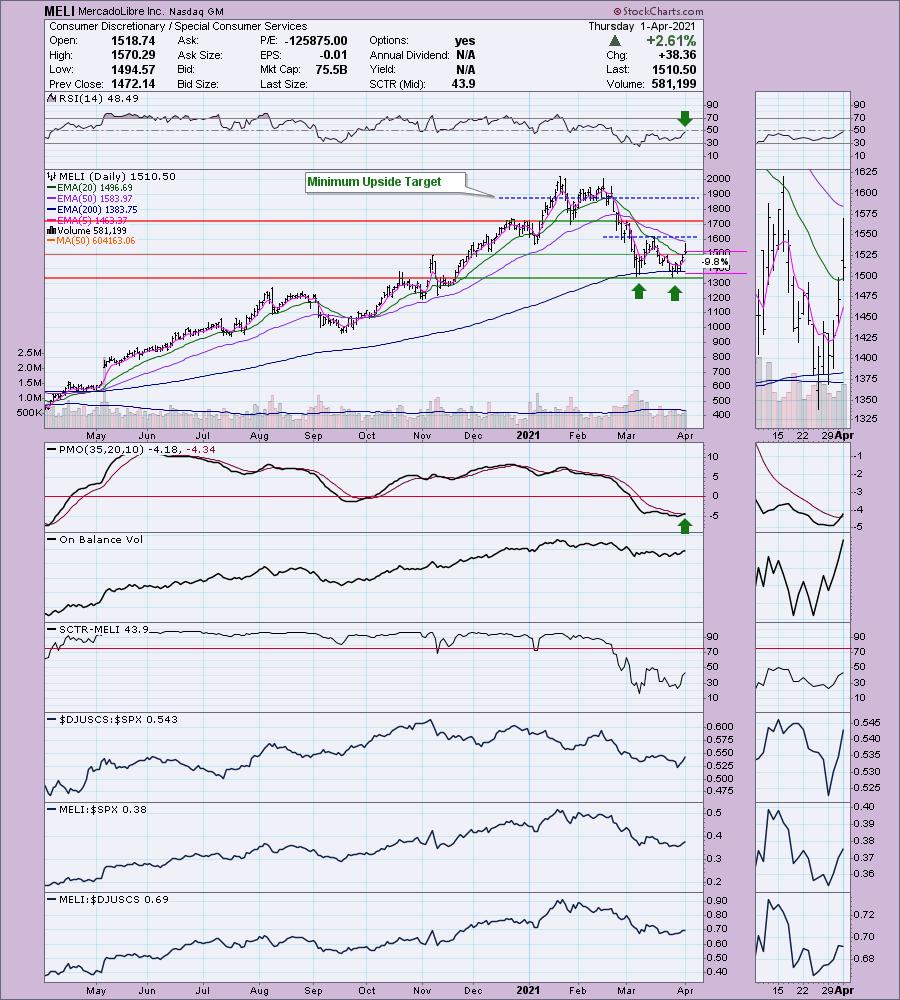
MELI is down -0.10% in after hours trading. This was another big winner from the May 4th 2020 Diamond Report. Since May 4th it is up 148.7% as it never hit its stop. It looks very interesting right now given the bullish double-bottom formation developing and today's breakout and close above the 20-EMA. The PMO triggered a crossover BUY signal today and the RSI is just about ready to enter positive territory above net neutral (50). It's performing about as well as the SPX which is acceptable. It would be 12%+ stop level if you take it down below the double-bottom. That's too deep for me so I set it just under the 200-EMA.
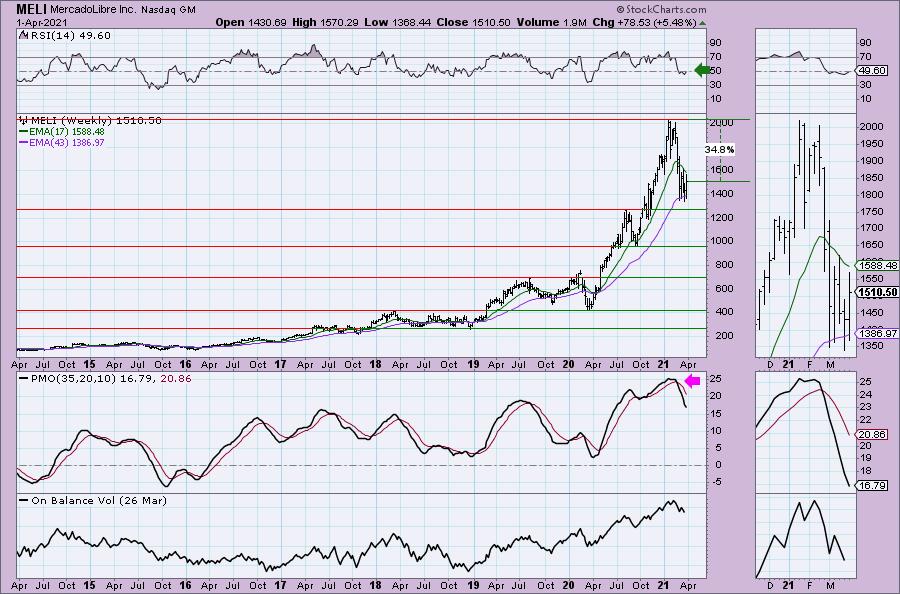
The weekly chart isn't great. The RSI is about to enter positive territory which is bullish but intermediate-term momentum hasn't really improved yet. Keep this in mind.
Don't forget, on Thursdays I look at reader-requested symbols, so shoot me an email at erin@decisionpoint.com. I read every email I receive and try to answer them all!
NextEra Energy Inc. (NEE)
EARNINGS: 4/22/2021 (BMO)
NextEra Energy, Inc. is an electric power and energy infrastructure company. It operates through the following segments: FPL & NEER. The FPL segment engages primarily in the generation, transmission, distribution and sale of electric energy in Florida. The NEER segment produces electricity from clean and renewable sources, including wind and solar. It provides full energy and capacity requirements services; engages in power and gas marketing and trading activities; participates in natural gas production and pipeline infrastructure development; and owns a retail electricity provider. The company was founded in 1984 and is headquartered in Juno Beach, FL.
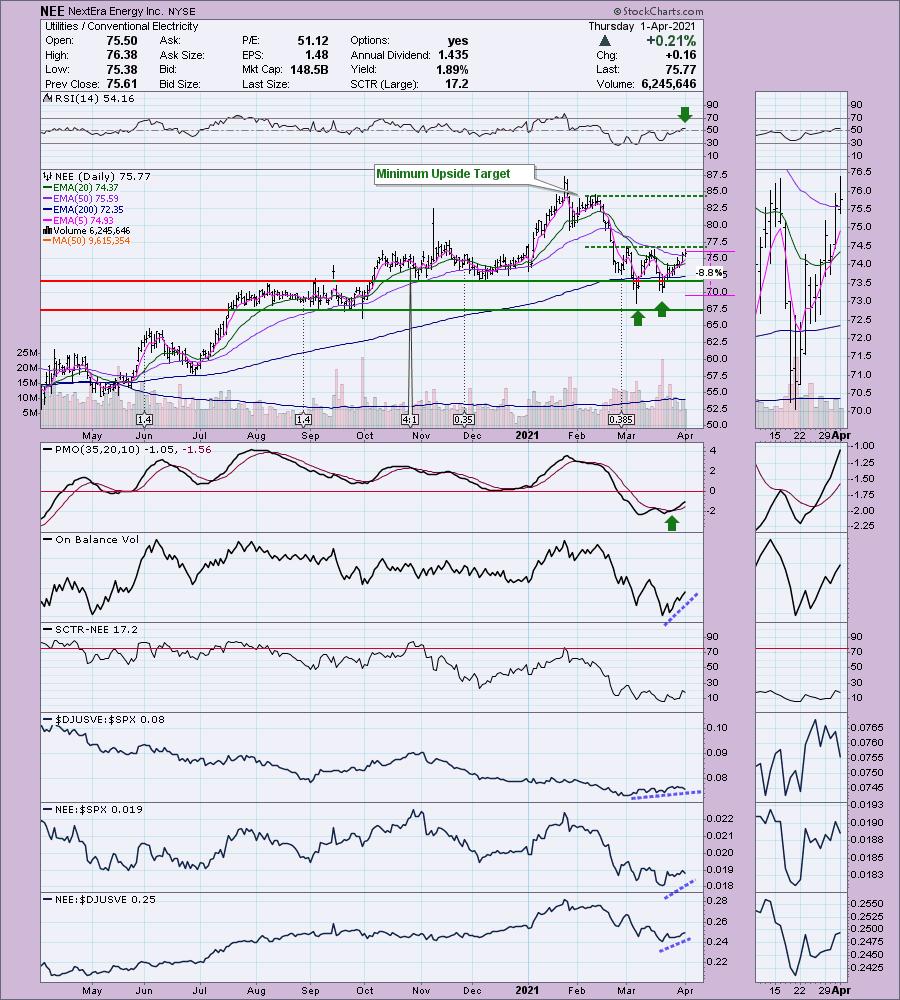
NEE is up slightly +0.04% in after hours trading. I covered NEE in the September 3rd 2020 Diamond Report. I couldn't tell if it was a reader request, but in any case it is up a modest 9.1% since then as the stop was never hit. I definitely like the double-bottom on this chart. It is on a PMO BUY signal and the RSI just moved into positive territory. Volume is confirming this current rally so I'm expecting a breakout. While the industry group as a whole isn't doing so well, NEE is outperforming. The stop is set just below the second bottom.
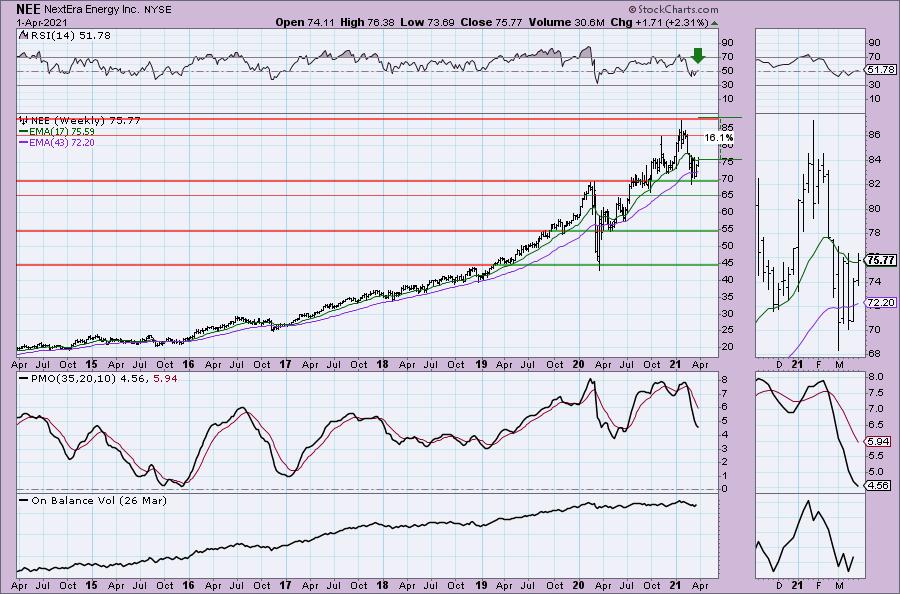
The weekly PMO is showing some deceleration and the weekly RSI is reentering positive territory. If it can hit all-time highs again, that would be a 16% gain.
Tencent Holdings Ltd. (TCEHY)
EARNINGS: 5/12/2021 (BMO)
Tencent Holdings Ltd. is an investment holding company. It operates through the following segments: Value-Added Services, FinTech and Business Services, Online Advertising, and Others. The Value-added Services segment involves online and mobile games, community value-added services, and applications across various Internet and mobile platforms. The FinTech and Business Services segment provides fintech and cloud services, which include commissions from payment, wealth management and other services. The Online Advertising segment represents display based and performance based advertisements. The Other segment consists of trademark licensing, software development services, software sales, and other services. The company was founded by Yi Dan Chen, Hua Teng Ma, Chen Ye Xu, Li Qing Zeng, and Zhi Dong Zhang on November 11, 1998 and is headquartered in Shenzhen, China.
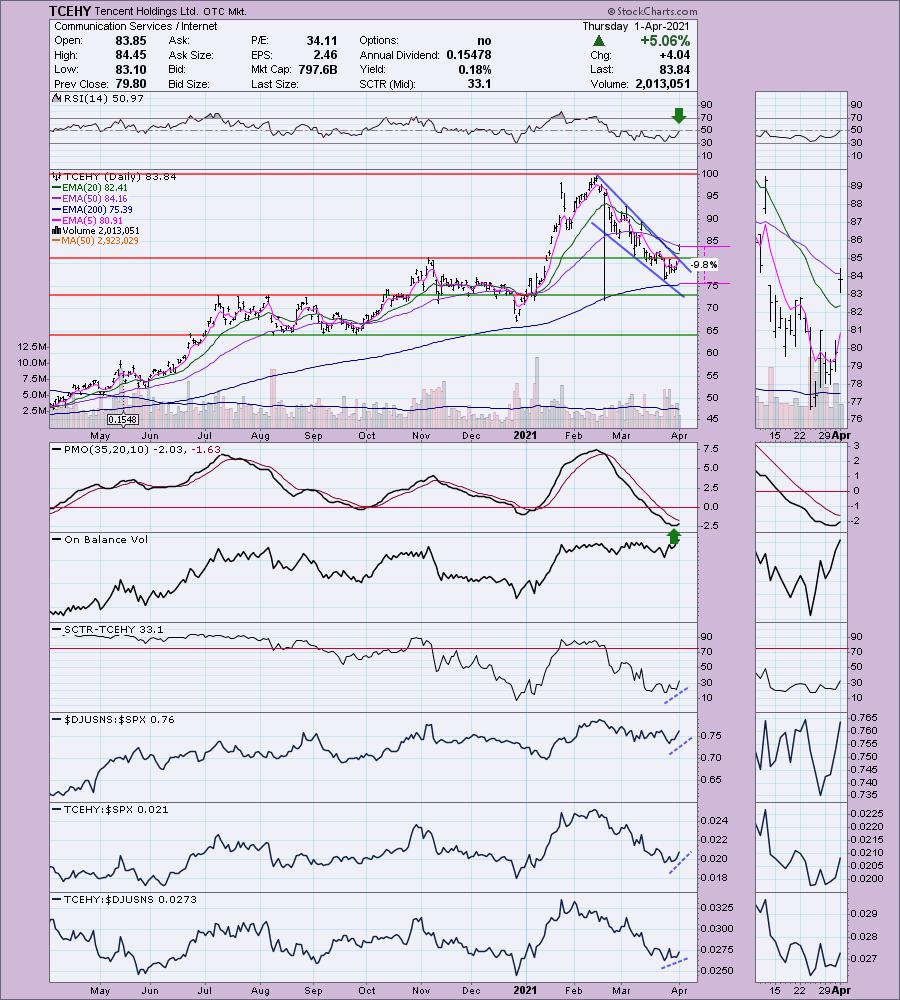
TCEHY is unchanged in after hours trading. I've covered TCEHY twice. First in the May 29th 2020 Diamond Report. It was a reader request that I was neutral on. While I didn't list a stop level, looking at the old chart, I know I would've set it around $52, that stop was never hit so it is up 54.3% since. The second time I covered it was in the August 26th 2020 Diamonds Report. In this case, the stop was hit for a 6.9% loss. It appears ready to take off right now. The PMO has turned up and the RSI just landed in positive territory. Based on the OBV, volume wasn't particularly heavy on the decline last month which tells me there was some reluctance to sell despite the terrible decline. Today we got a breakout from a bullish falling wedge. Price gapped up in what appears to be a breakaway gap; however, I do caution you as you'll notice that the previous gap up earlier in March turned out to be a reverse island. The stop is somewhat deep at 9.8%, but that lines us up with the March low.
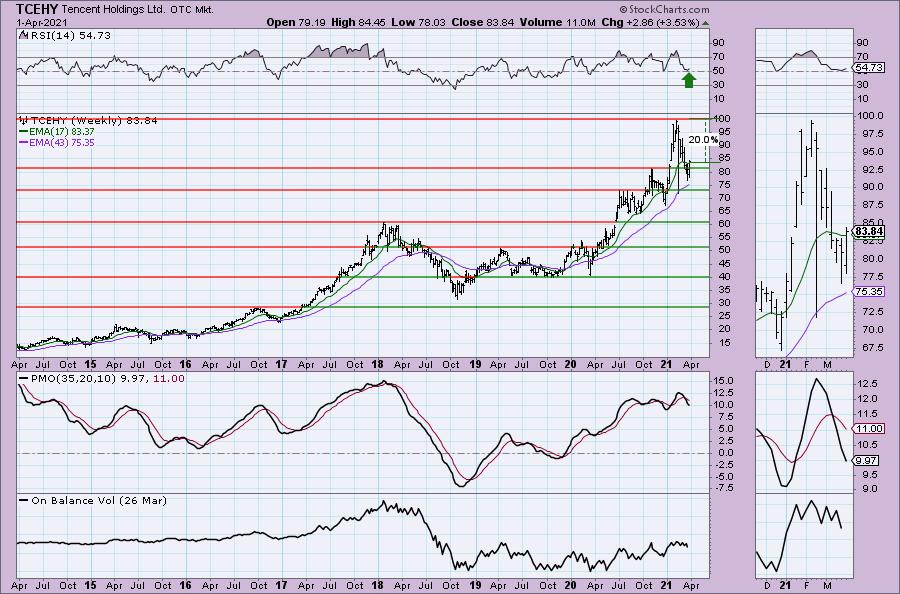
The RSI is positive, but the PMO is far from healthy. This tells me to consider it more of a short-term investment. If it reaches the 2021 high, that would be a 20% gain.
Full Disclosure: I'm about 45% invested and 55% is in 'cash', meaning in money markets and readily available to trade with. Next week I will be considering adding some of the infrastructure plan type stocks, building materials, telecom equipment, concrete and steel. Semiconductors are looking promising as well. The bullish bias in the market is strong enough to venture out a bit.
Current Market Outlook:
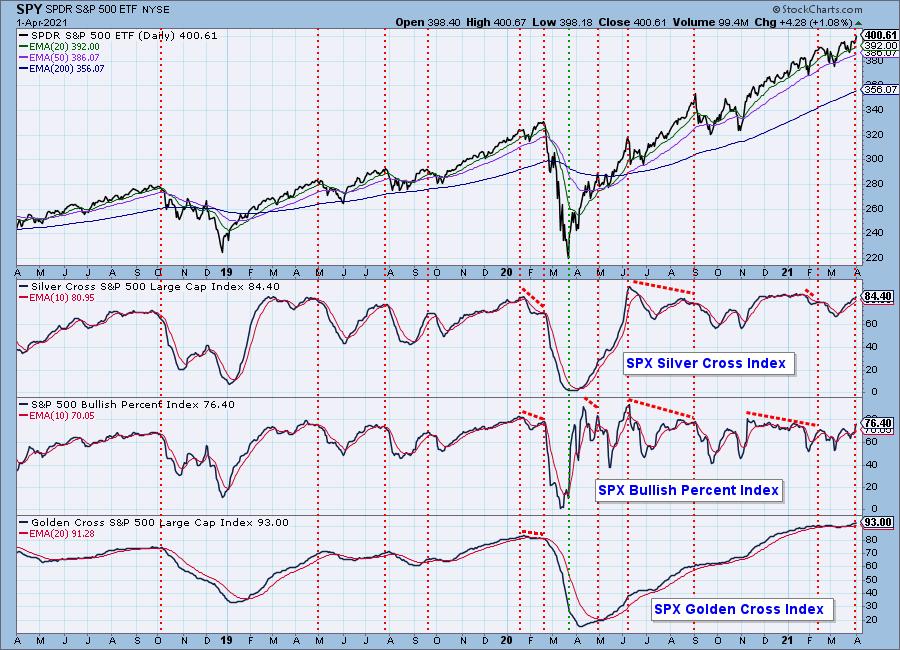
Market Environment: It is important to consider the odds for success by assessing the market tides. The following chart uses different methodologies for objectively showing the depth and trend of participation for intermediate- and long-term time frames.
- The Silver Cross Index (SCI) shows the percentage of SPX stocks on IT Trend Model BUY signals (20-EMA > 50-EMA)
- The Golden Cross Index (GCI) shows the percentage of SPX stocks on LT Trend Model BUY signals (50-EMA > 200-EMA)
- The Bullish Percent Index (BPI) shows the percentage of SPX stocks on Point & Figure BUY signals.
Don't forget that as a "Diamonds" member, you have access to our GCI/SCI curated ChartList on DecisionPoint.com. You'll find it under "Members Only" links on the left side on the Blogs and Links Page.
Here is the current chart:
Diamond Index:
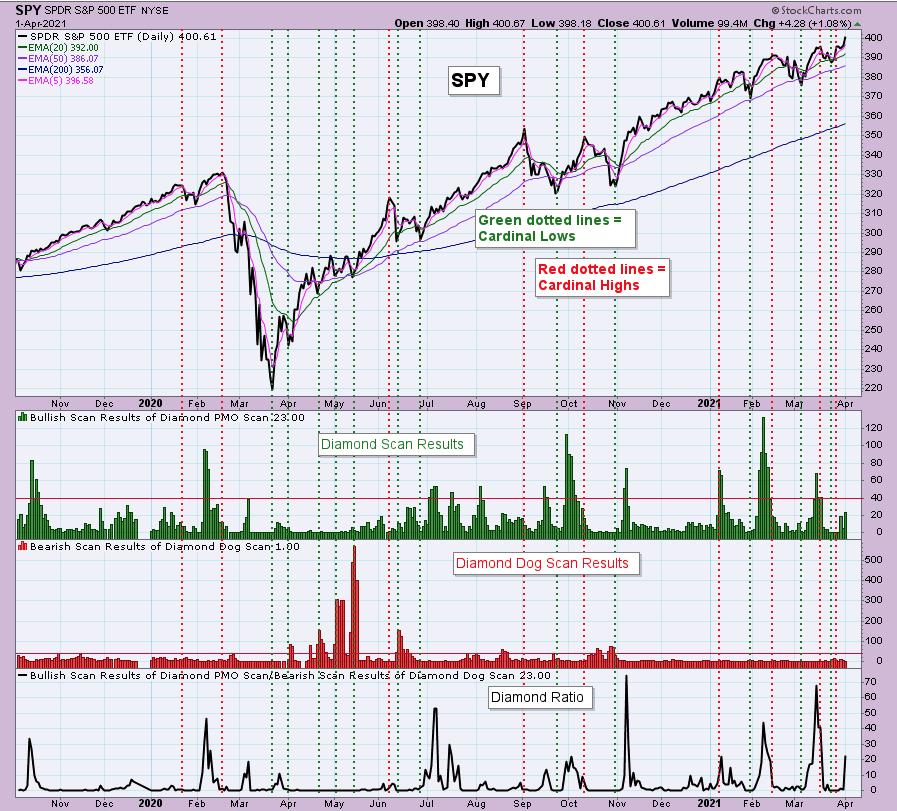
The Diamond Index chart looks at the number of scan results from my bullish Diamond PMO Scan and the number of scan results from the inverse Diamond Dog Scan. The Diamond Ratio divides the bullish results by the bearish results.
I only have data going back to October 2019 so I won't make any sweeping conclusions about the Diamond Index chart. I have marked cardinal tops with red dotted vertical lines and cardinal price bottoms with green dotted vertical lines. I believe that when the Diamond Dog results spike, it usually comes at a price bottom, or marks a strong continuation of the rising trend.
Unfortunately, the Diamond PMO Scan result numbers aren't providing much insight. The Diamond Ratio has promise, but again I don't see a clear correlation to the market tops/bottoms right now. I need to study and manipulate the data some more. Keep you posted!
Technical Analysis is a windsock, not a crystal ball.
Happy Charting!
- Erin
erin@decisionpoint.com
Watch the latest episode of DecisionPoint with Carl & Erin Swenlin on Mondays 7:00p EST or on the DecisionPoint playlist on the StockCharts TV YouTube channel here!
NOTE: The stocks reported herein are from mechanical trading model scans that are based upon moving average relationships, momentum and volume. DecisionPoint analysis is then applied to get five selections from the scans. The selections given should prompt readers to do a chart review using their own analysis process. This letter is not a call for a specific action to buy, sell or short any of the stocks provided. There are NO sure things or guaranteed returns on the daily selection of "diamonds in the rough."
Helpful DecisionPoint Links:
DecisionPoint Shared ChartList and DecisionPoint Chart Gallery
Price Momentum Oscillator (PMO)
Swenlin Trading Oscillators (STO-B and STO-V)
For more links, go to DecisionPoint.com!
