
Consumer Discretionary (XLY) finished strongly today and with many retailers reporting earnings for the third quarter, it does appear we will see a continuation of this trend. What is beautiful about Cyclicals right now is that many of them have spent the last few weeks consolidating or pulling back a bit. I found four "Diamonds in the Rough" from this sector that might interest you.
I apologize that the Monday free Trading Room was canceled yesterday. My mother had a procedure at the hospital and I needed to be there. All went well and she is resting comfortably. The Diamond Mine trading room is scheduled to happen as usual at Noon ET this Friday. The link to register as well as last Friday's recording links are below.
It isn't too early to send me your requests for Thursday! I always like to have a large number to review, so send in one or two or more and see if yours gets picked!
Today's "Diamonds in the Rough": DBI, DG, PVH and TGT.
Stocks to Review: ORLY, LE, BNTX, LAD and TPX.

RECORDING LINK Friday (11/12):
Topic: DecisionPoint Diamond Mine (11/12/2021) LIVE Trading Room
Start Time: Nov 12, 2021 09:00 AM
Meeting Recording Link HERE.
Access Passcode: November@12
REGISTRATION FOR FRIDAY 11/19 Diamond Mine:
When: Nov 19, 2021 09:00 AM Pacific Time (US and Canada)
Topic: DecisionPoint Diamond Mine (11/19/2021) LIVE Trading Room
Register in advance for this webinar HERE.
Save the registration confirmation email with login instructions in case Zoom doesn't notify you in time.

Free DP Trading Room (11/8) RECORDING LINK:
Topic: DecisionPoint Trading Room
Start Time: Nov 8, 2021 08:57 AM
Meeting Recording Link HERE.
Access Passcode: November%8
For best results, copy and paste the access code to avoid typos.
Welcome to DecisionPoint Daily Diamonds, wherein I highlight five "Diamonds in the Rough." These are selected from the results of my DecisionPoint scans, which search for stocks that could benefit from the trend and condition of the market. Remember, these are not recommendations to buy or sell, but are the most interesting of the stocks that surfaced in my scans. My objective is to save you the work of the initial, tedious culling process, but you need to apply your own analysis to see if these stocks pique your interest as well. There are no guaranteed winners here!
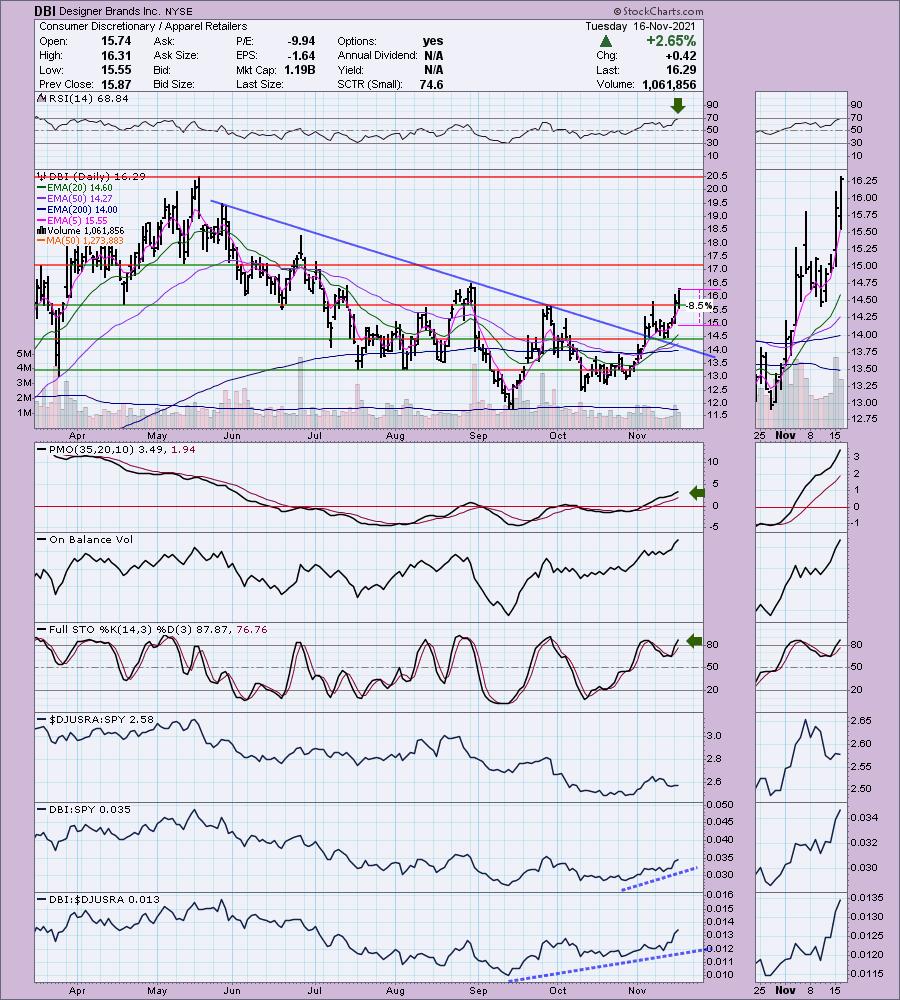
Designer Brands Inc. (DBI)
EARNINGS: 12/9/2021 (BMO)
Designer Brands, Inc. engages in the design, production, and retail of footwear and accessory brands. It operates through the following segments: U.S. Retail, Canada Retail, Brand Portfolio, and Others. The U.S. Retail segment focuses on stores operated in the U.S. under the DSW Designer Shoe Warehouse banner and its related e-commerce site. The Canada Retail segment comprises stores operated in Canada under The Shoe Company, Shoe Warehouse, and DSW Designer Shoe Warehouse banners and related e-commerce sites. The Brand Portfolio segment includes sales from wholesale, First Cost, and direct-to-consumer e commerce sites. The Other segment refers to the ABG and Ebuys business. The company was founded on January 20, 1969 and is headquartered in Columbus, OH.
Predefined Scans Triggered: P&F Double Top Breakout and Ichimoku Cloud Turned Red.
DBI is unchanged in after hours trading. We can see price broke from an intermediate-term declining trend. Once it broke out it pulled back to the breakout point but stayed above that prior declining trend. Now it is rebounding and has broken out above the September high. The RSI is positive and the PMO is rising and not overbought. The OBV is confirming the move with rising bottoms. Stochastics are positive and rising. Note that DBI is a strong performer within its group and starting this month, it has begun to outperform the SPY. The stop is set just below $15. If this one pulls back after today's big move, you can adjust the stop level to be closer to support at $14.45.
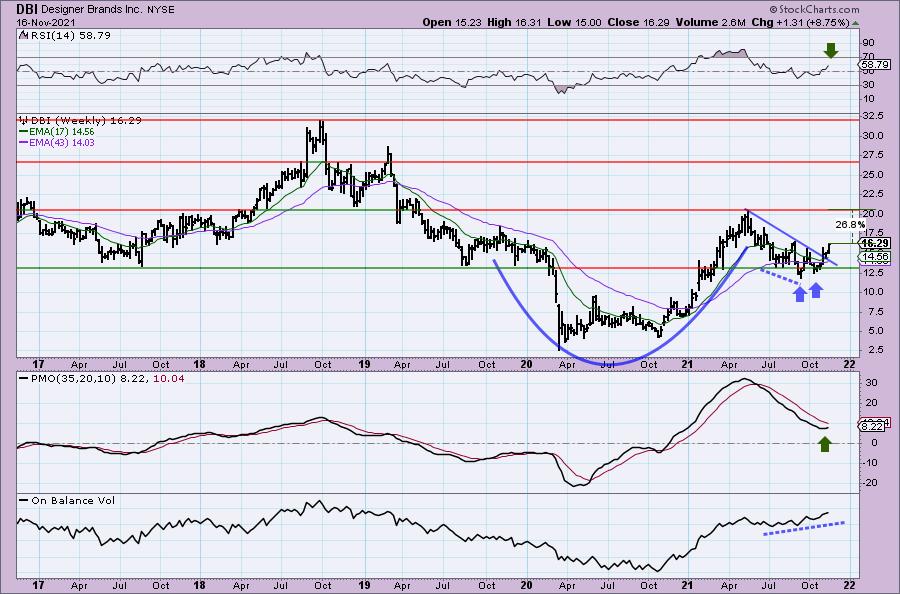
There is a loose cup and handle pattern. This breakout could be triggering this bullish pattern. The weekly RSI is now positive and the weekly PMO is rising toward a crossover BUY signal. Note the positive OBV divergence that is leading into the rally.
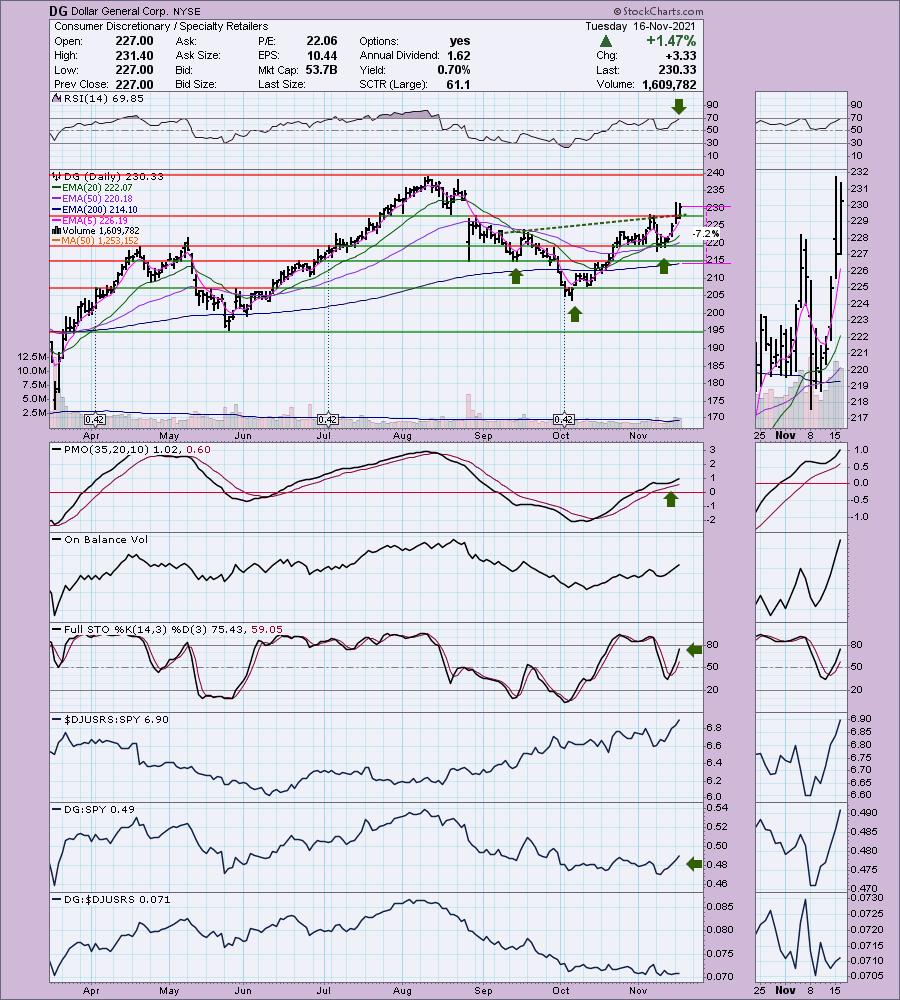
Dollar General Corp. (DG)
EARNINGS: 12/2/2021 (BMO)
Dollar General Corp. engages in the operation of merchandise stores. Its offerings include food, snacks, health and beauty aids, cleaning supplies, basic apparel, housewares, and seasonal items. It sells brands including Clorox, Energizer, Procter & Gamble, Hanes, Coca-Cola, Mars, Unilever, Nestle, Kimberly-Clark, Kellogg's, General Mills, and PepsiCo. The company was founded by J. L. Turner and Hurley Calister Turner Sr. in 1939 and is headquartered in Goodlettsville, TN.
Predefined Scans Triggered: Moved Above the Upper Keltner Channel and Moved Above Upper Bollinger Band.
DG is up +0.12% in after hours trading. I covered DG in the April 8th 2020 Diamonds Report. The stop was never hit so the position is currently up +36.1%. We have a bullish reverse head and shoulders pattern that was confirmed today. The PMO has bottomed above the signal line (which is especially bullish) and is not overbought. The RSI is positive and Stochastics are rising strongly in positive territory. It is performing in line with its industry group, but it is outperforming the SPY. The stop is set at the 200-EMA.
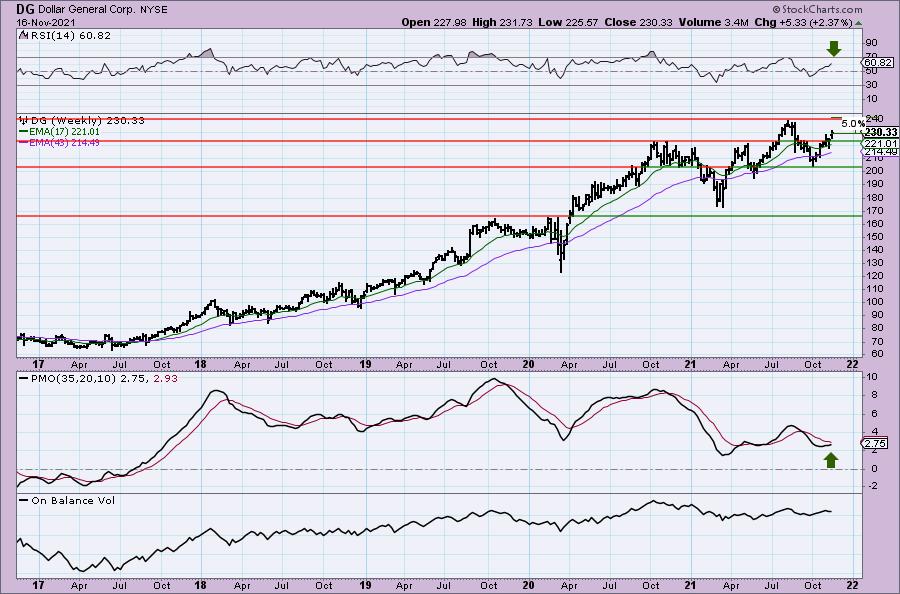
I like the set up on the weekly chart with a positive RSI and rising weekly PMO. It is only 5% away from all-time highs so I would consider an upside target of $271.79 which would be about an 18% gain.
PVH Corp. (PVH)
EARNINGS: 12/1/2021 (AMC)
PVH Corp. engages in the design and marketing of branded dress shirts, neckwear, sportswear, jeans wear, intimate apparel, swim products, handbags, footwear, and other related products. It operates through the following segments: Calvin Klein North America, Calvin Klein International, Tommy Hilfiger North America, Tommy Hilfiger International, Heritage Brands Wholesale, and Heritage Brands Retail. The Calvin Klein North America and Calvin Klein International segment operates in North America; and Europe, Asia, and Brazil respectively. It sells its products under the brand names CALVIN KLEIN 205 W39 NYC, CK Calvin Klein, and CALVIN KLEIN. The Tommy Hilfiger North America and Tommy Hilfiger International segment wholesales in North America; and Europe and China respectively. It consists of Tommy Hilfiger, Hilfiger Denim, Hilfiger Collection, and Tommy Hilfiger Tailored brands. The Heritage Brands Wholesale segment markets its products to department, chain, and specialty stores, digital commerce sites operated by select wholesale partners and pure play digital commerce retailers in North America. The Heritage Brands Retail segment manages retail stores, primarily located in outlet centers throughout the United States and Canada. PVH was founded in 1881 and is headquartered in New York, NY.
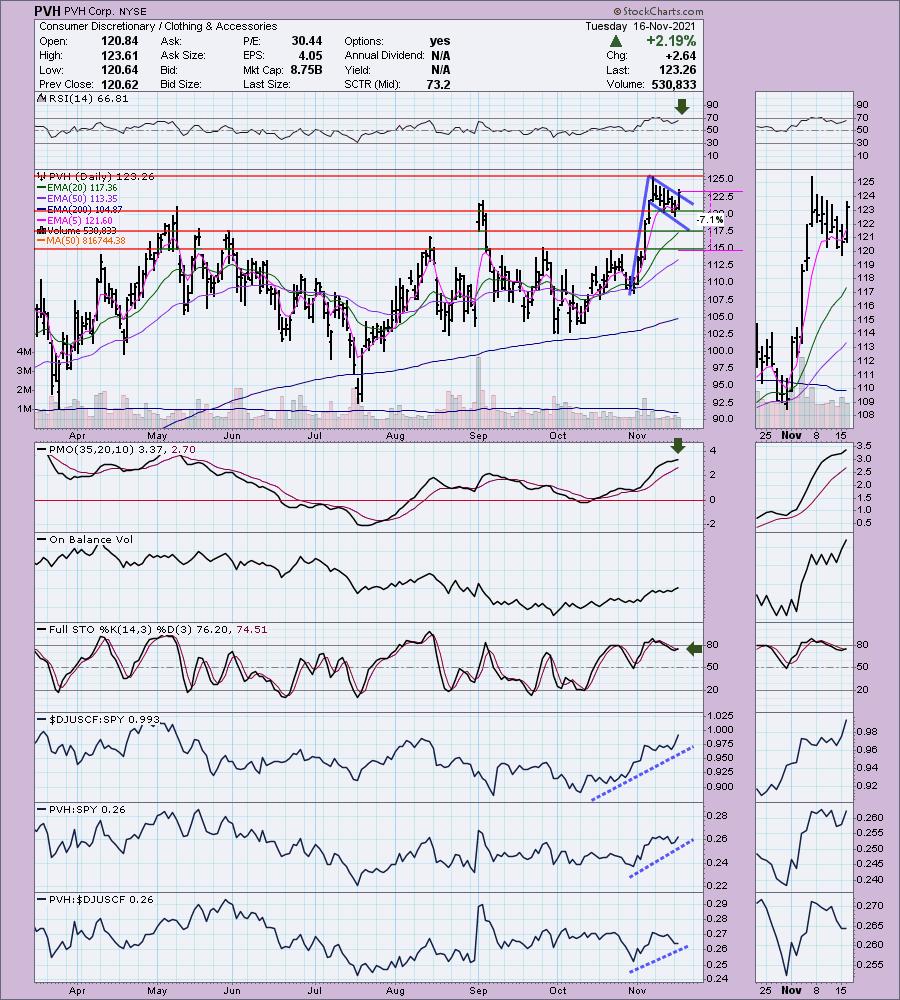
Predefined Scans Triggered: P&F Double Top Breakout.
PVH is unchanged in after hours trading. I like the flag formation on this chart and today could be considered a confirmation breakout. The RSI is positive and the PMO is now accelerating higher. Notice in the thumbnail that the OBV bottoms were rising slightly as the flag was formed giving us a positive divergence in the very short term. Stochastics are positive and have turned up again. In the near term PVH is underperforming its group, but overall relative strength is still in a rising trend. The stop is set below support at the September/October tops.
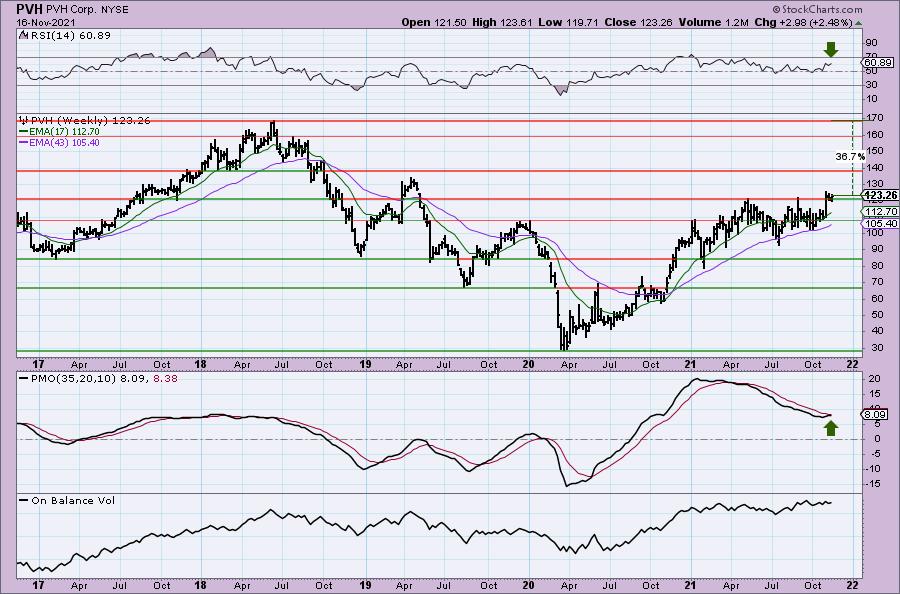
The weekly chart shows the importance of the breakout. The weekly PMO is about to trigger a crossover BUY signal and the weekly RSI is positive. Upside potential could reach above 36% if it reaches prior all-time highs.
Target Corp. (TGT)
EARNINGS: 11/17/2021 (BMO)
Target Corp. engages in the operation and ownership of general merchandise stores. It offers food assortments including perishables, dry grocery, dairy, and frozen items. The company was founded by George Draper Dayton in 1902 and is headquartered in Minneapolis, MN.
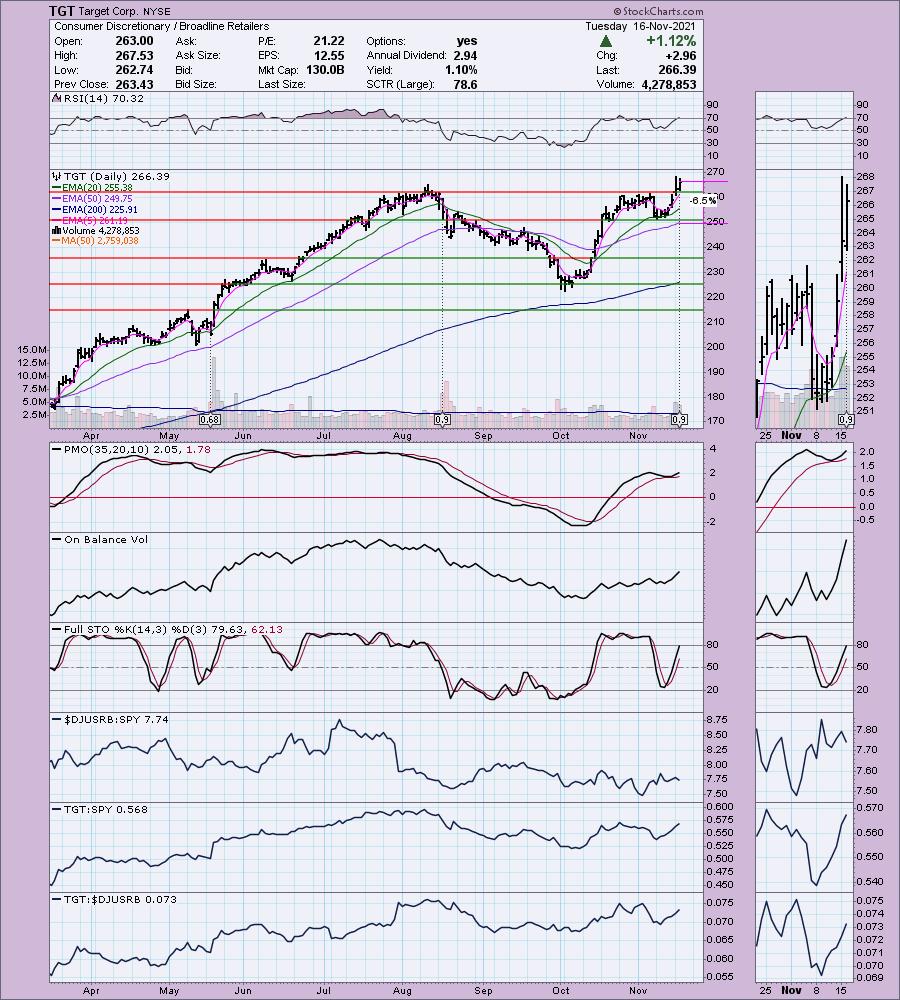
Predefined Scans Triggered: Moved Above Upper Keltner Channel and P&F Double Top Breakout.
TGT is up +0.89% in after hours trading going into earnings tomorrow. It is poised to do very well given the recent breakout. I'm not fond of the overbought RSI, but given that the RSI was overbought almost all of June and July, I'm okay with it. Additionally, we have a PMO bottom above the signal line with the PMO not overbought. Stochastics are rising strongly and it is a strong relative performer against the group and the SPY. The stop can also be set tightly just below the 50-EMA.
I covered TGT twice before on July 29th 2020 and September 29th 2020. Neither stop has been hit so the first position is up +116.1% and the second is up +69.7%. Full disclosure: I own TGT.
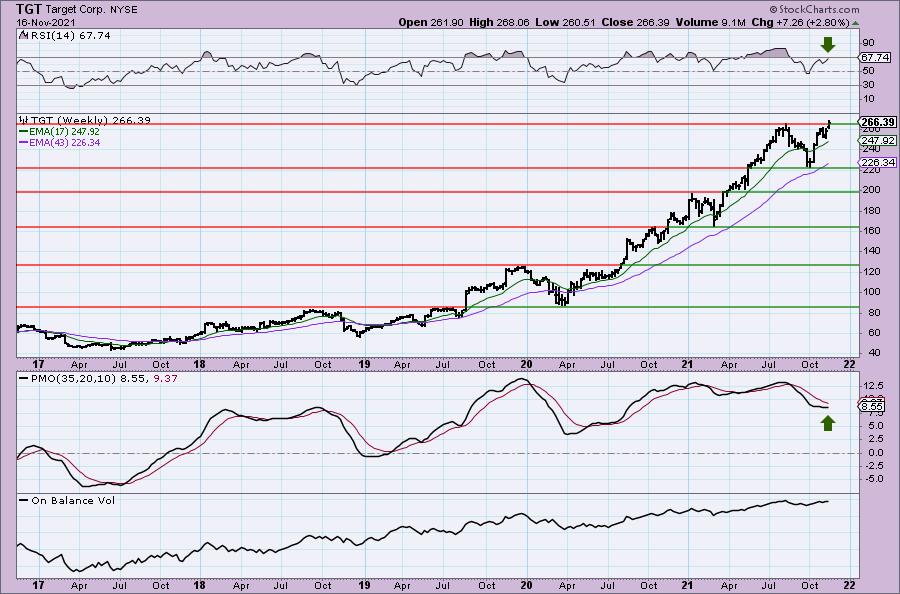
The weekly RSI is positive and not yet overbought and the weekly PMO is now rising again. This week TGT is breakout out to new all-time highs. I'd set a upside target around $311.68 for a 17% gain.
Don't forget, on Thursdays I look at reader-requested symbols, click HERE to shoot me an email. I read every email I receive and try to answer them all!
Current Market Outlook:
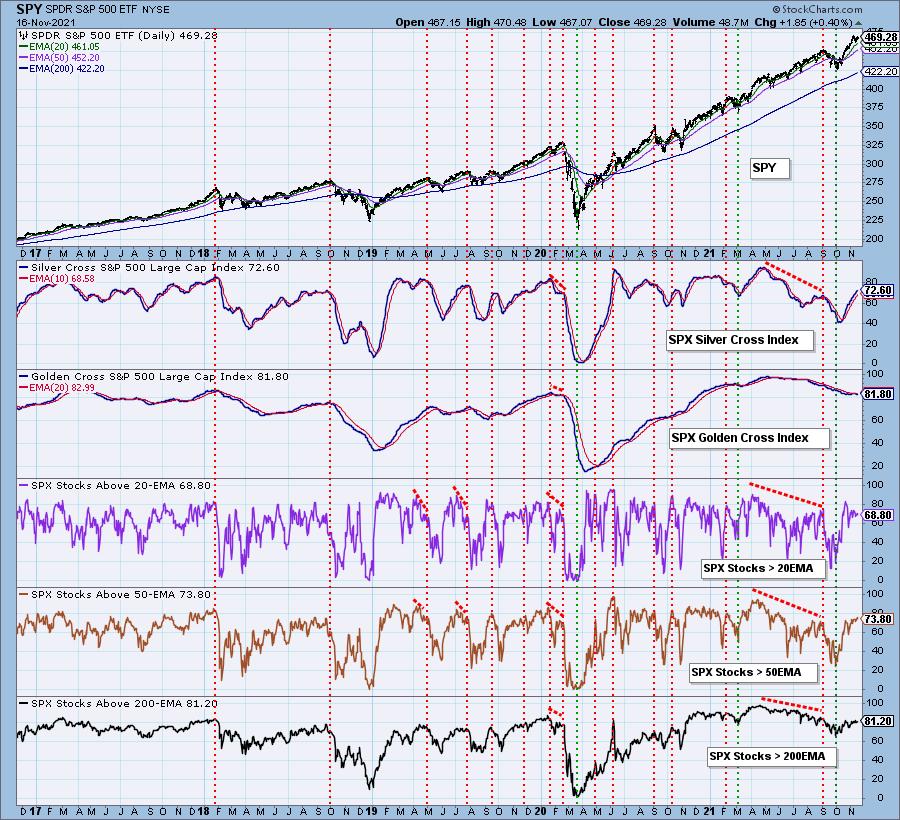
Market Environment: It is important to consider the odds for success by assessing the market tides. The following chart uses different methodologies for objectively showing the depth and trend of participation for intermediate- and long-term time frames.
- The Silver Cross Index (SCI) shows the percentage of SPX stocks on IT Trend Model BUY signals (20-EMA > 50-EMA)
- The Golden Cross Index (GCI) shows the percentage of SPX stocks on LT Trend Model BUY signals (50-EMA > 200-EMA)
- The Bullish Percent Index (BPI) shows the percentage of SPX stocks on Point & Figure BUY signals.
Don't forget that as a "Diamonds" member, you have access to our GCI/SCI curated ChartList on DecisionPoint.com. You'll find it under "Members Only" links on the left side on the Blogs and Links Page.
Here is the current chart:
Full Disclosure: I'm 75% invested and 25% is in 'cash', meaning in money markets and readily available to trade with. I own Target (TGT).
I'm required to disclose if I currently own a stock and/or may buy it within the next 72 hours.
Technical Analysis is a windsock, not a crystal ball.
Happy Charting!
- Erin
erin@decisionpoint.com
Watch the latest episode of DecisionPoint with Carl & Erin Swenlin on Mondays 7:00p EST or on the DecisionPoint playlist on the StockCharts TV YouTube channel here!
NOTE: The stocks reported herein are from mechanical trading model scans that are based upon moving average relationships, momentum and volume. DecisionPoint analysis is then applied to get five selections from the scans. The selections given should prompt readers to do a chart review using their own analysis process. This letter is not a call for a specific action to buy, sell or short any of the stocks provided. There are NO sure things or guaranteed returns on the daily selection of "Diamonds in the Rough."
Helpful DecisionPoint Links:
DecisionPoint Shared ChartList and DecisionPoint Chart Gallery
Price Momentum Oscillator (PMO)
Swenlin Trading Oscillators (STO-B and STO-V)
For more links, go to DecisionPoint.comT