
Over the past week or two I have been discussing how my scans are producing fewer and fewer results. The "Diamond PMO Scan" returned ZERO results today. How often does this happen? Well, I don't have the actual numbers, but I can say the last time I remember was in May of this year. This scan typically returns about 20 stocks/ETFs a day.
Another indication that the market is in trouble would be the large amount of Bond funds that have dominated scan results for the past week or so. Of 32 scan results from the "Momentum Sleepers" scan today, only four were stocks and the rest were some sort of bond ETF.
For now, "Diamonds in the Rough" should be considered 'watch list' material. I attempted to find some shorting opportunities, but too many of the stocks in the "Diamond Dog" scan results were near or at major support levels. Just know that I am keeping an eye out for those opportunities.
We did see a downside "exhaustion" climax today so a very short-term reversal is likely. I wouldn't count on any bounce lasting more than a day or two. If we're lucky enough to see one, that could offer us an opportunity to sell into strength.
Today's "Diamonds in the Rough": IMNM, MYMD and VAPO.

RECORDING LINK Wednesday (11/24):
Topic: DP Diamond Mine (WEDNESDAY 11/24/2021) LIVE Trading Room
Start Time: Nov 24, 2021 08:59 AM
Meeting Recording Link.
Access Passcode: Turkey@24
REGISTRATION FOR Friday 12/3 Diamond Mine:
When: Dec 3, 2021 09:00 AM Pacific Time (US and Canada)
Topic: DecisionPoint Diamond Mine (12/3/2021) LIVE Trading Room
Register in advance for this webinar HERE.
Save the registration confirmation email with login instructions in case Zoom doesn't notify you in time.

Free DP Trading Room (11/22) RECORDING LINK:
Topic: DecisionPoint Trading Room
Start Time: Nov 22, 2021 09:00 AM
Meeting Recording Link.
Access Passcode: November@22
For best results, copy and paste the access code to avoid typos.
Welcome to DecisionPoint Daily Diamonds, wherein I highlight five "Diamonds in the Rough." These are selected from the results of my DecisionPoint scans, which search for stocks that could benefit from the trend and condition of the market. Remember, these are not recommendations to buy or sell, but are the most interesting of the stocks that surfaced in my scans. My objective is to save you the work of the initial, tedious culling process, but you need to apply your own analysis to see if these stocks pique your interest as well. There are no guaranteed winners here!
Immunome Inc. (IMNM)
EARNINGS: 3/24/2022 (AMC)
Immunome, Inc. is a biopharmaceutical company, which engages in the discovery and development of antibody therapeutics products. It focuses on oncology and infectious disease areas. It utilizes the proprietary human memory B cell platform to enable the discovery of novel antibodies in both these therapeutic areas because of the interrogation of memory B cells from patients who have learned to fight off these diseases. The company was founded by Scott K. Dessain and Gregory P. Licholai on March 2, 2006 and is headquartered in Exton, PA.
Predefined Scans Triggered: Bullish MACD Crossovers, P&F Double Top Breakout, P&F Bearish Signal Reversal and Hanging Man.
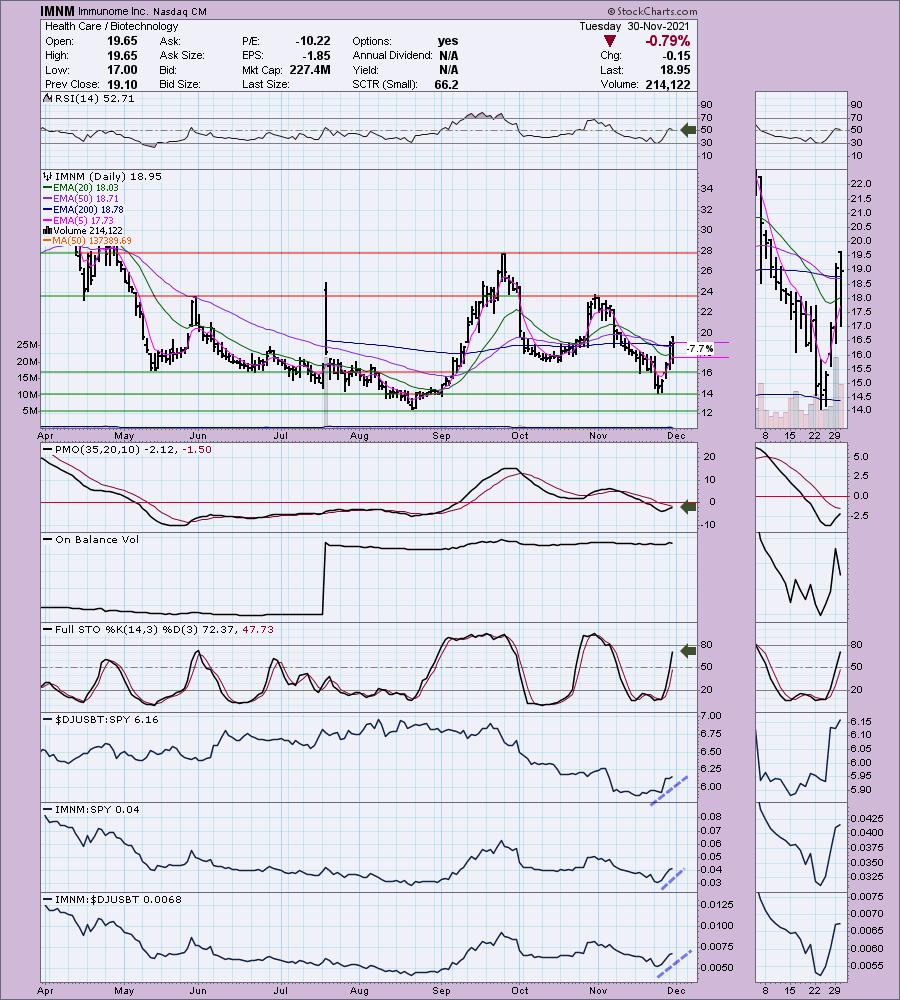
IMNM is unchanged in after hours trading. I hesitated to include a Biotech company given they tend to be somewhat speculative in nature, but as noted in the opening, pickings are slim. The volume pattern isn't helpful given the July spike which threw the OBV off kilter. However, the other indicators are helpful. The RSI is falling, but remains in positive territory above net neutral (50). The PMO is rising and nearing an oversold crossover BUY signal. Stochastics are very strong. Relative strength studies tell us this is a good group to be in right now and IMNM is one of the outperforming stocks. The stop was difficult to determine. I opted to put it below the 20-EMA at a 7.7% level.
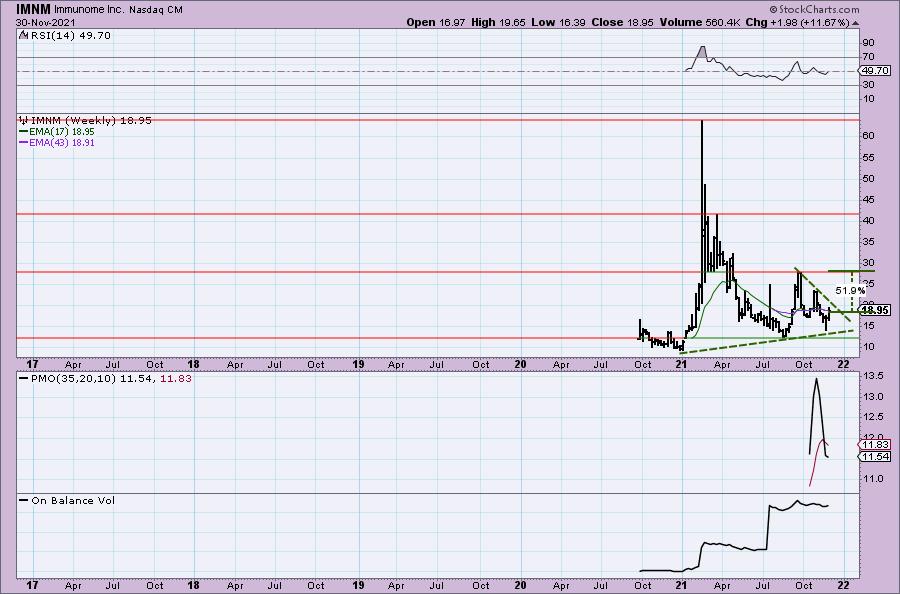
Not much on the weekly chart. The weekly RSI is moving positive. The weekly PMO while still in decline is at least showing some deceleration. If it can return to the August high that would be a tidy 52% profit. You'll probably have to endure a lot of volatility to get there though.
MyMD Pharmaceuticals, Inc. (MYMD)
EARNINGS: 3/1/2022 (BMO)
MyMD Pharmaceuticals, Inc. is a clinical-stage pharmaceutical company, which engages in the development of drug products targeting aging and age-related, and autoimmune diseases; chronic pain, anxiety, and sleep disorders. It focuses on developing and commercializing MyMD-1 and SUPERA-CBD therapeutic platforms. MyMD-1 is a clinical stage small molecule that regulates the immunometabolic system to treat autoimmune diseases. Supera-CBD is a synthetic derivative of cannabidiol being developed to treat condition such as epilepsy, pain, depression, as well as neuroinflammatory and neurodegenerative diseases. The company was founded in 1989 and is headquartered in Baltimore, MD.
Predefined Scans Triggered: None.
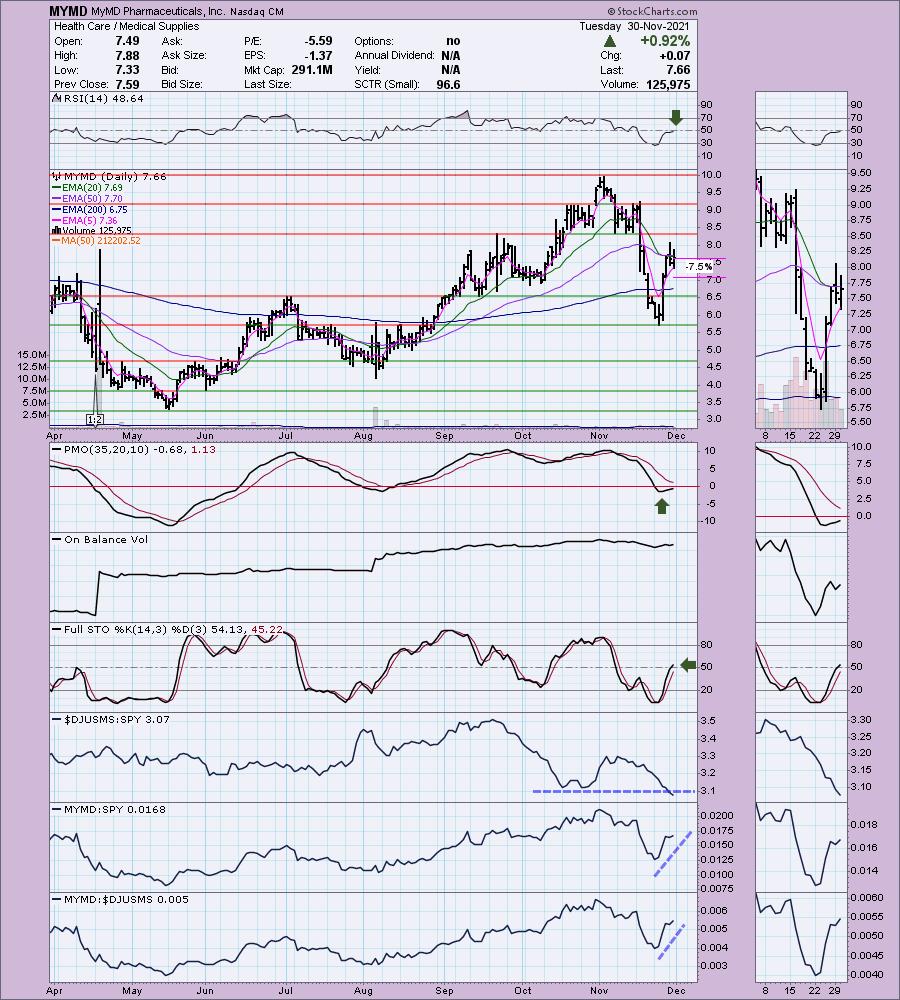
MYMD is unchanged in after hours trading. I note in the description of the company that is loosely affiliated with the cannabis industry. The Alternative Harvest ETF (MJ) is in a major declining trend. We also can see that this industry group has been suffering. The bright side is that the group is hitting relative lows and could reverse soon. MYMD is outperforming the group and the SPY. The weekly RSI is nearly in positive territory and the PMO is rising, albeit slowly. Stochastics have hit positive territory and continue to rise. This looks like a "V" bottom. We have almost 50% retracement from the low so the expectation is a breakout above the November top. The stop level is set somewhat arbitrarily at my comfort level of 7.5%. This is a low-priced stock with plenty of volatility so be careful.
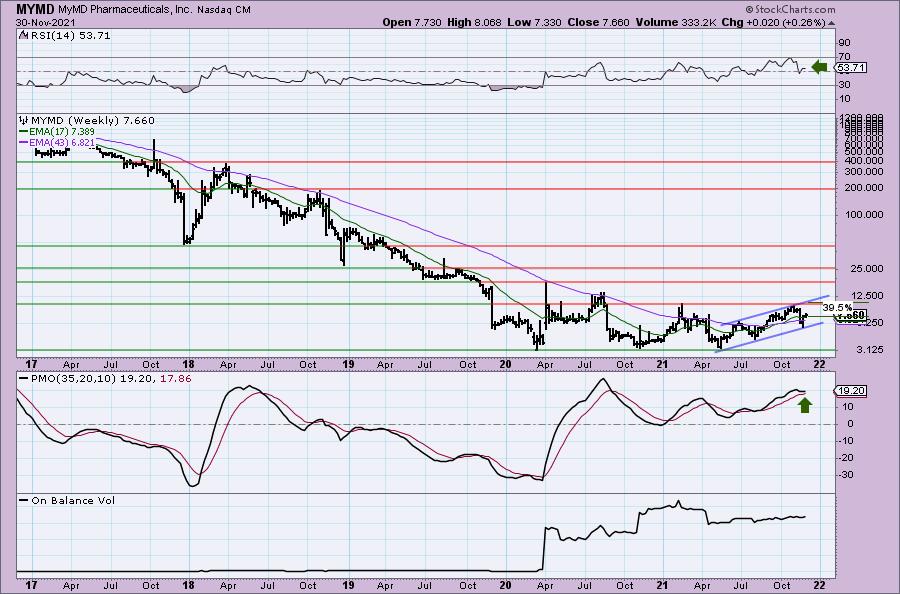
The weekly chart displays a solid rising trend channel and price has just bounced off the bottom. The weekly RSI is positive and the weekly PMO is turning back up above its signal line. This is a log scale chart. It was necessary given the ridiculously high trading range back in 2017. If MYMD can simply reach overhead resistance at the 2021 highs, that would be a nearly 40% gain.
Vapotherm Inc. (VAPO)
EARNINGS: 2/23/2022 (AMC)
Vapotherm, Inc. is a medical technology company, which engages in the development and commercialization of medical devices for patients suffering from respiratory distress. Its products include Precision Flow, Precision Flow Heliox, Oxygen Assist Module, Nitric Oxidie Disposable Patient Circuit, Tracheostomy Adapter, and Aerogen Adapter. The company was founded by William F. Niland, Jun Cortez, and William Cirksena in 1998 and is headquartered in Exeter, NH.
Predefined Scans Triggered: Elder Bar Turned Green, Bullish MACD Crossovers and Parabolic SAR Buy Signals.
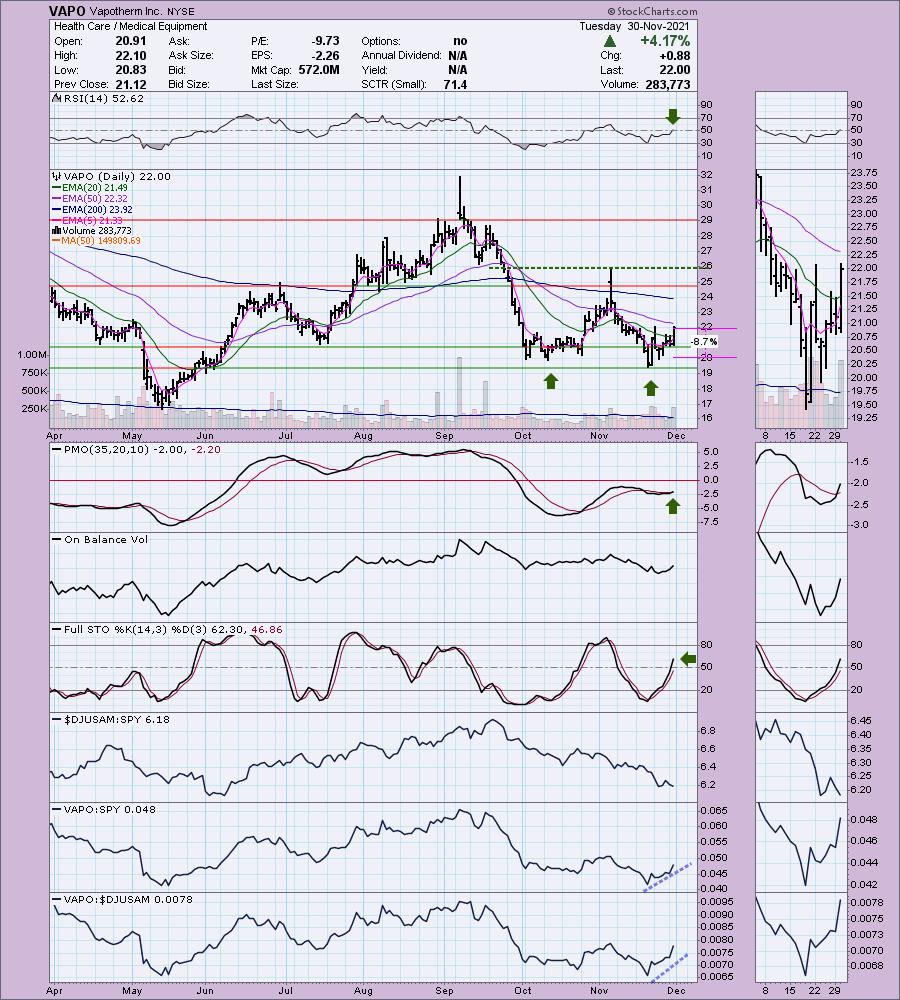
VAPO is unchanged in after hours trading. Looking at what this company does, it seems an excellent fit for today's COVID world. I like the double-bottom that is forming right now. Price closed above the 20-EMA for the first time since the decline out of the early November top. If the price does get over the confirmation line, the minimum upside target is around the September top. The RSI just hit positive territory and the PMO triggered a crossover BUY signal today. Stochastics are rising strongly and are now in positive territory. This industry group isn't fairing much better than Medical Supplies, but this group is also near relative lows against the SPY. This stock is outperforming both the group and SPY. The stop is set around $20 near the October lows.
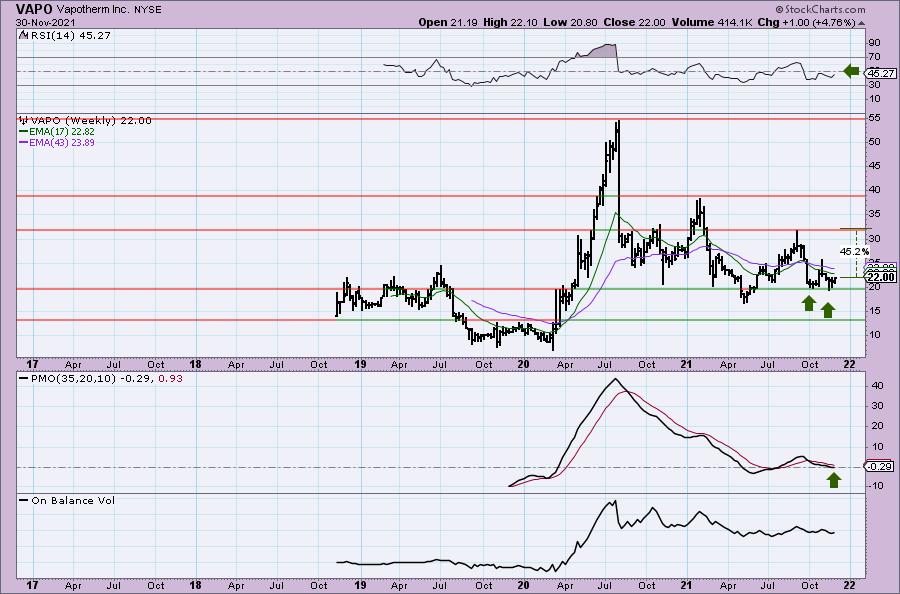
The double-bottom is visible on the weekly chart. Or, I should say "possible" double-bottom. It won't be a confirmed pattern until price gets above that November top. The weekly RSI is rising and the weekly PMO is flattening at the zero line. If price hits the minimum upside target of that possible double-bottom that would be a 45%+ gain.
Don't forget, on Thursdays I look at reader-requested symbols, click HERE to shoot me an email. I read every email I receive and try to answer them all!
Current Market Outlook:
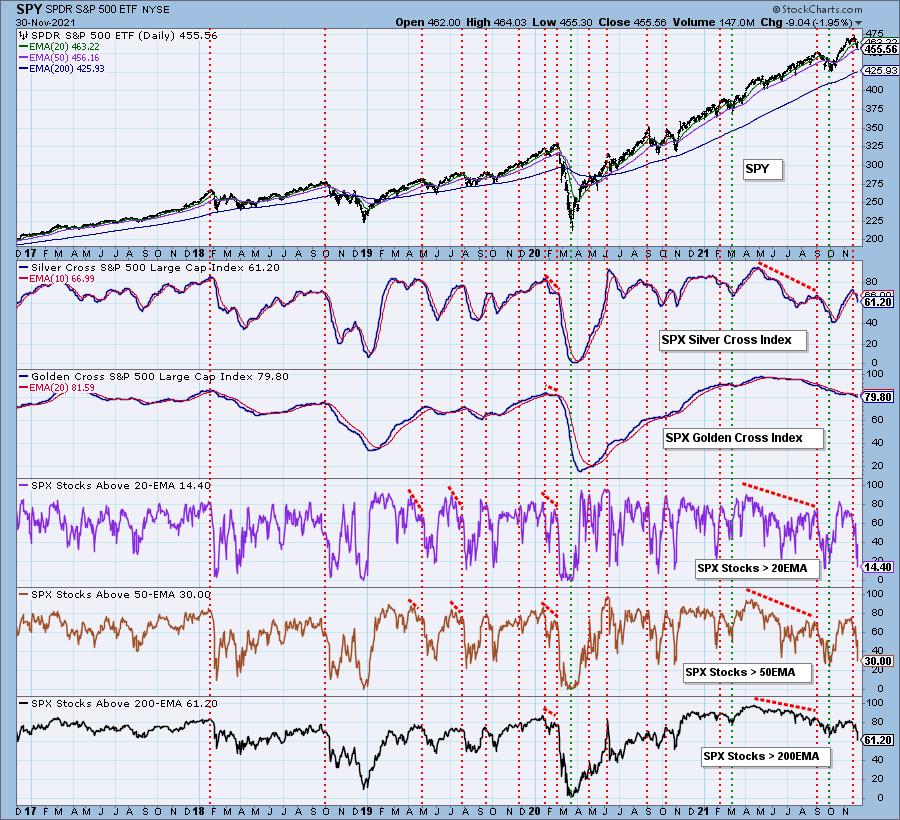
Market Environment: It is important to consider the odds for success by assessing the market tides. The following chart uses different methodologies for objectively showing the depth and trend of participation for intermediate- and long-term time frames.
- The Silver Cross Index (SCI) shows the percentage of SPX stocks on IT Trend Model BUY signals (20-EMA > 50-EMA)
- The Golden Cross Index (GCI) shows the percentage of SPX stocks on LT Trend Model BUY signals (50-EMA > 200-EMA)
- The Bullish Percent Index (BPI) shows the percentage of SPX stocks on Point & Figure BUY signals.
Don't forget that as a "Diamonds" member, you have access to our GCI/SCI curated ChartList on DecisionPoint.com. You'll find it under "Members Only" links on the left side on the Blogs and Links Page.
Here is the current chart:
Full Disclosure: I'm 20% invested and 80% is in 'cash', meaning in money markets and readily available to trade with.
I'm required to disclose if I currently own a stock and/or may buy it within the next 72 hours.
Technical Analysis is a windsock, not a crystal ball.
Happy Charting!
- Erin
erin@decisionpoint.com
Watch the latest episode of DecisionPoint with Carl & Erin Swenlin on Mondays 7:00p EST or on the DecisionPoint playlist on the StockCharts TV YouTube channel here!
NOTE: The stocks reported herein are from mechanical trading model scans that are based upon moving average relationships, momentum and volume. DecisionPoint analysis is then applied to get five selections from the scans. The selections given should prompt readers to do a chart review using their own analysis process. This letter is not a call for a specific action to buy, sell or short any of the stocks provided. There are NO sure things or guaranteed returns on the daily selection of "Diamonds in the Rough."
Helpful DecisionPoint Links:
DecisionPoint Shared ChartList and DecisionPoint Chart Gallery
Price Momentum Oscillator (PMO)
Swenlin Trading Oscillators (STO-B and STO-V)
For more links, go to DecisionPoint.com