
Gold Miners continue to outperform and the charts are only getting juicier. Yesterday I presented Newmont Mining (NEM). I listed another Gold Miner for you in the "Stocks to Review" section of the report. I contemplated including the charts, but it looks very much like NEM. The Gold Miner is Agnico Eagle Mines Ltd (AEM). Take a look and tell me what you think.
I gave you five "Diamonds in the Rough" yesterday and two of them definitely turned out to be coal not diamonds as their stops were triggered. The good news? It was quite obvious in the morning that these two stocks were "duds" based on the 5-minute candlestick that we use for entries and exits. BAK gapped down on the open with no "buy points" the rest of the day. MAPS also triggered its stop today, but the good news is that MAPS did offer a "buy point" which was near its lows for the day; however, I'm not a fan of MAPS daily chart, so tread carefully if you did give it try.
Today's selections offer two stalwart stocks that should see higher prices despite the current short-term decline given their "defensive" nature. Additionally, I have a Medical Equipment stock that appears poised to breakout.
Given the shaky market environment right now, give careful consideration to expanding your exposure. I had two positions close and I'm not planning on reinvesting those funds just yet.
Today's "Diamonds in the Rough": AWK, HSY and WAT.
"Stocks to Review": AVID, AEM, GILD and HOLX.

RECORDING LINK Friday (11/5):
Topic: DecisionPoint Diamond Mine (11/5/2021) LIVE Trading Room
Start Time: Nov 5, 2021 09:01 AM
Meeting Recording Link HERE.
Access Passcode: November#5
REGISTRATION FOR FRIDAY 11/12 Diamond Mine:
When: Nov 12, 2021 09:00 AM Pacific Time (US and Canada)
Topic: DecisionPoint Diamond Mine (11/12/2021) LIVE Trading Room
Register in advance for this webinar HERE.
Save the registration confirmation email with login instructions in case Zoom doesn't notify you in time.

Free DP Trading Room (11/1) RECORDING LINK:
Topic: DecisionPoint Trading Room
Start Time: Nov 1, 2021 09:00 AM
Meeting Recording LINK.
Access Passcode: November@1
For best results, copy and paste the access code to avoid typos.
Welcome to DecisionPoint Daily Diamonds, wherein I highlight five "Diamonds in the Rough." These are selected from the results of my DecisionPoint scans, which search for stocks that could benefit from the trend and condition of the market. Remember, these are not recommendations to buy or sell, but are the most interesting of the stocks that surfaced in my scans. My objective is to save you the work of the initial, tedious culling process, but you need to apply your own analysis to see if these stocks pique your interest as well. There are no guaranteed winners here!
American Water Works Co. Inc. (AWK)
EARNINGS: 2/23/2022 (AMC)
American Water Works Co., Inc. engages in the provision of complementary water and wastewater services. It operates through the following segments: Regulated Businesses; Market-Based Businesses; and Other. The Regulated Businesses segment provides water and wastewater services to customers. The Market-Based Businesses segment is responsible for Military Services Group, Contract Operations Group, Homeowner Services Group, and Keystone Operations. The Other segment includes corporate costs that are not allocated to the Company's operating segments, eliminations of inter-segment transactions, fair value adjustments and associated income and deductions related to the acquisitions that have not been allocated to the operating segments for evaluation of performance and allocation of resource purposes. The company was founded in 1886 and is headquartered in Camden, NJ.
Predefined Scans Triggered: Elder Bar Turned Green, P&F Bear Trap and Ichimoku Cloud Turned Red.
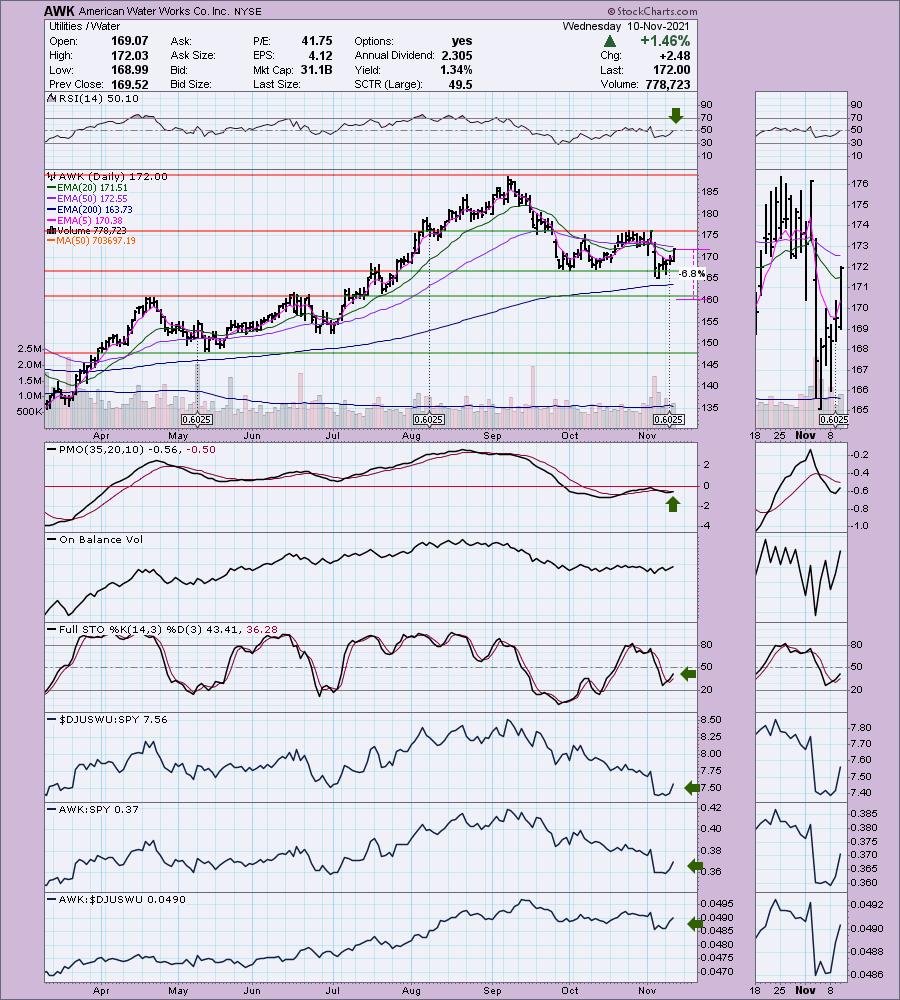
AWK is unchanged in after hours trading. I've covered this one three times as a "Diamond in the Rough". On May 26th 2020: Position hasn't hit its stop and is currently up 42.5%. On October 1st 2020 (reader request) and January 7th 2021 (reader request): Both positions were stopped out on the February waterfall decline.
I like this one on the pullback to the 200-EMA. It's beginning to perk up and given the unsteady market environment, this is a nice high yielding defensive stock. I'm not thrilled with the predefined scans that triggered given two of them are bearish, but my own scans and indicators rule here. The RSI just turned positive and the PMO has turned back up. Stochastics have reversed and relative strength is picking up for the group given the market decline of the last two days. AWK is top dog in this industry group. I like that I do not have to set a deep stop. It is set to $160 to account for support at the April/June highs.
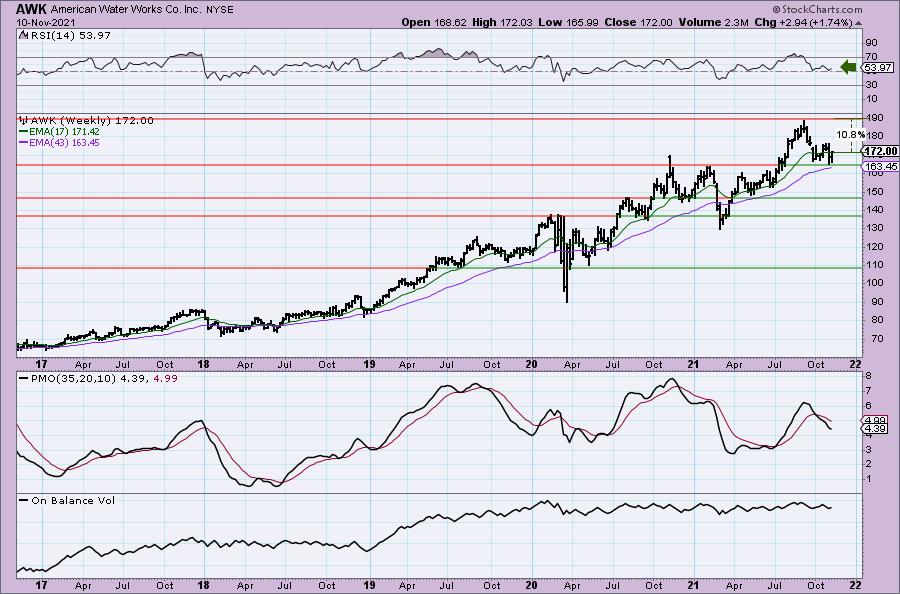
Price is bouncing off the 43-week EMA as well as the early 2021 top. The weekly RSI is positive and the PMO might be starting to decelerate. I would look for price to hit new all-time highs.
Hershey Foods Corp. (HSY)
EARNINGS: 2/3/2022 (BMO)
The Hershey Co. engages in the manufacture and market of chocolate and sugar confectionery products. The firm operates through the following geographical segments: North America; and International and Other. The North America segment is responsible for the traditional chocolate and non-chocolate confectionery market position of the company, as well as its grocery and snacks market positions, in the United States and Canada. The International and Other segment is the combination of all other operating segments which are not individually material, including those geographic regions where the company operates outside of North America. Its brands include Hershey's, Reese's, and Kisses. The company was founded by Milton S. Hershey in 1894 and is headquartered in Hershey, PA.
Predefined Scans Triggered: Elder Bar Turned Green and Parabolic SAR Buy Signals.
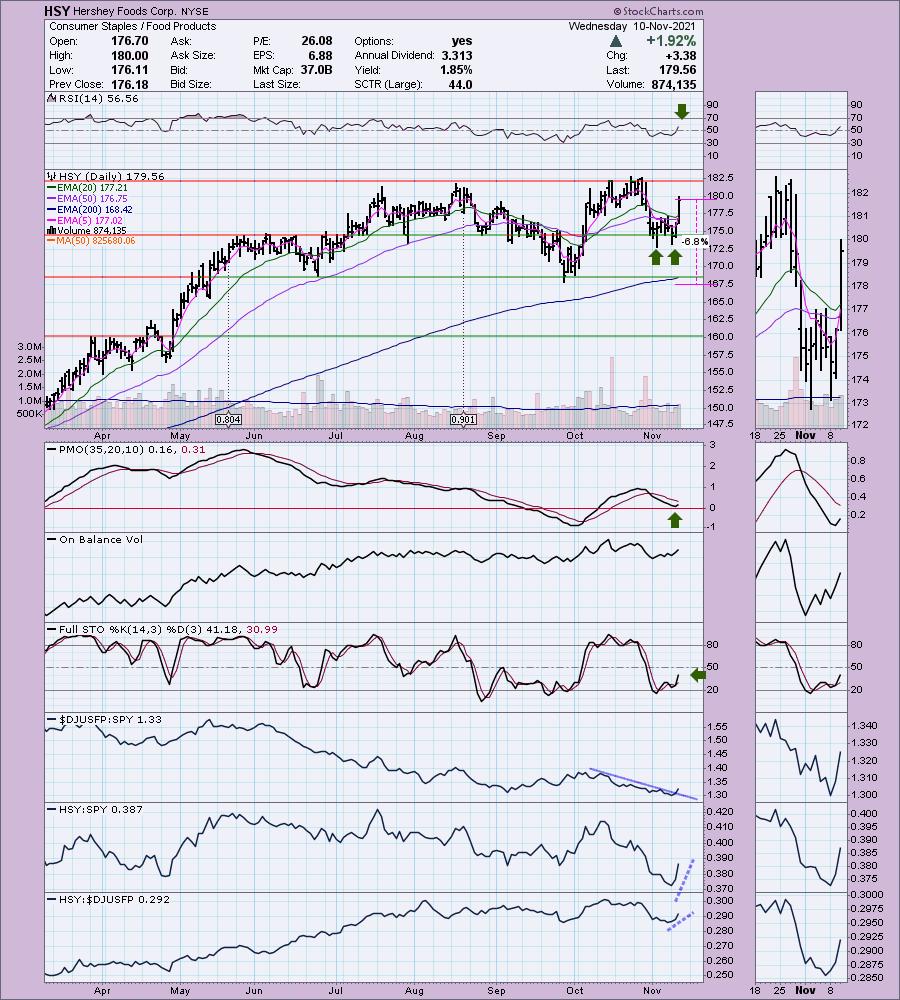
HSY is down -0.20% in after hours trading. HSY activated a short-term bullish double-bottom pattern. The RSI has just entered positive territory and the PMO has turned up. Stochastics are rising out of oversold territory. The group is breaking a declining trend in relative strength and HSY is performing slightly better than the group and now better than the SPY. The stop is set below the September low and is still manageable at 6.8%.
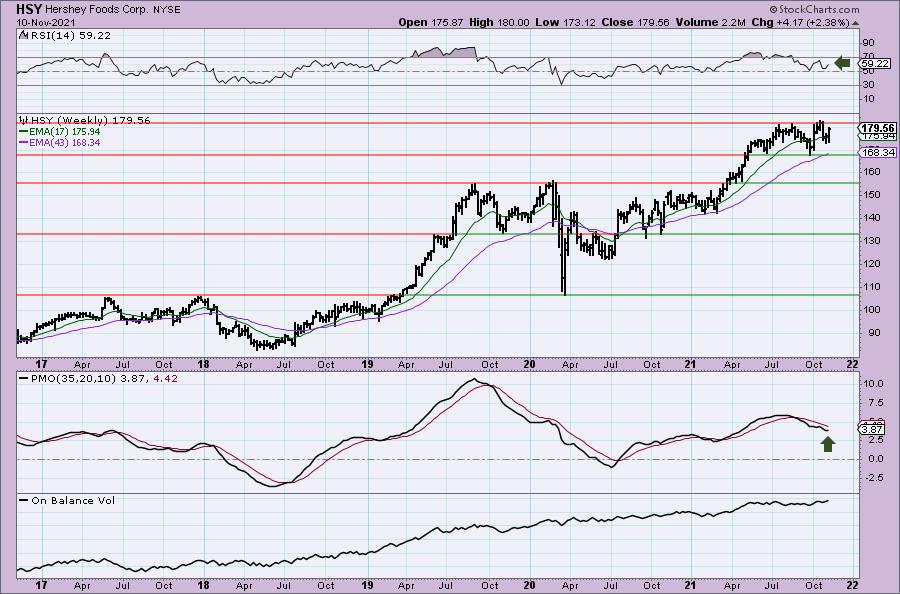
The weekly PMO is beginning to decelerate and the weekly RSI is positive. I would look for a breakout to new all-time highs with a possible upside target around $206.50 which would be a gain of about 15%.
Waters Corp. (WAT)
EARNINGS: 2/1/2022 (BMO)
Waters Corp. is a specialty measurement company which engages in analytical workflow solutions involving liquid chromatography, mass spectrometry and thermal analysis innovations. It operates through the Waters and TA segments. The Waters segment consists of liquid chromatography instruments, mass spectrometry, and precision chemistry consumable products and related services. The TA segment products and services include thermal analysis, rheometry and calorimetry instrument systems, and service sales. The company was founded by James Logan Waters in 1958 and is headquartered in Milford, MA.
Predefined Scans Triggered: None.
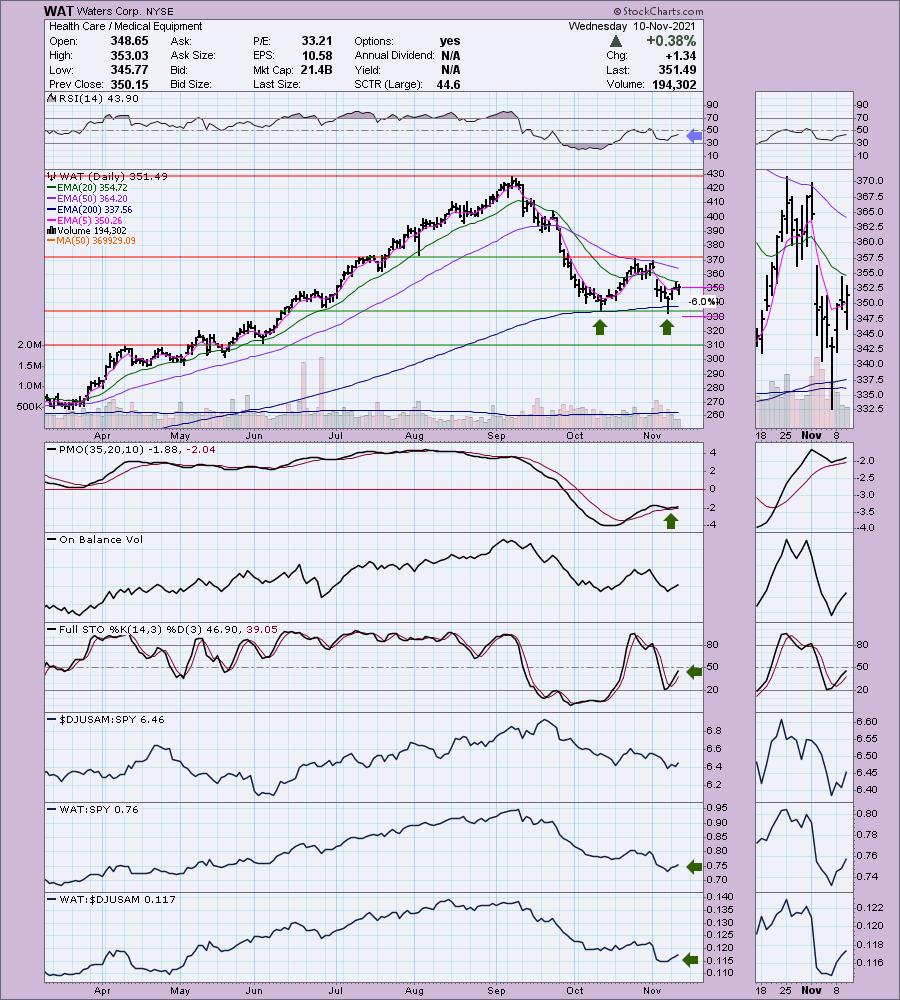
WAT is unchanged in after hours trading. This chart still needs to mature a bit but I think it is worth keeping on your radar. We could have a bullish double-bottom forming, but price would need to overcome resistance at the confirmation line (October top). That would require a break above both the 20/50-EMAs. The PMO has bottomed above its signal line and the RSI and Stochastics are rising, albeit not in positive territory yet. Relative strength is starting to perk up. The stop is thin at 6% lining it up below the two bottoms.
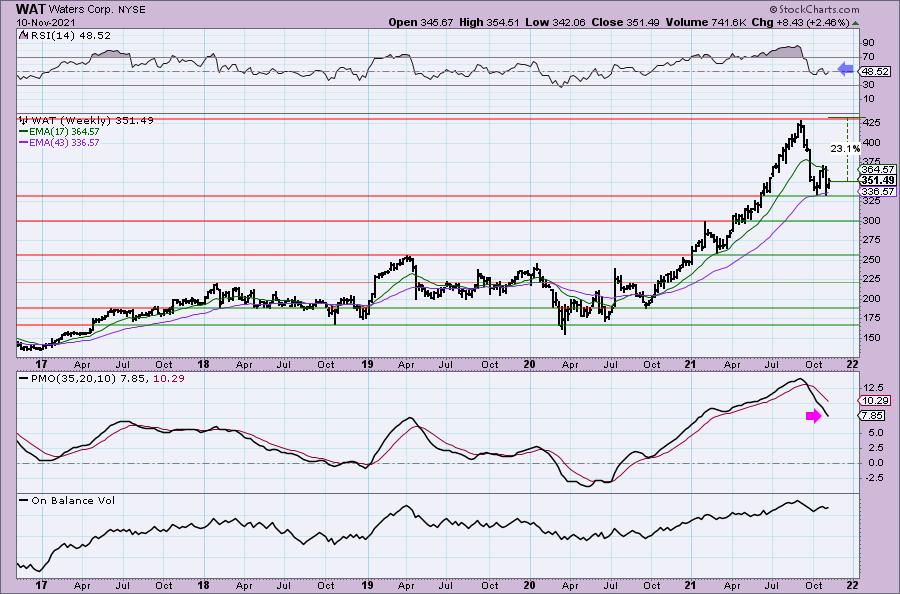
The weekly RSI isn't quite positive and the weekly PMO is ugly, but we do see price bouncing off the 43-week EMA. As I said, worth a watch.
Don't forget, on Thursdays I look at reader-requested symbols, click HERE to shoot me an email. I read every email I receive and try to answer them all!
Current Market Outlook:
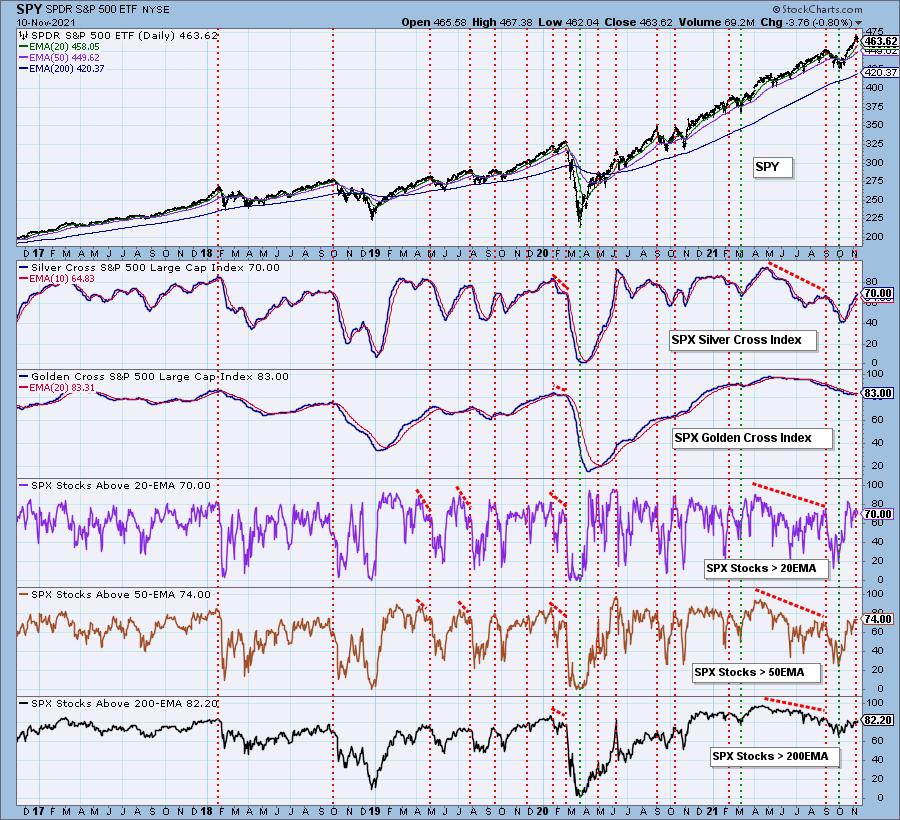
Market Environment: It is important to consider the odds for success by assessing the market tides. The following chart uses different methodologies for objectively showing the depth and trend of participation for intermediate- and long-term time frames.
- The Silver Cross Index (SCI) shows the percentage of SPX stocks on IT Trend Model BUY signals (20-EMA > 50-EMA)
- The Golden Cross Index (GCI) shows the percentage of SPX stocks on LT Trend Model BUY signals (50-EMA > 200-EMA)
- The Bullish Percent Index (BPI) shows the percentage of SPX stocks on Point & Figure BUY signals.
Don't forget that as a "Diamonds" member, you have access to our GCI/SCI curated ChartList on DecisionPoint.com. You'll find it under "Members Only" links on the left side on the Blogs and Links Page.
Here is the current chart:
Full Disclosure: I'm 75% invested and 25% is in 'cash', meaning in money markets and readily available to trade with.
I'm required to disclose if I currently own a stock and/or may buy it within the next 72 hours.
Technical Analysis is a windsock, not a crystal ball.
Happy Charting!
- Erin
erin@decisionpoint.com
Watch the latest episode of DecisionPoint with Carl & Erin Swenlin on Mondays 7:00p EST or on the DecisionPoint playlist on the StockCharts TV YouTube channel here!
NOTE: The stocks reported herein are from mechanical trading model scans that are based upon moving average relationships, momentum and volume. DecisionPoint analysis is then applied to get five selections from the scans. The selections given should prompt readers to do a chart review using their own analysis process. This letter is not a call for a specific action to buy, sell or short any of the stocks provided. There are NO sure things or guaranteed returns on the daily selection of "Diamonds in the Rough."
Helpful DecisionPoint Links:
DecisionPoint Shared ChartList and DecisionPoint Chart Gallery
Price Momentum Oscillator (PMO)
Swenlin Trading Oscillators (STO-B and STO-V)
For more links, go to DecisionPoint.com