
There were two major themes today within in my scan results. First and foremost was a plethora of Industrial stocks. It wasn't just one or two industry groups within the sector, it was throughout. I have picked four from this sector, each in a different industry group. I also included a Materials stock that has a very bullish setup.
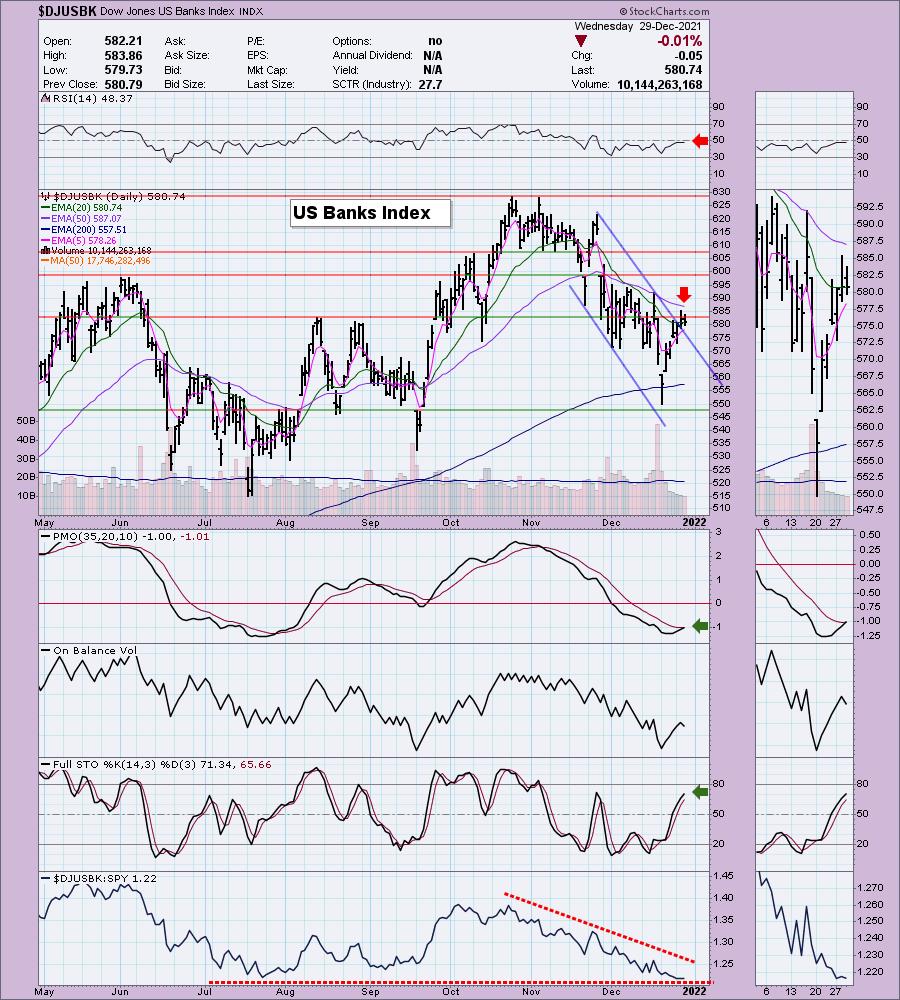
The second theme was the industry group of Banks. I found it interesting because if you look at the industry group relative performance, it's drifting lower. There's no denying improvements are being made on the chart with a new PMO crossover BUY signal, rising Stochastics and a breakout from a declining trend channel. However, problems remain. The RSI is negative and price hasn't overcome resistance at the 50-day EMA and August tops. I'm not saying this isn't a good industry group to invest in, I just don't think it is ripe and with the promise of a rough January in the market, I'm not ready to spotlight any bank stocks. However, here are a few I did like from the "Diamond PMO Scan": AX, CNOB, LOB, NBHC, SBSI, TBK and TSC.
Don't forget that this week's Diamond Mine trading will be held TOMORROW! Registration information is below. It's our final trading room of the year and I'm looking forward to drilling down to find themes and sectors and industry groups to watch. Bring your questions and symbol requests.
Today's "Diamonds in the Rough": AOS, CWST, KRNT, PACK and SHW.
"Stocks to Review": LSCC, MAS, WTS, REMX, DKS and GSL.

RECORDING LINK Friday (12/23):
Topic: DecisionPoint Diamond Mine (THURSDAY, 12/23/2021) LIVE Trading Room
Start Time: Dec 23, 2021 09:00 AM
MeetingRecording Link.
Access Passcode: Christmas@25
REGISTRATION FOR Thursday 12/30 Diamond Mine:
When: Dec 30, 2021 09:00 AM Pacific Time (US and Canada)
Topic: DecisionPoint Diamond Mine THURSDAY (12/30/2021) LIVE Trading Room
Register in advance for this webinar HERE.
Save the registration confirmation email with login instructions in case Zoom doesn't notify you in time.

Free DP Trading Room (12/27) RECORDING LINK:
Topic: DecisionPoint Trading Room
Start Time: Dec 27, 2021 09:00 AM
Meeting Recording Link.
Access Passcode: Holiday@2
For best results, copy and paste the access code to avoid typos.
Welcome to DecisionPoint Daily Diamonds, wherein I highlight ten "Diamonds in the Rough" per week. These are selected from the results of my DecisionPoint scans, which search for stocks that could benefit from the trend and condition of the market. Remember, these are not recommendations to buy or sell, but are the most interesting of the stocks that surfaced in my scans. My objective is to save you the work of the initial, tedious culling process, but you need to apply your own analysis to see if these stocks pique your interest as well. There are no guaranteed winners here!
Smith AO Corp. (AOS)
EARNINGS: 1/27/2022 (BMO)
A. O. Smith Corp. manufactures residential and commercial gas and electric water heaters, boilers, tanks and water treatment products. It operates through the following two segments: North America and Rest of World. The North America segment manufactures and markets comprehensive lines of residential and commercial gas and electric water heaters, boilers, tanks. The Rest of World segment comprises of China, Europe, and India; and manufactures and markets water treatment products. The company was founded by Charles Jeremiah Smith in 1874 and is headquartered in Milwaukee, WI.
Predefined Scans Triggered: New 52-week Highs and P&F Double top Breakout.
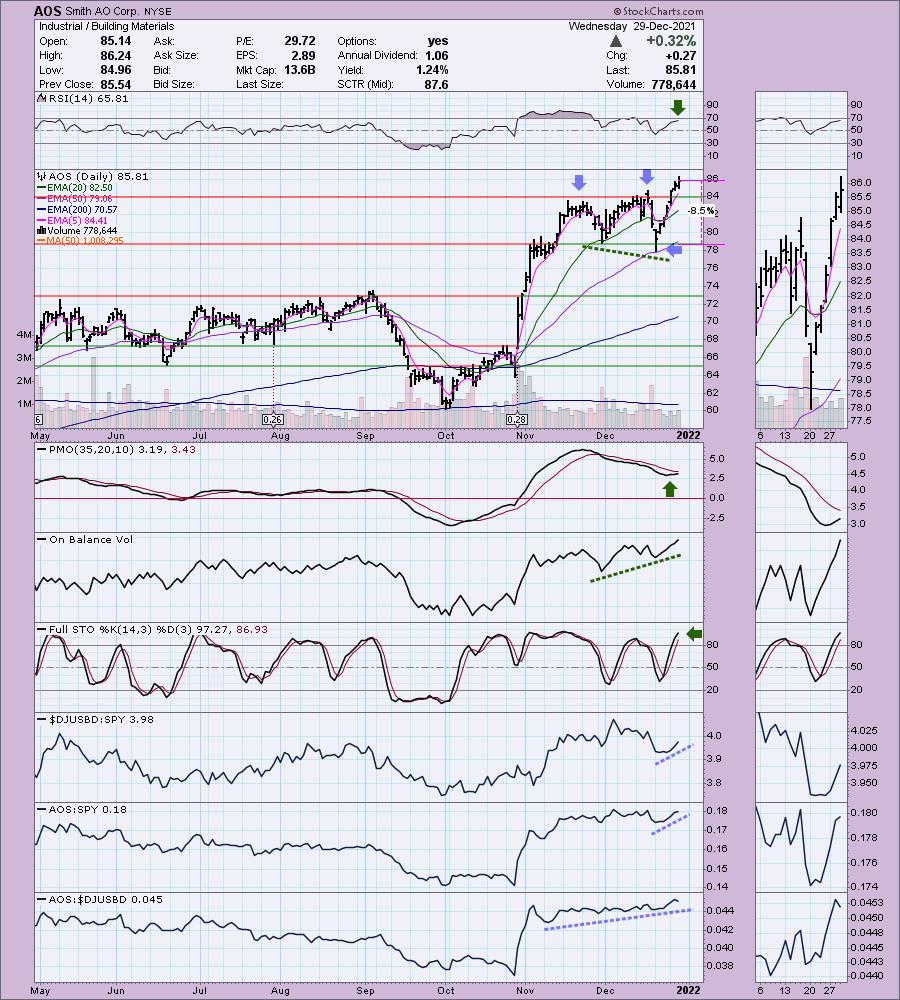
AOS is unchanged in after hours trading. I covered AOS back on July 14th 2020. The stop was never hit so the position is currently up +71.9%. This week saw a breakout to new all-time highs. There was a bearish double-top pattern. Price fell beneath the confirmation line but then closed above it. The current rally has busted that bearish pattern which is especially bullish. Add to that price bounced off the 50-day EMA and you have a very bullish price pattern. There is a positive OBV divergence that led into this rally. The RSI is positive and not overbought. The PMO has bottomed and is headed for a crossover BUY signal. Stochastics are rising and are above 80. Relative strength is strong for both the group and AOS. The stop is set just beneath the November low.
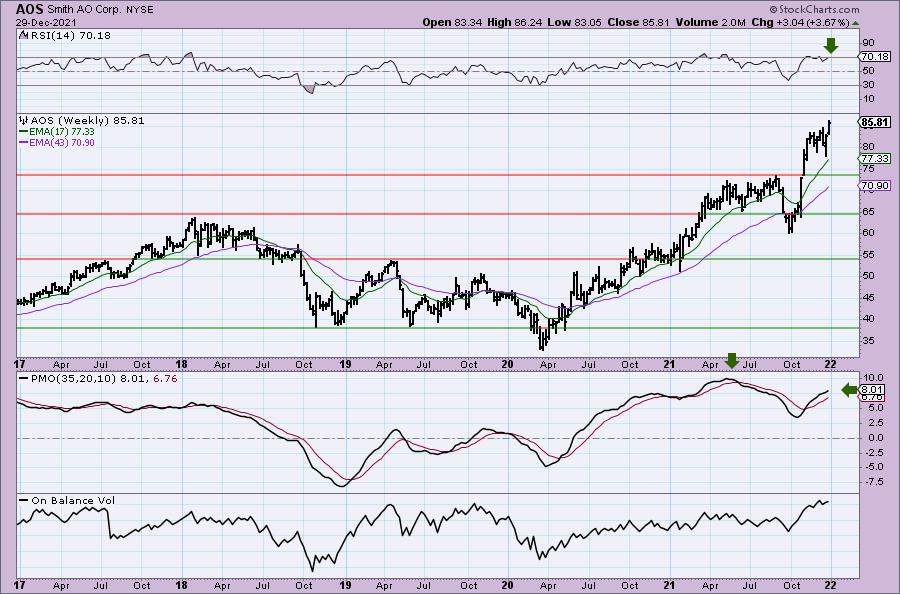
The weekly chart looks pretty good. The item I don't care for is the megaphone pattern. Megaphones are bearish. However, it is on a flagpole and could be considered a sloppy bull flag. The weekly PMO is rising and is not yet overbought. The weekly RSI is positive, albeit slightly overbought.
Casella Waste Systems, Inc. (CWST)
EARNINGS: 2/17/2022 (AMC)
Casella Waste Systems, Inc. engages in the provision of resource management and services to residential, commercial, municipal and industrial customers, in the areas of solid waste collection, transfer, disposal, recycling and organics services. It operates through the following segments: Eastern Region, Western Region, Recycling and Other segments. The Eastern region segment is vertically integrated, with transfer, landfill, processing and recycling assets serviced by collection operations. The Western region segment also consists of waste sheds in western New York, which includes Ithaca, Elmira, Oneonta, Lowville, Potsdam, Geneva, Auburn, Rochester, Dunkirk, Jamestown and Olean markets. The Recycling segment provides a full range of solid waste services and larger-scale recycling and commodity brokerage operations. The Other segment offers organic services, ancillary operations, major accounts and industrial services, discontinued operations and earnings from equity method investees. The company was founded in 1975 and is headquartered in Rutland, VT.
Predefined Scans Triggered: New CCI Buy Signals, Moved Above Ichimoku Cloud and P&F Double Top Breakout.
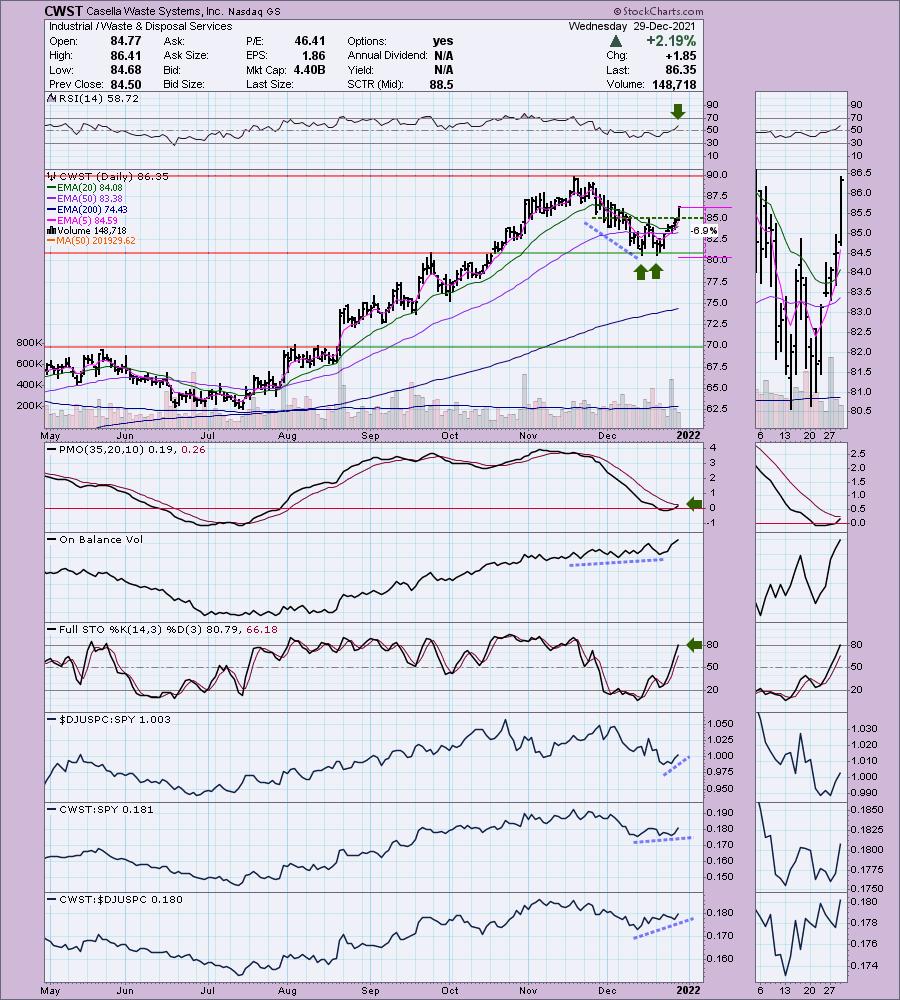
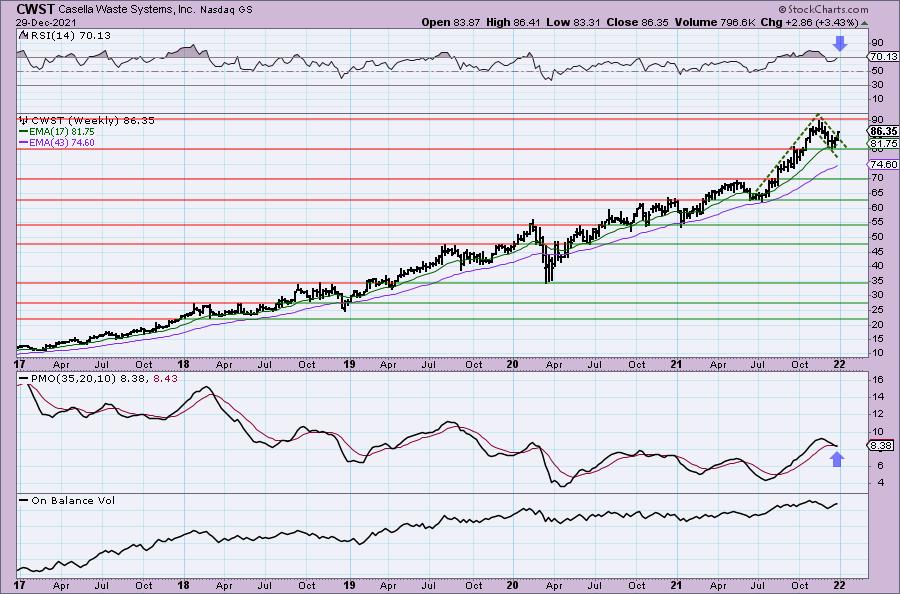
CWST is unchanged in after hours trading. I really like the price pattern that combines a breakout from a declining trend and a confirmation of a bullish double-bottom. The RSI is positive and the PMO is nearing a crossover BUY signal. Stochastics are rising and %D has just reached above 80. There is a strong positive divergence with the OBV. I like the relative strength the group is showing and CWST has a leadership role within the group given its rising relative strength line. The stop can be set below the double-bottom at 6.9%.
There is a nice bull flag on the chart and this week's OHLC bar shows a breakout that is beginning to confirm the pattern. The RSI is positive although slightly overbought. The weekly PMO just triggered a crossover SELL signal, but it is already flattening and could whipsaw back into a BUY signal. It's near all-time highs so consider setting an upside target of 14% (double the stop level) at $98.44.
Kornit Digital Ltd (KRNT)
EARNINGS: 2/15/2022 (BMO)
Kornit Digital Ltd. engages in the development, manufacture, and marketing of industrial and commercial printing solutions for the garment, apparel and textile industries. It offers printing solutions for apparel, polyester, sportswear, beachwear, accessories, paradigm shirt, textiles, curtains, cushions and couches. The company was founded by Ofer Ben-Zur on January 16, 2002 and is headquartered in Rosh HaAyin, Israel.
Predefined Scans Triggered: Moved Below Ichimoku Cloud and P&F Low Pole.
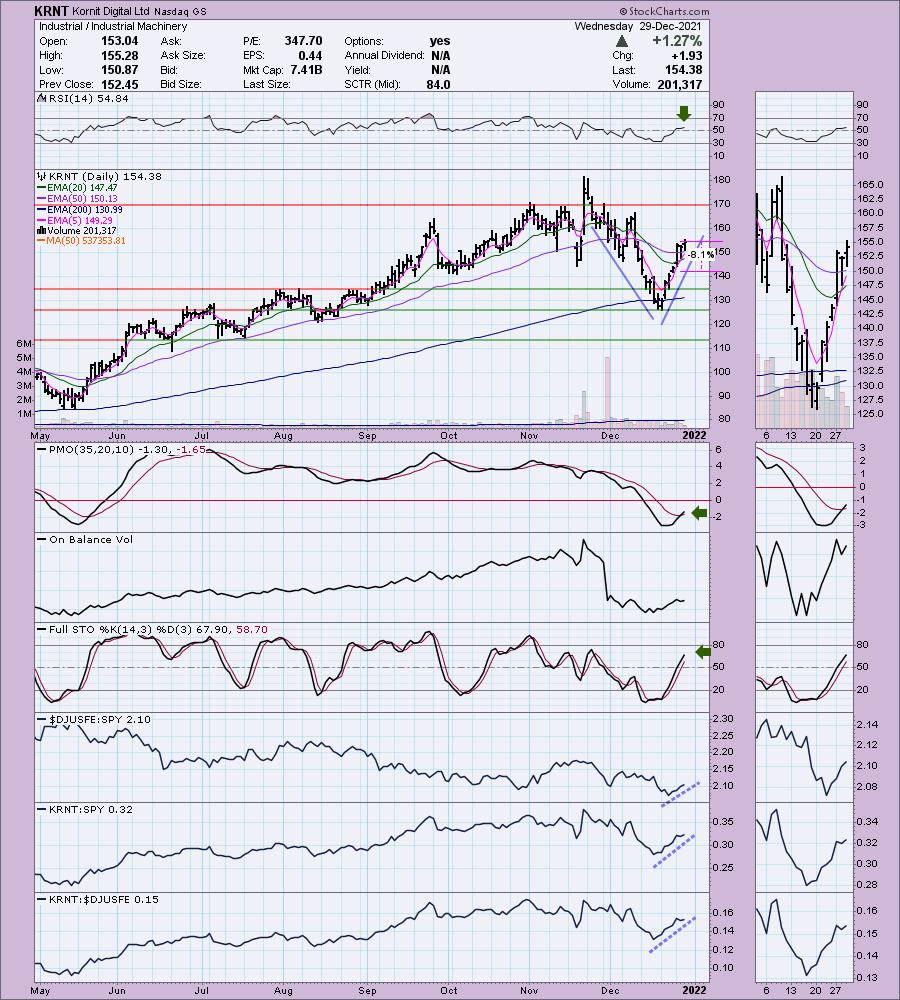
KRNT is unchanged in after hours trading. There is a bullish "V" bottom price pattern that as retraced about half of the prior decline. The pattern is confirmed when it retraces 1/3 of the prior decline so the expectation is higher prices. The RSI is positive and the PMO just triggered a crossover BUY signal. Stochastics are rising and positive. Relative strength studies are very positive for both the group and KRNT. The stop is set below the November bottom.
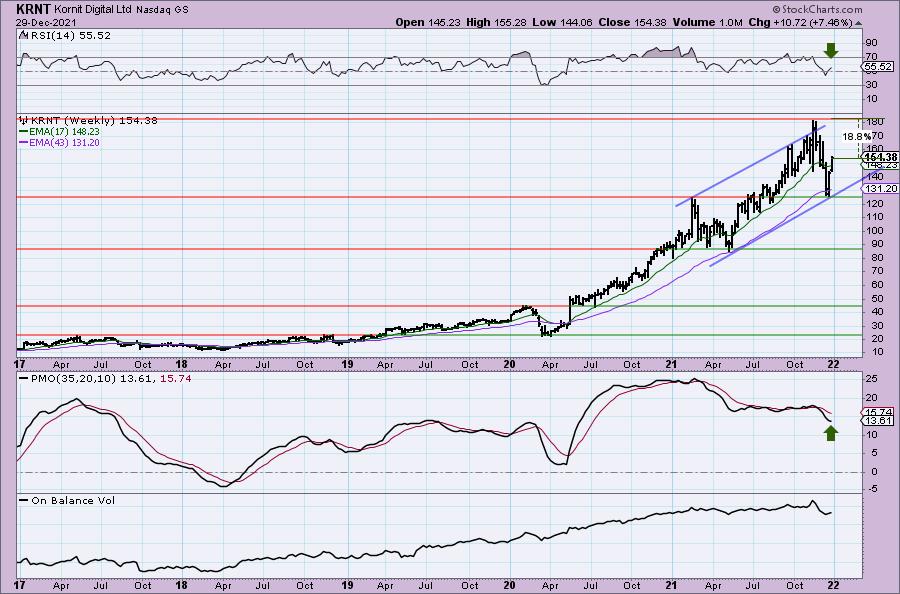
KRNT is traveling within a wide rising trend channel. It bounced off the bottom of the channel last week so there should be plenty more upside to go. The weekly RSI is positive and the weekly PMO is decelerating. Upside target is a cool 18.8%.
Ranpak Holdings Corp. (PACK)
EARNINGS: 3/1/2022 (BMO)
Ranpak Holdings Corp.engages in the provision of product protection solutions for e-commerce and industrial supply chains in North America, Europe, and Asia. It also offers protective packaging solutions, such as Void-Fill protective systems that convert paper to fill empty spaces in secondary packages and protect objects; Cushioning protective systems, which convert paper into cushioning pads; and Wrapping protective systems that create pads or paper mesh to wrap and protect fragile items, as well as to line boxes and provide separation when shipping various objects; Cold Chain, Box Lining, and Retail. The company was founded in 1972 and is headquartered in Concord Township, OH.
Predefined Scans Triggered: P&F Low Pole.
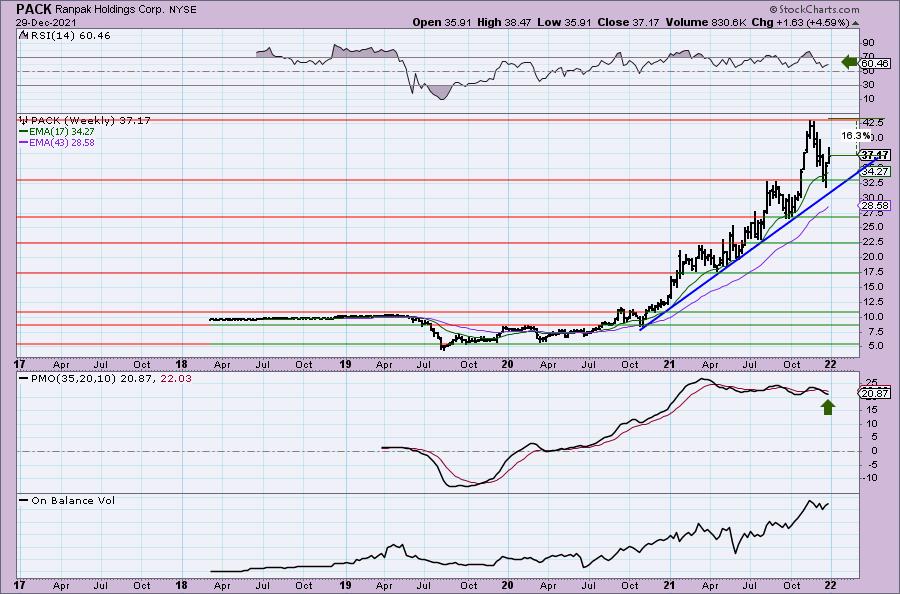
PACK is unchanged in after hours trading. It has broken out of a declining trend channel and is now pausing on top of the 20/50-day EMAs. A ST Trend Model BUY signal was triggered as the 5-day EMA crossed above the 20-day EMA. The RSI is positive and the PMO is rising toward a crossover BUY signal. Stochastics are rising strongly and nearing 80. Relative strength for the group has been consistently strong with performance increasing. PACK is outperforming the group and the SPY. The stop is set midway between the 50-day EMA and the August/September tops. You can make it thinner at the 50-day EMA or you can make it deep by setting it just below the August/September highs.
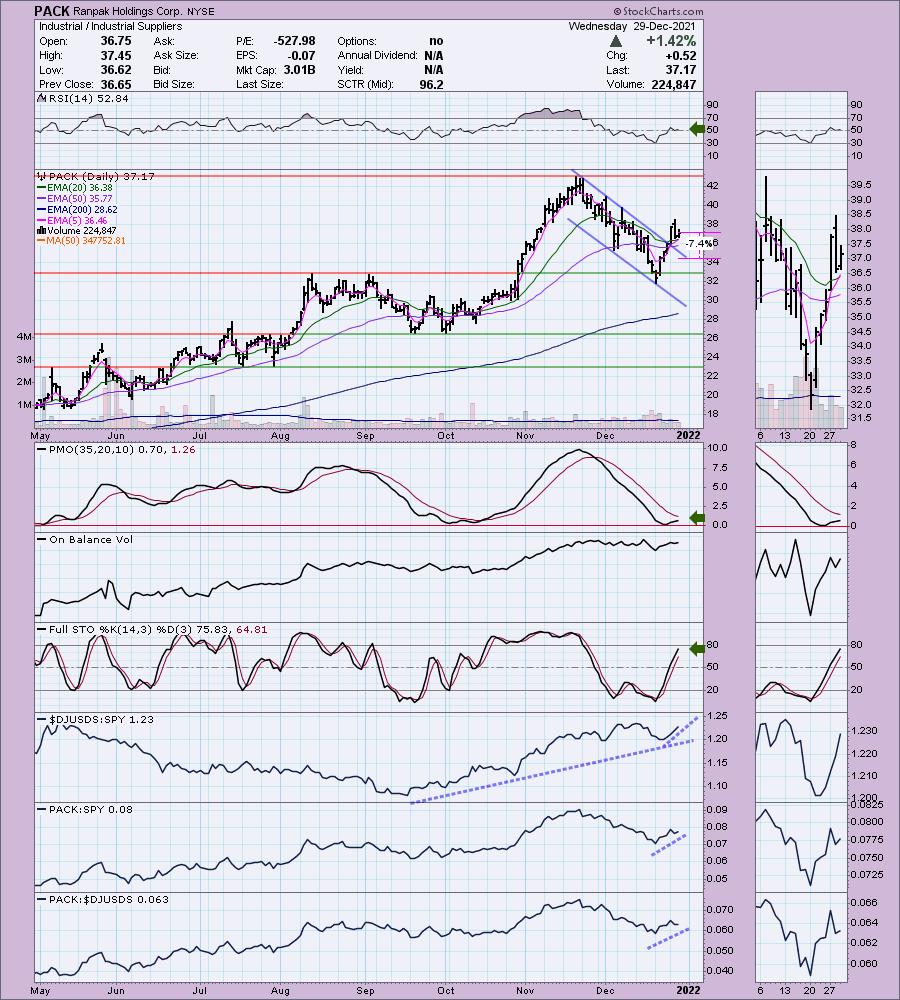
PACK is in a strong rising trend that began at the end of 2020. The weekly RSI is positive and the weekly PMO is beginning to bottom. Upside potential is just over 16%.
Sherwin Williams Co. (SHW)
EARNINGS: 1/27/2022 (BMO)
The Sherwin-Williams Co. engages in the manufacture and trade of paint and coatings. It operates through the following segments: America Group, Consumer Brands Group, and Performance Coating Group. The America Group segment manages the exclusive outlets for Sherwin-Williams branded paints, stains, supplies, equipment, and floor covering. The Consumer Brands Group segment sells portfolios of branded and private-label products through retailers in North America and in parts of Europe, Australia, New Zealand and China, and also operates global supply chain for paint and coatings. The Performance Coating Group segment offers coatings and finishes, and sells in industrial wood, protective and marine, coil, packaging, and automotive markets. The company was founded by Henry Sherwin and Edward Williams in 1866 and is headquartered in Cleveland, OH.
Predefined Scans Triggered: New 52-week Highs, Moved Above Upper Price Channel, P&F Ascending Triple Top Breakout and P&F Double Top Breakout.
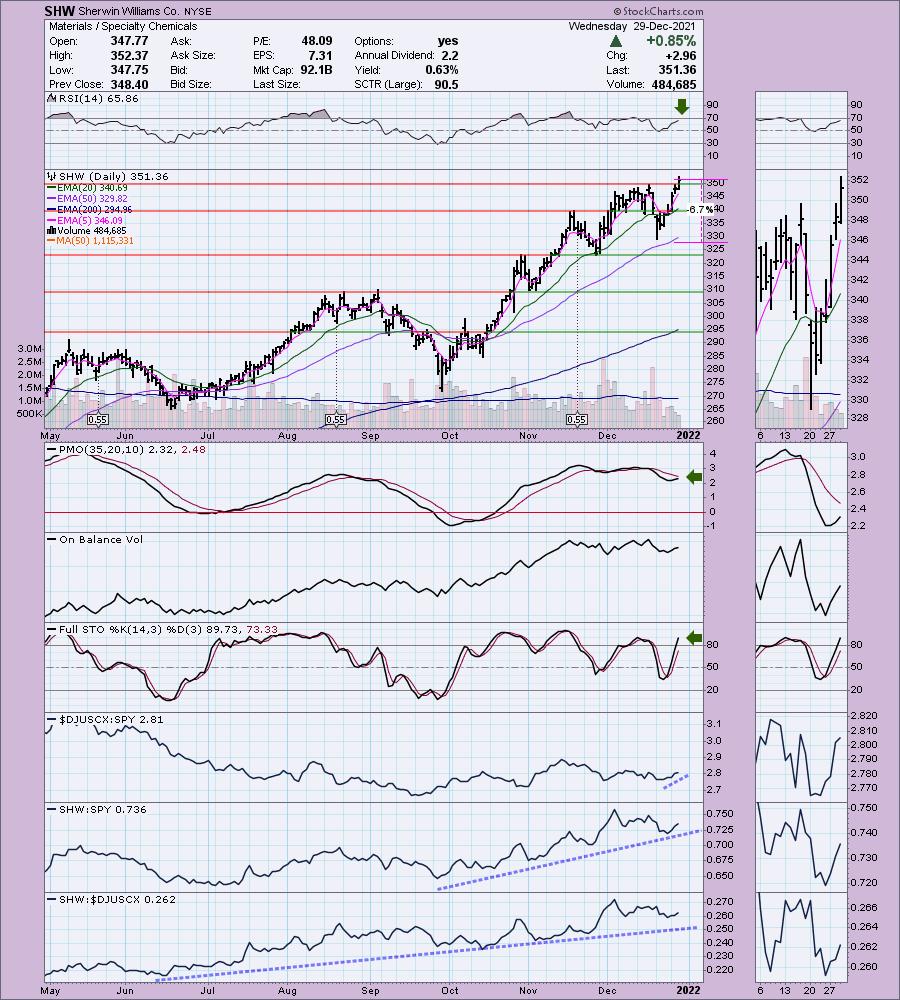
SHW is down -0.39% in after hours trading. I last covered SHW on November 3rd 2020. The position is still open and is currently up +48.4%. Today SHW broke to new all-time highs. The RSI dispositive and the PMO is rising toward a crossover BUY signal. Stochastics are rising and are above 80. Relative strength for the group is improving. SHW is a clear leader within the group and against the SPY. The stop can be set thinly at 6.7% just below the December low.
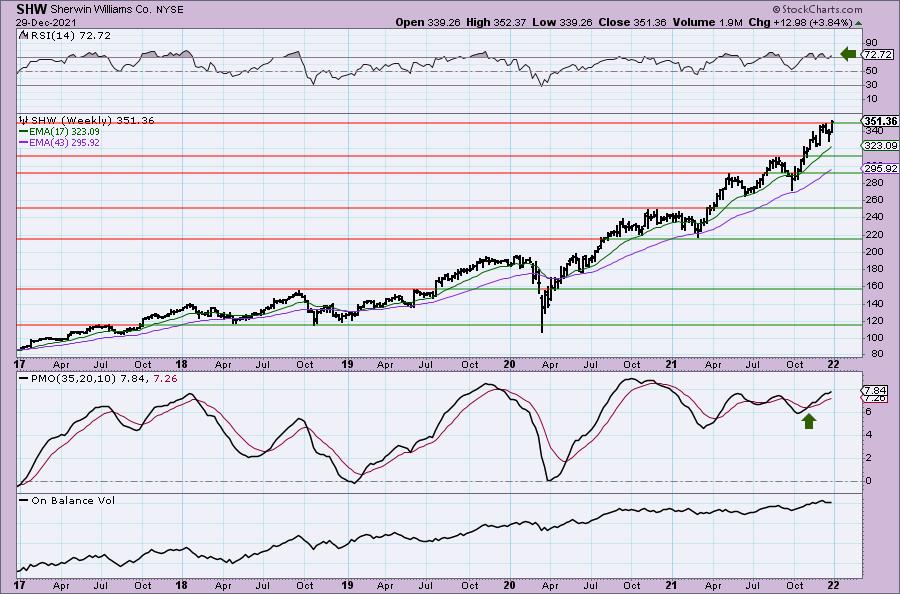
The weekly RSI is overbought, but the weekly PMO is not. The PMO is also on a BUY signal and is not yet overbought. Since SHW is at all-time highs and I believe the chart is very strong, I would set an upside target around 18% at $414.60.
Don't forget, on Thursdays I look at reader-requested symbols, click HERE to shoot me an email. I read every email I receive and try to answer them all!
Current Market Outlook:
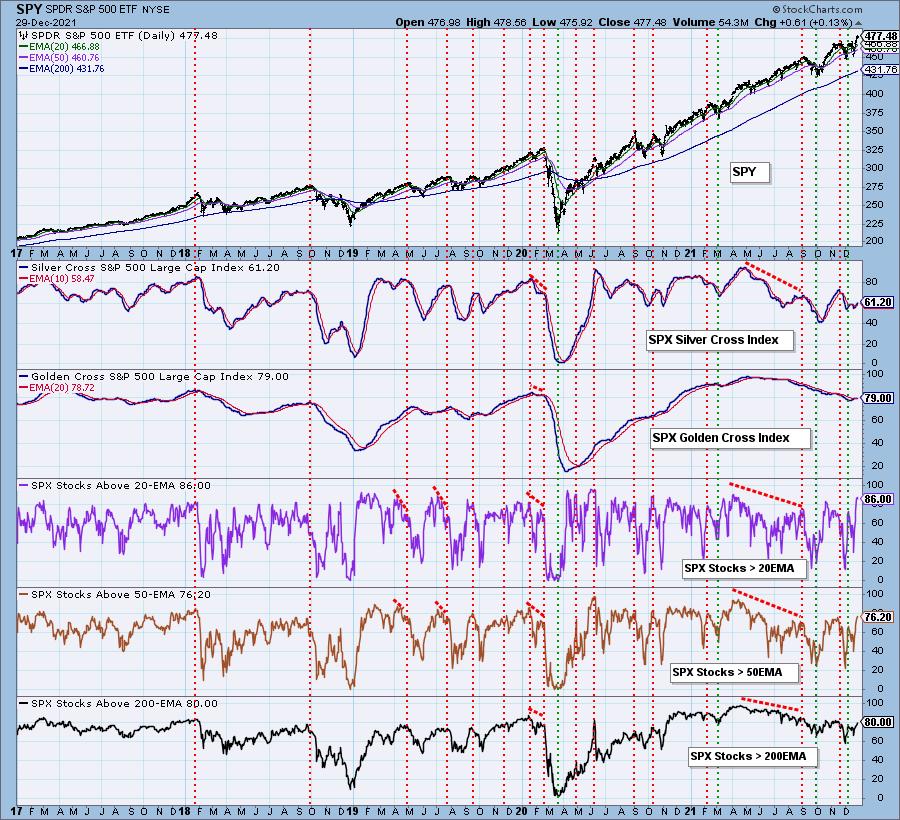
Market Environment: It is important to consider the odds for success by assessing the market tides. The following chart uses different methodologies for objectively showing the depth and trend of participation for intermediate- and long-term time frames.
- The Silver Cross Index (SCI) shows the percentage of SPX stocks on IT Trend Model BUY signals (20-EMA > 50-EMA)
- The Golden Cross Index (GCI) shows the percentage of SPX stocks on LT Trend Model BUY signals (50-EMA > 200-EMA)
Don't forget that as a "Diamonds" member, you have access to our GCI/SCI curated ChartList on DecisionPoint.com. You'll find it under "Members Only" links on the left side on the Blogs and Links Page.
Here is the current chart:
Full Disclosure: I'm 10% invested and 90% is in 'cash', meaning in money markets and readily available to trade with. ATR's 5-minute chart didn't look good when I got to it this morning and no real buy point arrived so I held off buying it. I'll be checking out this week's "Diamonds in the Rough" 5-minute charts before the Diamond Mine to see if I want to be a buyer.
I'm required to disclose if I currently own a stock and/or may buy it within the next 72 hours.
Happy Charting!
- Erin
erin@decisionpoint.com
Technical Analysis is a windsock, not a crystal ball.
Watch the latest episode of DecisionPoint with Carl & Erin Swenlin on Mondays 7:00p EST or on the DecisionPoint playlist on the StockCharts TV YouTube channel here!
NOTE: The stocks reported herein are from mechanical trading model scans that are based upon moving average relationships, momentum and volume. DecisionPoint analysis is then applied to get five selections from the scans. The selections given should prompt readers to do a chart review using their own analysis process. This letter is not a call for a specific action to buy, sell or short any of the stocks provided. There are NO sure things or guaranteed returns on the daily selection of "Diamonds in the Rough."
Helpful DecisionPoint Links:
DecisionPoint Shared ChartList and DecisionPoint Chart Gallery
Price Momentum Oscillator (PMO)
Swenlin Trading Oscillators (STO-B and STO-V)
For more links, go to DecisionPoint.com