
I ran two of my primary scans and discovered two distinct industry group themes. Both show promise. In fact, one of these groups has been a theme for some time. I'm amazed at the staying power and relative strength of this group.
The first industry group I noticed was Auto Parts. I had three that I liked today. I picked my favorite to present, but the other two are in the "Stocks to Review".
The second industry group was Banks. This group has been a permanent fixture in my scans for days. I've presented some in past reports, but I have another to present as a "Diamond in the Rough". The runner-up is in the "Stocks to Review".
Today's "Diamonds in the Rough": CIEN, DAN, RPT and UBSI.
Stocks to Review (No order): UVV, PVG, LEA, VC, NATR, THS and FIBK.

RECORDING LINK (2/11/2022):
Topic: DecisionPoint Diamond Mine (2/11/2022) LIVE Trading Room
Start Time: Feb 11, 2022 09:00 AM
Meeting Recording Link.
Access Passcode: Diamond@11
REGISTRATION FOR Friday 2/18 Diamond Mine:
When: Feb 18, 2022 09:00 AM Pacific Time (US and Canada)
Topic: DecisionPoint Diamond Mine (2/18/2022) LIVE Trading Room
Register in advance for this webinar HERE.
Save the registration confirmation email with login instructions in case Zoom doesn't notify you in time.

Topic: DecisionPoint Trading Room
Start Time: Feb 14, 2022 09:00 AM
Meeting Recording Link.
Access Passcode: Valentine#14
For best results, copy and paste the access code to avoid typos.
Welcome to DecisionPoint Daily Diamonds, wherein I highlight ten "Diamonds in the Rough" per week. These are selected from the results of my DecisionPoint Scans, which search for stocks that could benefit from the trend and condition of the market. Remember, these are not recommendations to buy or sell, but are the most interesting of the stocks that surfaced in my scans. My objective is to save you the work of the initial, tedious culling process, but you need to apply your own analysis to see if these stocks pique your interest as well. There are no guaranteed winners here!
"Predefined Scans Triggered" are taken from StockCharts.com using the "Symbol Summary" option instead of a "SharpChart" on the workbench.
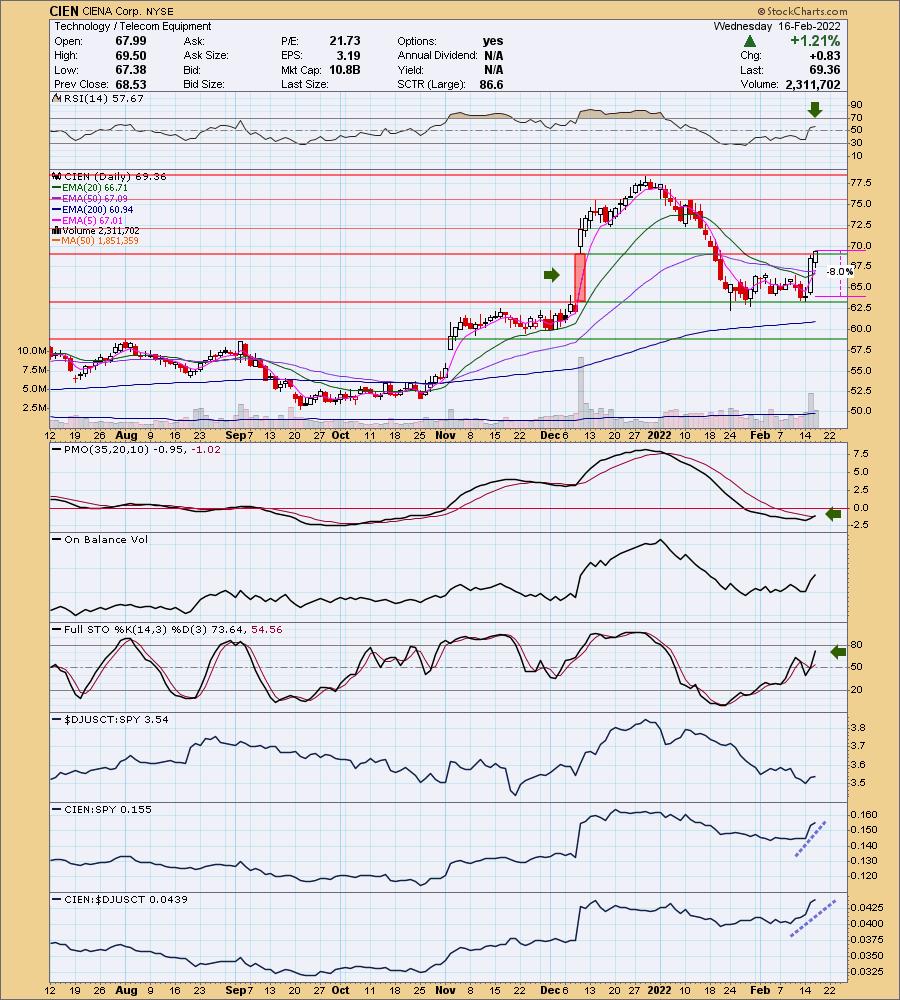
CIENA Corp. (CIEN)
EARNINGS: 3/7/2022 (BMO)
Ciena Corp. engages in the provision of network and communication infrastructure. It operates through the following segments: Networking Platforms, Platform Software and Services, Blue Planet Automation Software and Services, and Global Services. The Networking Platforms segment consists of Converged Packet Optical and Packet Networking portfolios. The Platform Software and Services segment provides analytics, data, and planning tools to assist customers in managing Ciena's Networking Platforms products in their networks. The Blue Planet Automation Software and Services segment enables customers to implement large-scale software and IT-led OSS transformations by transforming legacy networks into "service ready" networks. The Global Services segment offers a broad suite of value-added services. The company was founded by Patrick H. Nettles in November 1992 and is headquartered in Hanover, MD.
Predefined Scans Triggered: None.
CIEN is unchanged in after hours trading. I covered CIEN on July 27th 2020. The stop was hit on the gap down in September 2020 so the position is closed. I hesitated to add this one simply because the industry group has been out of favor. However, I liked the price pattern on this one. Price finally closed the December gap. Typically, after a gap has been closed, you will see follow-through. The RSI is firmly in positive territory above net neutral (50). The PMO just triggered a crossover BUY signal in oversold territory. Stochastics were jumpy, but are now rising strongly. You can see that relative strength for the group has been fading most of this year. Yet, CIEN is outperforming the group (it better be!) and more importantly the SPY. The stop is set at the intraday low from yesterday.
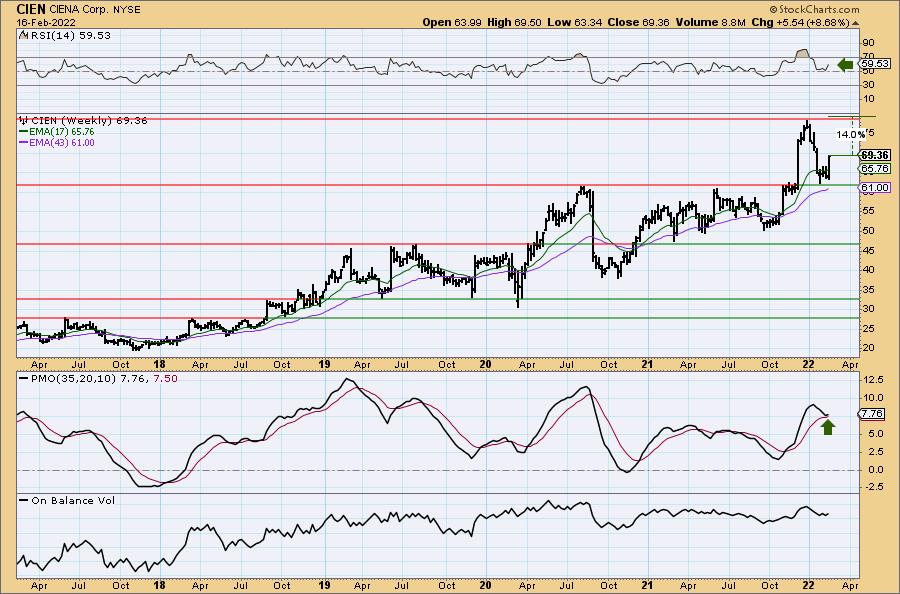
The weekly PMO has bullishly bottomed above the signal line. I always find that especially bullish. The weekly RSI is positive and not overbought. It was a dastardly decline in January, but notice it stopped right on support and rebounded.
Dana Inc. (DAN)
EARNINGS: 2/23/2022 (BMO) ** Reports next Wednesday **
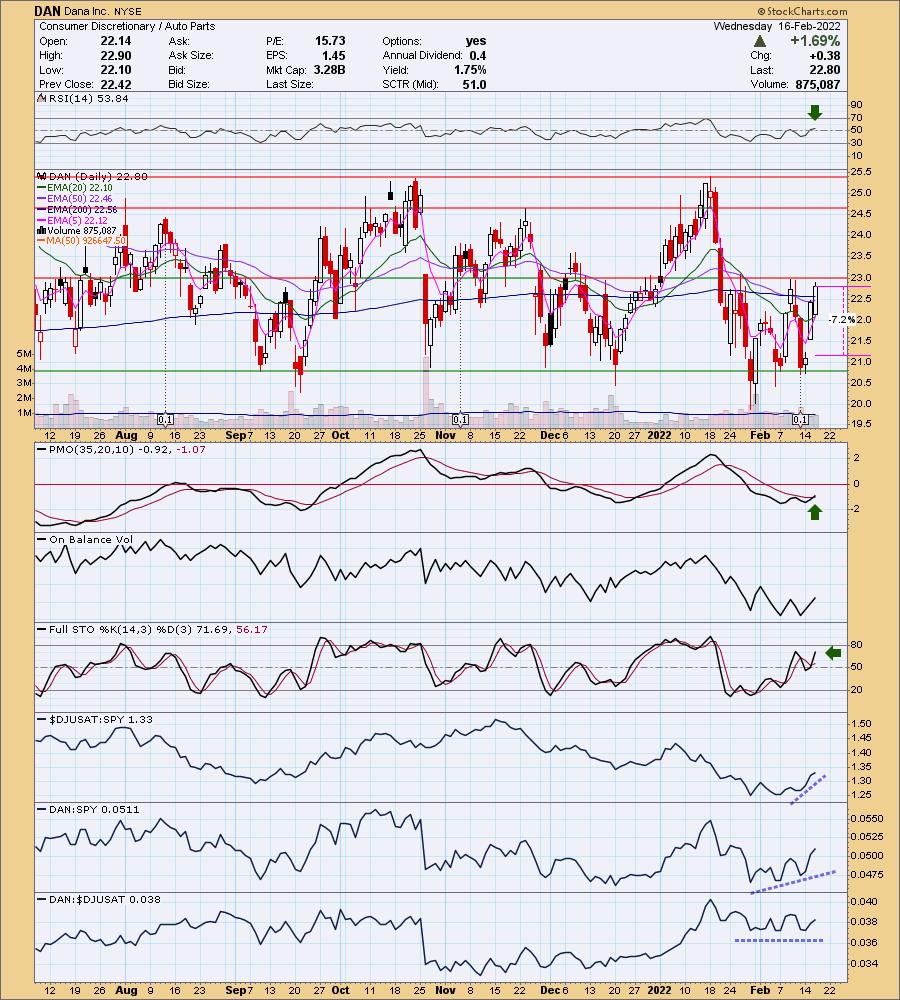
Dana, Inc. engages in the manufacture, distribution, and sale of technology drive and motion products, sealing solutions, thermal-management technologies, and fluid-power products. It operates through the following segments: Light Vehicle, Commercial Vehicle, Off-Highway, and Power Technologies. The Light Vehicle segment includes drivetrain systems and components for passenger cars, crossovers, sport utility vehicles, vans, and light trucks. The Commercial Vehicle segment consists of drivetrain and tire-pressure management systems, as well as genuine service parts for medium and heavy-duty commercial vehicles. The Off-Highway segment offers drivetrain systems and individual product solutions under the Spicer brand, and motion systems for associated machine working functions and stationary industrial equipment under the Brevini brand. The Power Technologies segment consists of sealing solutions and thermal management technologies for reducing fuel consumption and emissions. The company was founded by Clarence W. Spicer on April 1, 1904 and is headquartered in Maumee, OH.
Predefined Scans Triggered: New CCI Buy Signals, P&F Quadruple Bottom Breakdown, P&F Triple Bottom Breakdown, Entered Ichimoku Cloud and P&F Double Bottom Breakout.
DAN is unchanged in after hours trading. The chart is pretty messy. Price broke out and closed above the 20/50/200-day EMAs today. It still has some resistance to overcome at $23, but it is set up to breakout. The RSI is positive, the PMO just triggered a crossover BUY signal and Stochastics reversed in positive territory and is now close to moving above 80 which implies internal strength. Relative strength for the group is improving. This stock has been performing in line with the group and is therefore outperforming the SPY. The stop is set below support at the bottom of yesterday's gap.
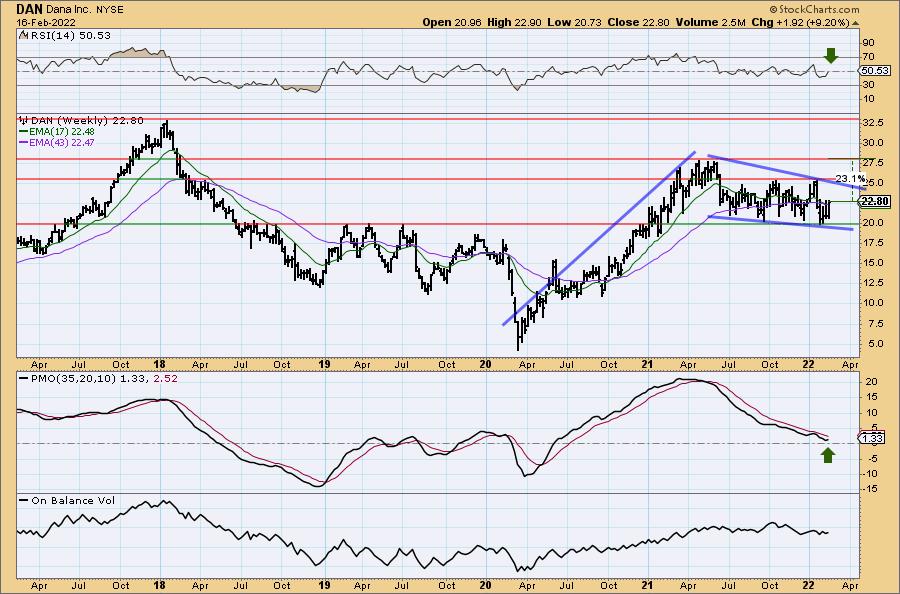
The weekly chart is getting strong. There is a clear bull flag. The flag happens to be a bullish falling wedge. The weekly PMO is turning up (although it faked us out last time it did that). If we get a move to the 2021 high, that would be a 23% gain.
RPT Realty (RPT)
EARNINGS: 2/16/2022 (AMC) ** Reported earnings after the bell **
RPT Realty operates as a real estate investment trust. The firm develops, manages, and leases out commercial properties. Its portfolio includes shopping centers, supermarkets, and retail shops. The company was founded on May 1, 1996 and is headquartered in New York, NY.
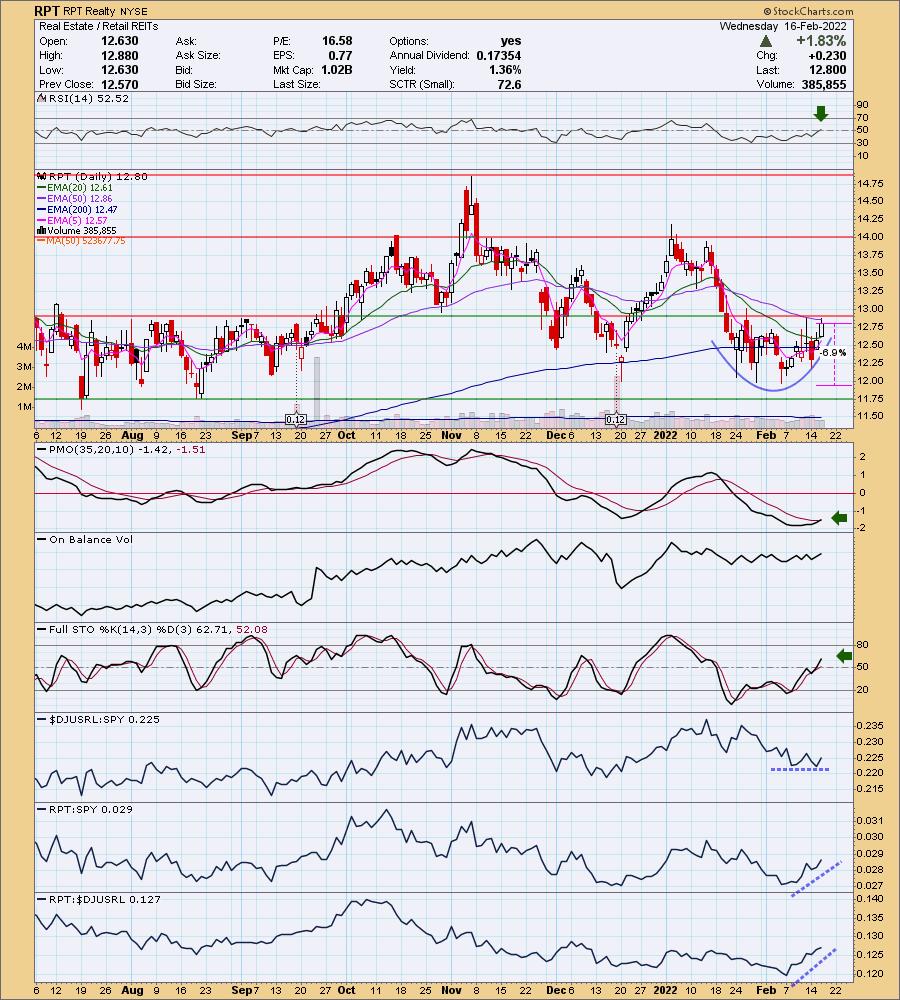
Predefined Scans Triggered: New CCI Buy Signals.
RPT is up +0.63% after reporting earnings after the bell today. This bodes well, but we could see some interesting action on the open tomorrow. We have a nice rounded price bottom. Price hasn't broken out above price resistance or the 50-day EMA. You will probably want to see if price turns back here or not. I think we'll have an answer tomorrow. The indicators are certainly favorable. The RSI just hit positive territory and the PMO triggered a crossover BUY signal today. Stochastics are rising and should hit 80 soon. Relative strength for the group is on par with the SPY, but RPT has been outperforming the group and the SPY of late. The stop is set below support at $12.
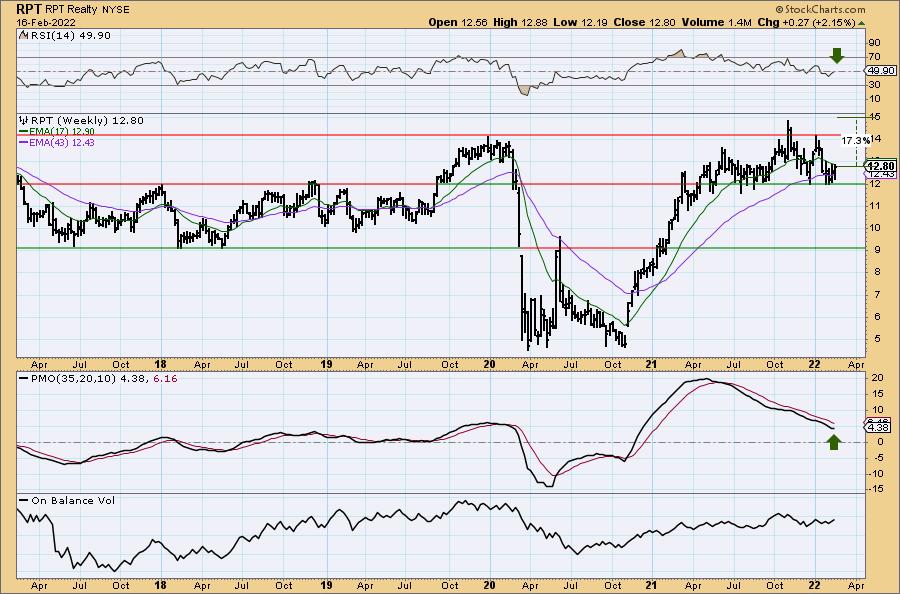
Here is another chart with clear support and resistance. Price is holding above 2018 highs. The weekly RSI is nearing positive territory and the weekly PMO is turning up. If it can reach its all-time high, that would be an over 17% gain.
United Bankshares, Inc. (UBSI)
EARNINGS: 4/22/2022 (BMO)
United Bankshares, Inc. is a bank holding company, which engages in the provision of commercial and retail banking services and products. It operates through the following segments: Community Banking, Mortgage Banking, and Other. The Community Banking segment consists of both commercial and consumer lending and provides customers with such products as commercial loans, real estate loans, business financing, and consumer loans. The Mortgage Banking segment focuses on the origination and acquisition of residential mortgages for sale into the secondary market through United's mortgage banking subsidiaries, George Mason and Crescent. The Other segment includes financial information not directly attributable to a specific segment, including interest income from investments and net securities gains or losses of parent companies and their non-banking subsidiaries. The company was founded in 1839 and is headquartered in Charleston, WV.
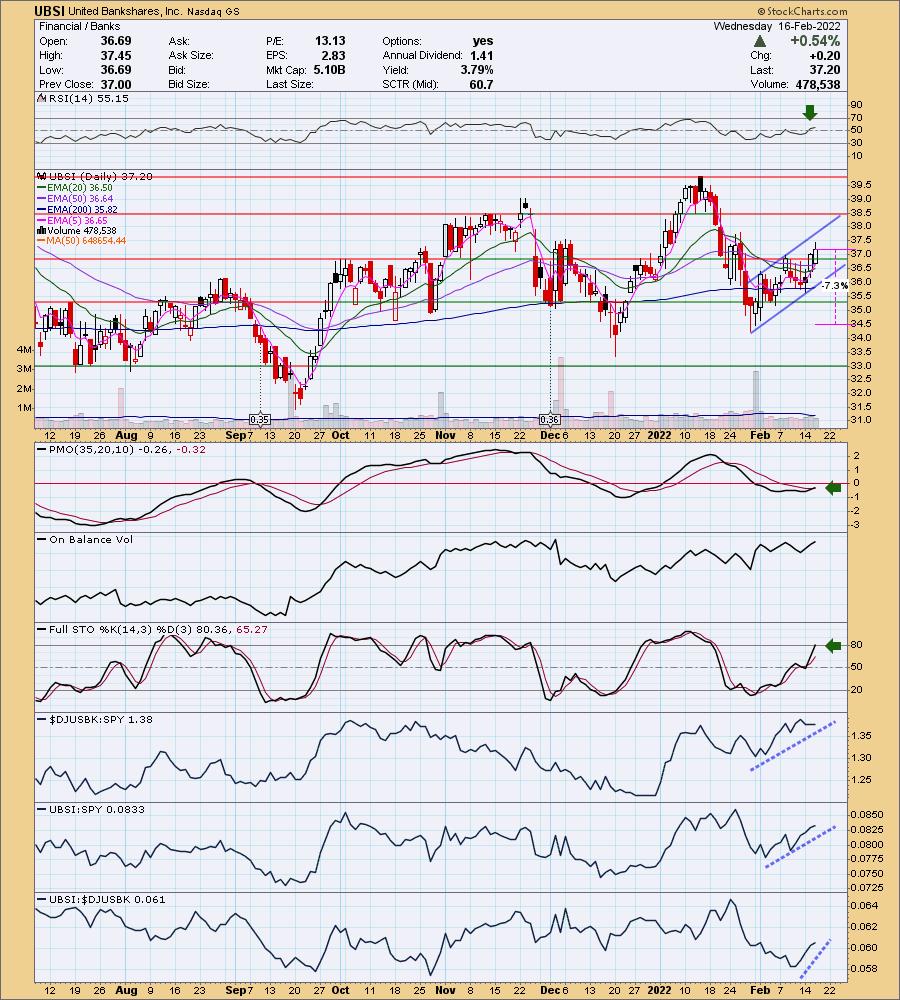
Predefined Scans Triggered: New CCI Buy Signals.
UBSI is unchanged in after hours trading. I like the breakout above the 50-day EMA and overhead resistance at the October highs, as well as last week's high. We have a ST Trend Model BUY signal as the 5-day EMA crossed above the 20-day EMA. The PMO triggered a crossover BUY signal today. Price is also traveling in a rising trend channel, not a bearish rising wedge. That suggests higher prices. I like the performance of the group and the stock. The stop is set at intraday lows from late January.
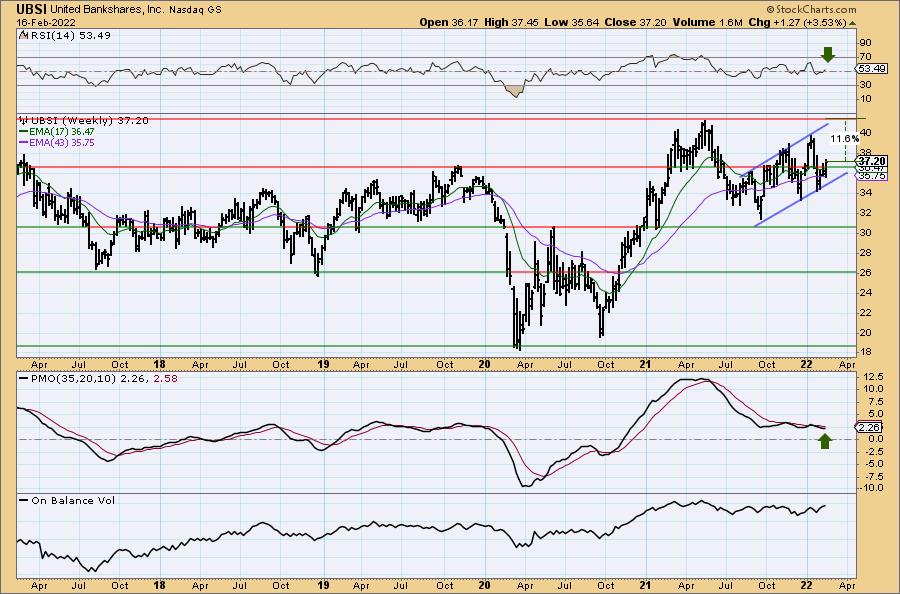
We have a rising trend channel on the weekly chart as well. The weekly RSI just returned to positive territory. The weekly PMO turned up. If price can reach the all-time high that would be an over 11% gain, but if rising rates become the norm, I would look for price to continue even higher.
Don't forget, on Thursdays I look at reader-requested symbols, click HERE to shoot me an email. I read every email I receive and try to answer them all!
Current Market Outlook:
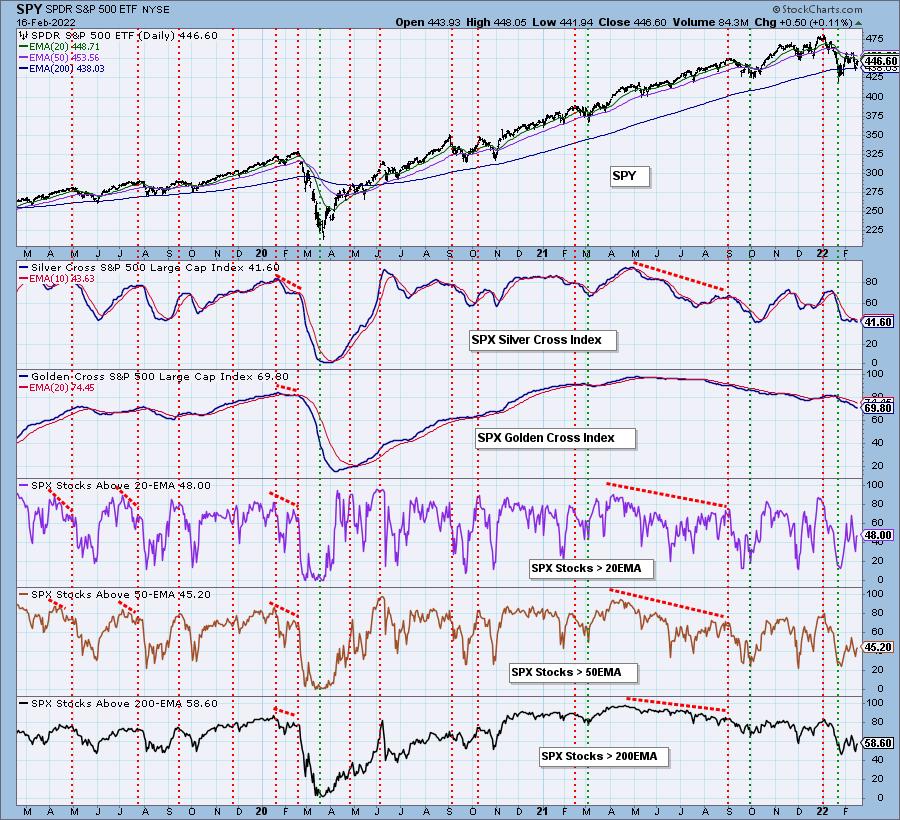
Market Environment: It is important to consider the odds for success by assessing the market tides. The following chart uses different methodologies for objectively showing the depth and trend of participation for intermediate- and long-term time frames.
- The Silver Cross Index (SCI) shows the percentage of SPX stocks on IT Trend Model BUY signals (20-EMA > 50-EMA)
- The Golden Cross Index (GCI) shows the percentage of SPX stocks on LT Trend Model BUY signals (50-EMA > 200-EMA)
Don't forget that as a "Diamonds" member, you have access to our GCI/SCI curated ChartList on DecisionPoint.com. You'll find it under "Members Only" links on the left side on the Blogs and Links Page.
Here is the current chart:
Full Disclosure: I'm 10% invested and 90% is in 'cash', meaning in money markets and readily available to trade with.
I'm required to disclose if I currently own a stock and/or may buy it within the next 72 hours.
Good Luck and Good Trading!
- Erin
"Technical Analysis is a windsock, not a crystal ball." - Carl Swenlin
(c) Copyright 2022 DecisionPoint.com
Watch the latest episode of DecisionPoint with Carl & Erin Swenlin on Mondays 7:00p EST or on the DecisionPoint playlist on the StockCharts TV YouTube channel here!
NOTE: The stocks reported herein are from mechanical trading model scans that are based upon moving average relationships, momentum and volume. DecisionPoint analysis is then applied to get five selections from the scans. The selections given should prompt readers to do a chart review using their own analysis process. This letter is not a call for a specific action to buy, sell or short any of the stocks provided. There are NO sure things or guaranteed returns on the daily selection of "Diamonds in the Rough."
Helpful DecisionPoint Links:
DecisionPoint Shared ChartList and DecisionPoint Chart Gallery
Price Momentum Oscillator (PMO)
Swenlin Trading Oscillators (STO-B and STO-V)
For more links, go to DecisionPoint.com