
The scans continue to produce a small amount of results and of those results, I didn't like many. Instead I decided to concentrate on Healthcare. This sector filled up at least one third of the scan results.
The top industry groups represented were Pharma and Biotechnology. Now I know I've said we should stay from some of the more volatile industry groups, but Biotechs were the clear winner overall in the scan results. To possibly protect us from some of the volatility in that group, I decided to pick two "established" companies in that group, but also opted to add a newcomer that has an excellent chart setup.
I included one Pharma. It was the only one of today's "Diamonds in the Rough" that came from one of my scans. The three Biotechs were culled using the SCTR and the primary indicators I follow. If the chart looked positive and most of the indicator components were positive, I included it.
Today's "Diamonds in the Rough": HRMY, INCY, RHHBY and SGEN.
Stocks to Review: FOLD, OPCH, VRTX, ABBV and NKTR.

RECORDING LINK (3/4/2022):
Topic: DecisionPoint Diamond Mine (3/4/2022) LIVE Trading Room
Start Time: Mar 4, 2022 09:00 AM
MeetingRecording Link.
Access Passcode: March#4th
REGISTRATION FOR Friday 3/11 Diamond Mine:
When: Mar 11, 2022 09:00 AM Pacific Time (US and Canada)
Topic: DecisionPoint Diamond Mine (3/11/2022) LIVE Trading Room
Register in advance for this webinar HERE.
Save the registration confirmation email with login instructions in case Zoom doesn't notify you in time.

Free DecisionPoint Trading Room Recording:
Topic: DecisionPoint Trading Room
Start Time: Mar 7, 2022 09:00 AM PT
Meeting Recording Link.
Access Passcode: March@7th
For best results, copy and paste the access code to avoid typos.
Welcome to DecisionPoint Daily Diamonds, wherein I highlight ten "Diamonds in the Rough" per week. These are selected from the results of my DecisionPoint Scans, which search for stocks that could benefit from the trend and condition of the market. Remember, these are not recommendations to buy or sell, but are the most interesting of the stocks that surfaced in my scans. My objective is to save you the work of the initial, tedious culling process, but you need to apply your own analysis to see if these stocks pique your interest as well. There are no guaranteed winners here!
"Predefined Scans Triggered" are taken from StockCharts.com using the "Symbol Summary" option instead of a "SharpChart" on the workbench.
Harmony Biosciences Holdings Inc. (HRMY)
EARNINGS: 5/3/2022 (BMO)
Harmony Biosciences Holdings, Inc. is a commercial-stage pharmaceutical company, which engages in the development and commercialization of therapies for the treatment of neurological disorders. Its product WAKIX is a molecule with a novel mechanism of action designed to increase histamine signaling in the brain by binding to H3 receptors. The company was founded on July 25, 2017 and is headquartered in Plymouth Meeting, PA.
Predefined Scans Triggered: Moved Above Upper Keltner Channel, New 52-week Highs and P&F Double Top Breakout.
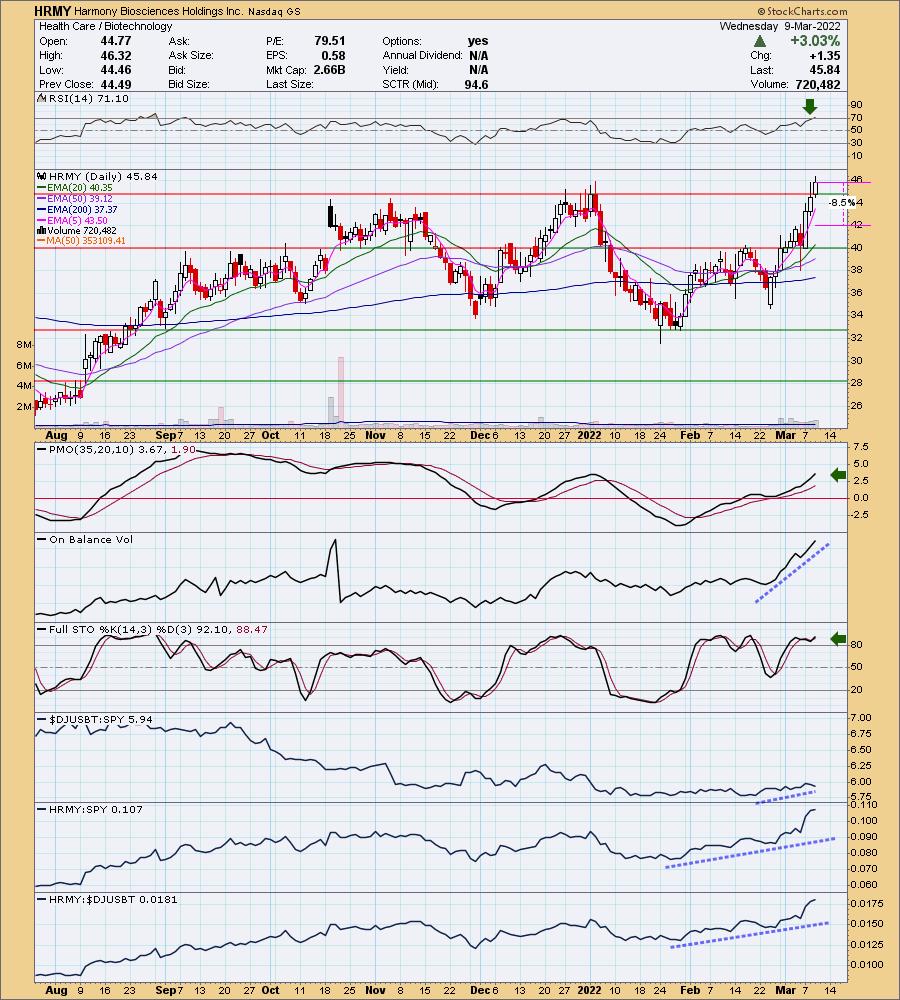
HRMY is unchanged in after hours trading. While not a "big name" pharmaceutical company, it is a mid-cap and has a 50-MA of volume at over 350,000. I had to include this one despite having an overbought RSI. Price has broken out to a multi-month high. The PMO is rising strongly and is not overbought. The OBV reflects renewed interest in this stock. Stochastics are oscillating above 80 which suggests internal strength. As I noted in the opening, Biotechs are starting to show some relative strength and this one has been outperforming the group and the SPY for some time. The stop is set at just below $42. It's somewhat arbitrary because moving it down to $40 was far too deep for my taste.
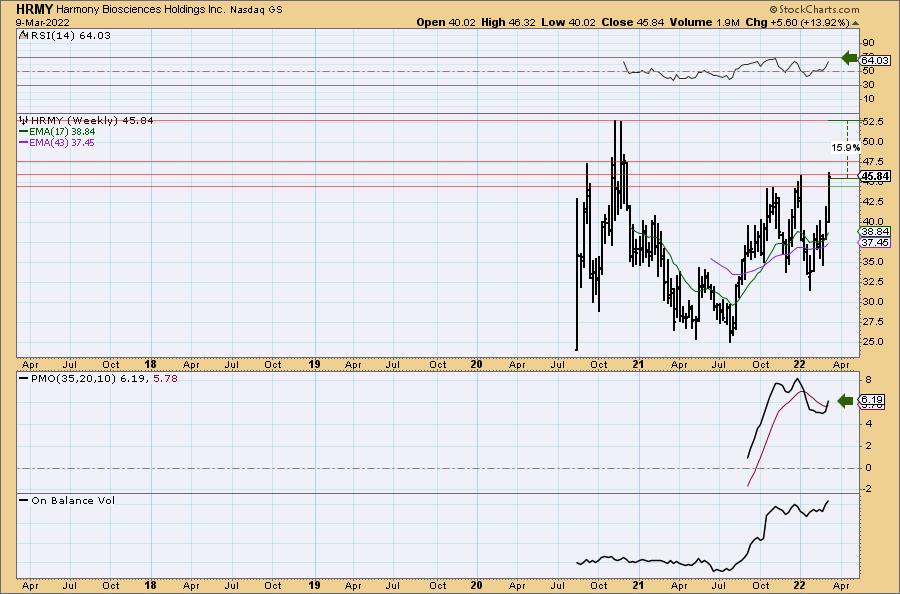
We don't have a lot of history on the indicators, but we do know that the weekly RSI is positive and the weekly PMO gave us a new crossover BUY signal.
Incyte Corp. (INCY)
EARNINGS: 5/3/2022 (BMO)
Incyte Corp. is a biopharmaceutical company, which engages in the discovery, development and commercialization of proprietary therapeutics. Its portfolio includes compounds in various stages, ranging from preclinical to late stage development, and commercialized products such as JAKAFI (ruxolitinib), and ICLUSIG (ponatinib). The company was founded by Roy A. Whitfield in April 1991 and is headquartered in Wilmington, DE.
Predefined Scans Triggered: P&F Double Top Breakout.
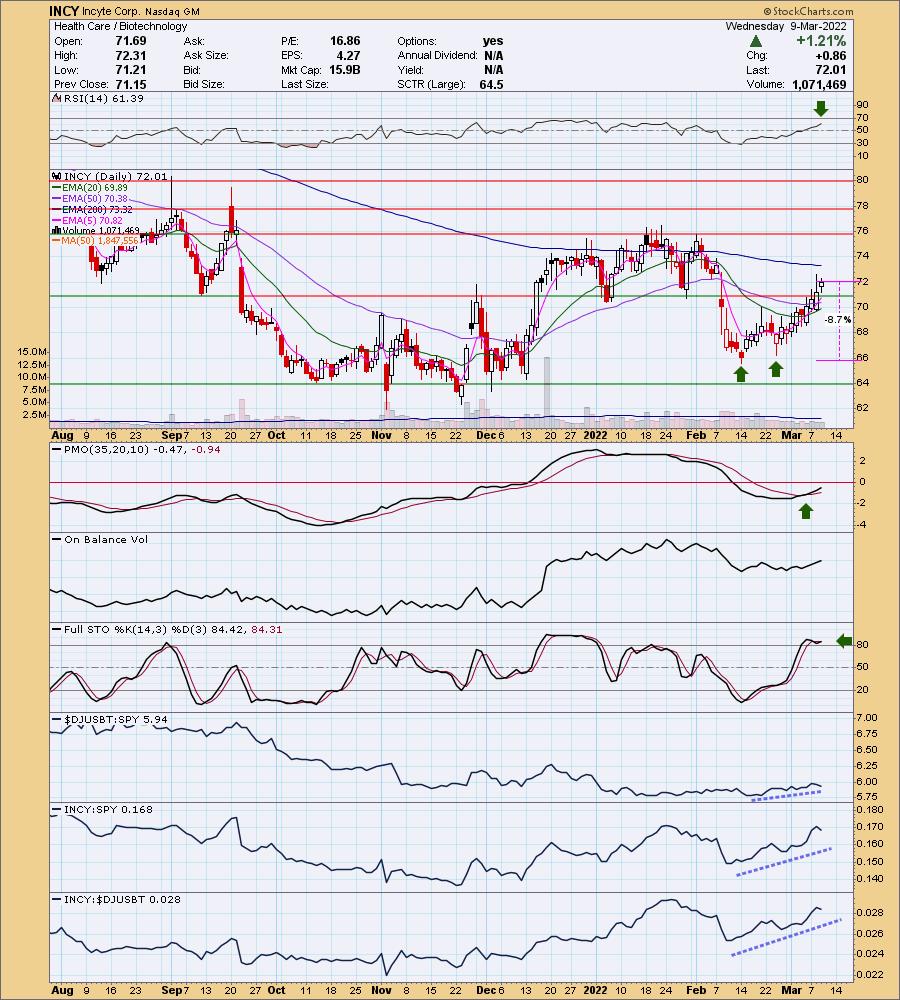
INCY is up +1.37% in after hours trading. This is a larger cap biotech that may see a bit less volatility. It is in a bear market so while we expect higher prices, we should temper our expectations. There is a confirmed double-bottom pattern that suggests and upside target at January highs. Price broke above resistance at $71 and is continuing higher. The next resistance level is the 200-day EMA. The RSI is rising and positive sitting above net neutral (50). The PMO is on a crossover BUY signal, rising and nearing positive territory above the zero line. Stochastics are oscillating above 80. Relative strength against the group and the SPY is excellent. The stop is set below the double-bottom pattern.
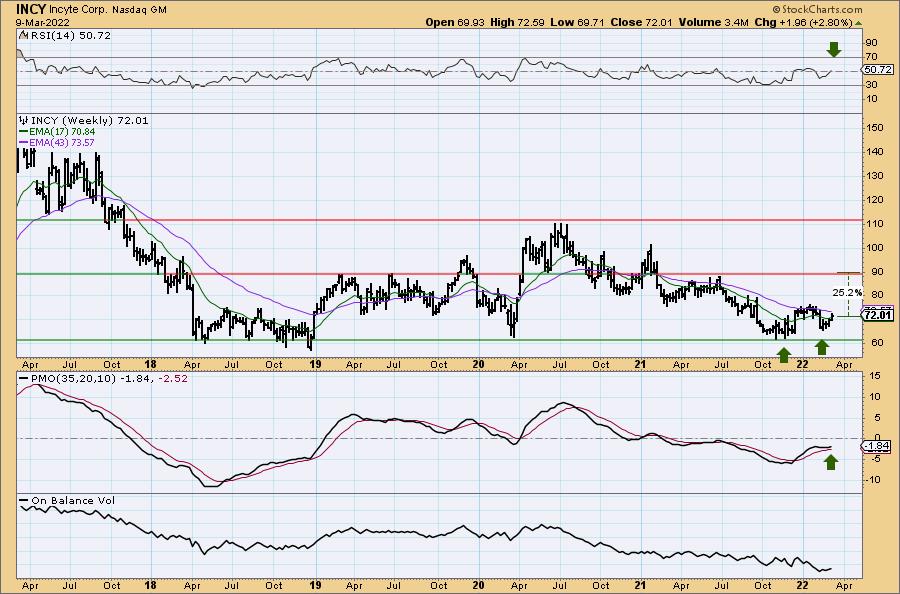
There is a longer-term double bottom pattern that would be confirmed if price does overcome January highs. The upside target of that pattern would take price to the $90 resistance level. The weekly RSI is positive and the weekly PMO is turning up above its signal line which is especially bullish. If it fulfills the target of the longer-term double-bottom, that would put price at mid-2021 highs for a 25%+ gain.
Roche Holding Ltd. (RHHBY)
EARNINGS: N/A
Roche Holding AG operates as a research healthcare company. It operates through the following divisions: Pharmaceuticals and Diagnostics. The Pharmaceutical division comprises the business segments, such as Roche Pharmaceuticals and Chuga. The Diagnostic division consists of the following four business areas: centralized and point of care solutions, molecular diagnostics, tissue diagnostics and diabetes care. The company was founded by Fritz Hoffmann-La Roche on October 1, 1896 and is headquartered in Basel, Switzerland.
Predefined Scans Triggered: Elder Bar Turned Green, Parabolic SAR Buy Signals, P&F Double Bottom Breakout and P&F Bull Trap.
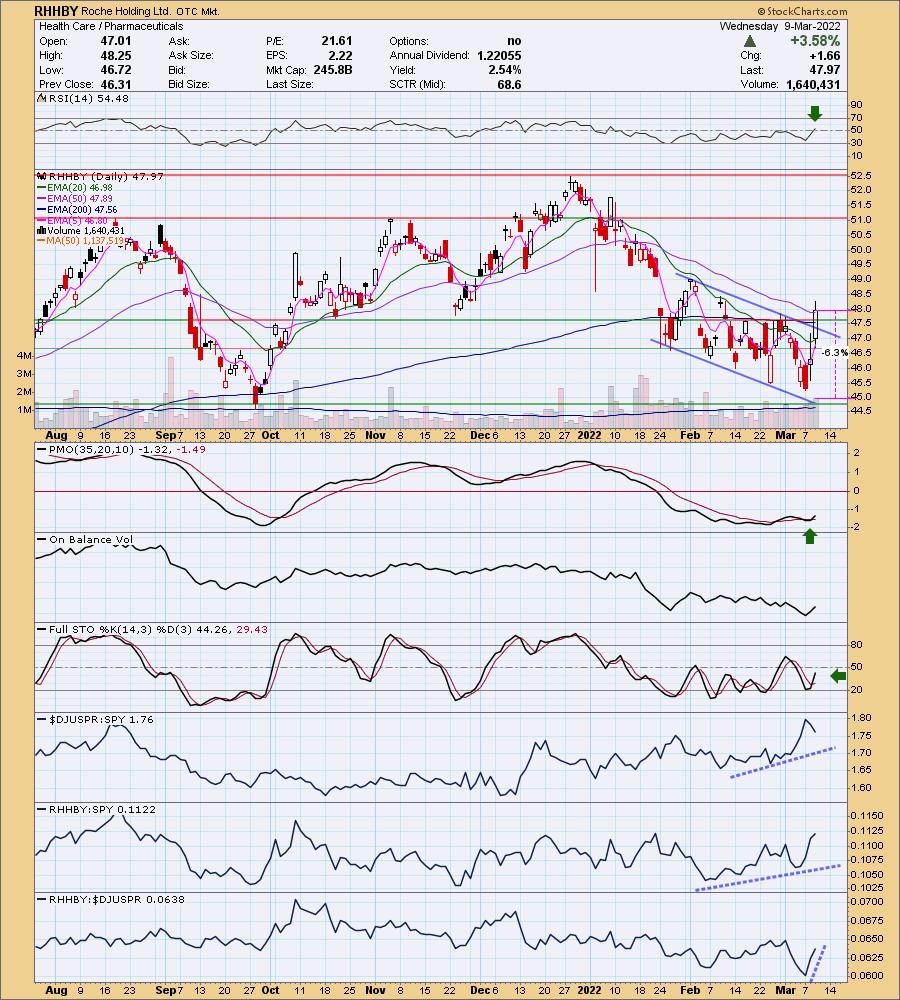
RHHBY is unchanged in after hours trading. I have to say I'm not thrilled to see it triggered a "P&F Bull Trap" predefined scan on StockCharts.com, but I like the other triggered scans. Price broke from a declining trend channel, overcame the 50-day EMA and overcame resistance at the October/November 2021 lows. The RSI just hit positive territory and the PMO is on a whipsaw BUY signal (almost as good as a bottom above the signal line). Stochastics are rising but haven't reached positive territory above net neutral (50) yet. Relative strength for the group has improved although we saw a downturn in the relative strength line. This one has been outperforming. The stop is a comfortable 6.3% set below the low on Monday.
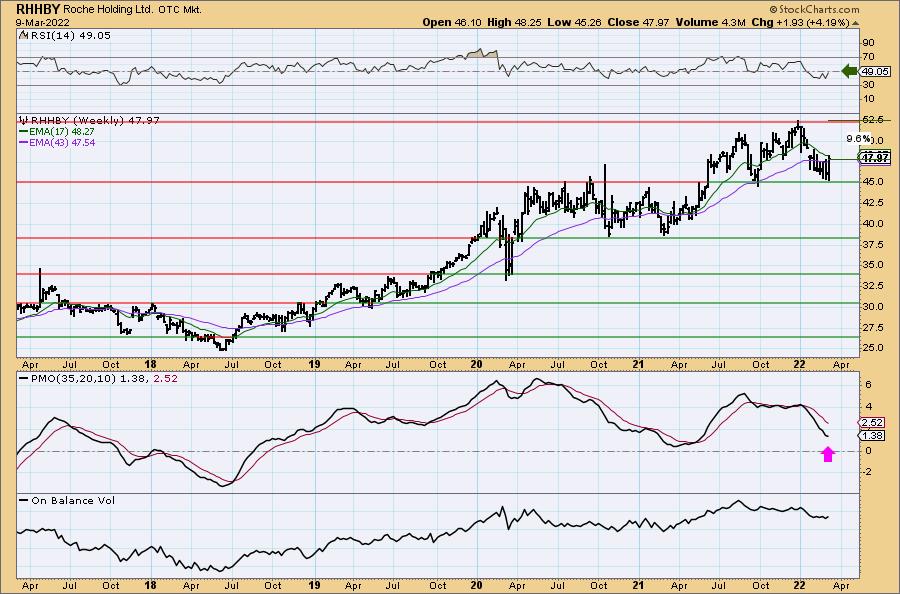
The weekly chart is somewhat mixed. The weekly RSI isn't quite positive, but its very close to moving above 50. The weekly PMO is trying to turn up which is positive, but it is still declining. Upside potential if it reaches all-time highs is +9.6%, but I'd consider setting a target closer to 15% at around $55.17.
Seagen (SGEN)
EARNINGS: 4/28/2022 (AMC)
Seagen Inc. is a biotechnology company, which engages in the development and commercialization of antibody-based therapies for the treatment of cancer. Its products include Adcetris and Padcev. The firm is also advancing a pipeline of novel therapies for solid tumors and blood-related cancers. The company was founded by Clay B. Siegall and H. Perry Fell on July 15, 1997, and is headquartered in Bothell, WA.
Predefined Scans Triggered: Moved Above Upper Bollinger Band and P&F Double Top Breakout.
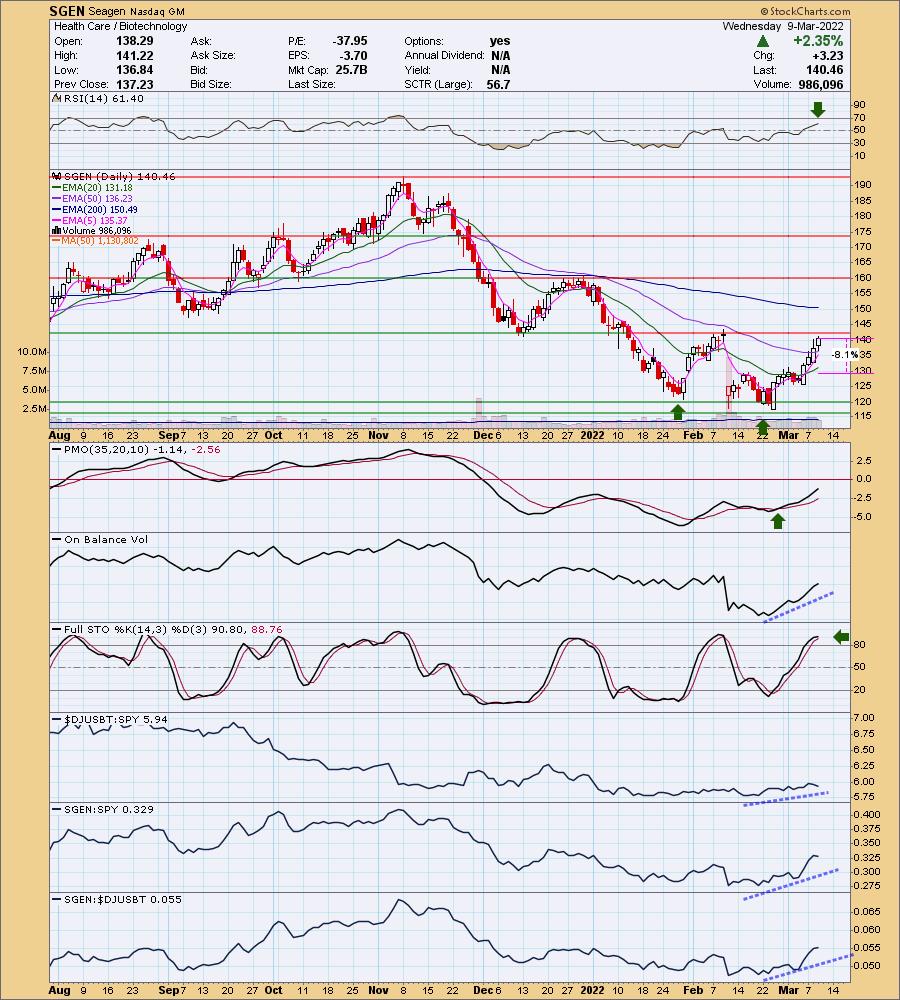
SGEN is unchanged in after hours trading. I've covered SGEN twice before on December 3rd 2020 and December 21st 2021. Both positions have since been stopped out. We have a somewhat messy double-bottom (the 2nd bottom is somewhat complex). The indicators look very good. The RSI is rising and isn't overbought. The PMO is rising on a BUY signal from February. Volume is coming in based on the rise in the OBV. Stochastics are above 80 suggesting internal strength. Relative strength against the group and SPY is very favorable.
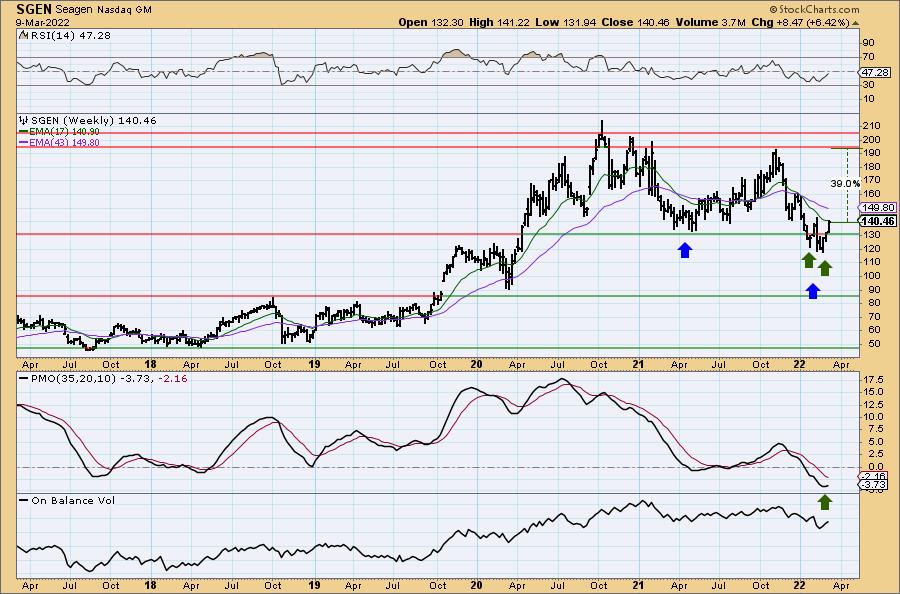
We can make out the short-term double-bottom on the weekly chart (green arrows), but we have a larger one forming (blue arrows). The weekly RSI may be negative, but it is rising. The weekly PMO has bottomed. Upside potential if it reaches the confirmation line of the large double-bottom is 39%.
Don't forget, on Thursdays I look at reader-requested symbols, click HERE to shoot me an email. I read every email I receive and try to answer them all!
Current Market Outlook:
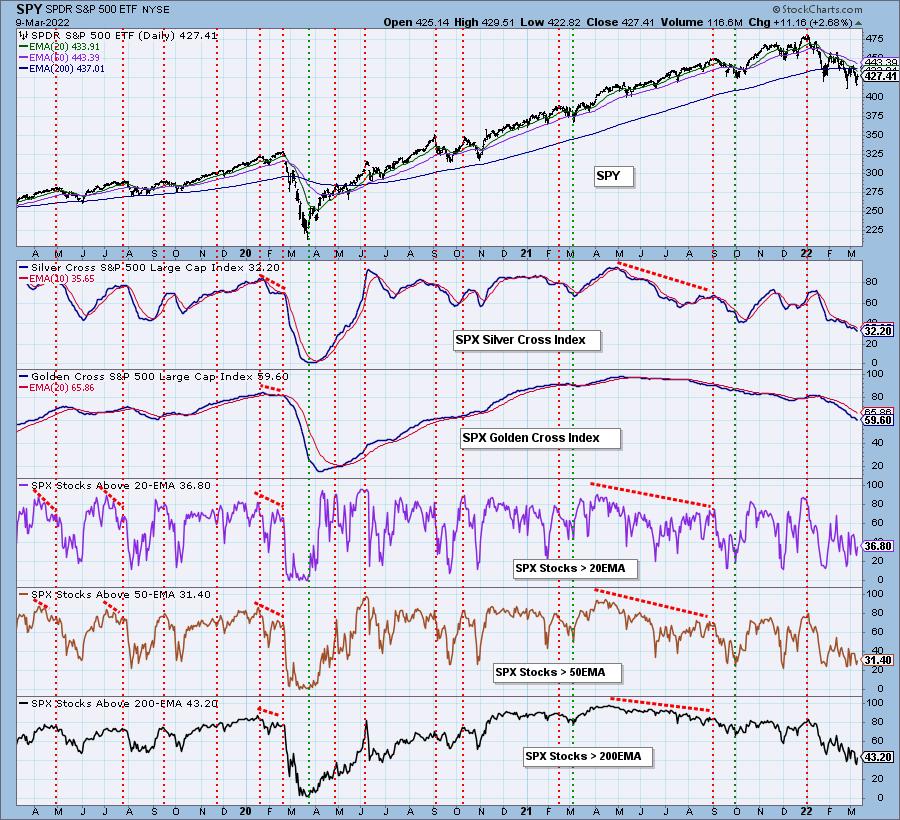
Market Environment: It is important to consider the odds for success by assessing the market tides. The following chart uses different methodologies for objectively showing the depth and trend of participation for intermediate- and long-term time frames.
- The Silver Cross Index (SCI) shows the percentage of SPX stocks on IT Trend Model BUY signals (20-EMA > 50-EMA)
- The Golden Cross Index (GCI) shows the percentage of SPX stocks on LT Trend Model BUY signals (50-EMA > 200-EMA)
Don't forget that as a "Diamonds" member, you have access to our GCI/SCI curated ChartList on DecisionPoint.com. You'll find it under "Members Only" links on the left side on the Blogs and Links Page.
Here is the current chart:
Full Disclosure: I'm 25% invested and 75% is in 'cash', meaning in money markets and readily available to trade with.
I'm required to disclose if I currently own a stock and/or may buy it within the next 72 hours.
Good Luck and Good Trading!
- Erin
"Technical Analysis is a windsock, not a crystal ball." - Carl Swenlin
(c) Copyright 2022 DecisionPoint.com
Watch the latest episode of DecisionPoint with Carl & Erin Swenlin on Mondays 7:00p EST or on the DecisionPoint playlist on the StockCharts TV YouTube channel here!
NOTE: The stocks reported herein are from mechanical trading model scans that are based upon moving average relationships, momentum and volume. DecisionPoint analysis is then applied to get five selections from the scans. The selections given should prompt readers to do a chart review using their own analysis process. This letter is not a call for a specific action to buy, sell or short any of the stocks provided. There are NO sure things or guaranteed returns on the daily selection of "Diamonds in the Rough."
Helpful DecisionPoint Links:
DecisionPoint Shared ChartList and DecisionPoint Chart Gallery
Price Momentum Oscillator (PMO)
Swenlin Trading Oscillators (STO-B and STO-V)
For more links, go to DecisionPoint.com