
Scan results continue to dwindle but I did notice quite a few bearish index funds coming up as well as an ETF that follows the Dollar. I selected requests not totally based on the sparkle potential, more for those who simply were curious what I thought.
Still exhausted, good days and bad days with mom-in-law. Therefore I only am doing four diamonds today to give you the ten total you're promised each week. The Diamond Mine will proceed as usual tomorrow morning! You can register in the section below.
Today's "Diamonds in the Rough": CRK, FFIV, LABU and MGPI.
Other requests: FCN, AVA, UVV, CPT, FLO, UTZ and CPT.

RECORDING LINK (3/18/2022):
Topic: DecisionPoint Diamond Mine (3/18/2022) LIVE Trading Room
Start Time: Mar 18, 2022 09:00 AM
MeetingRecording Link.
Access Passcode: March$18
REGISTRATION FOR Friday 4/8 Diamond Mine:
When: Apr 8, 2022 09:00 AM Pacific Time (US and Canada)
Topic: DecisionPoint Diamond Mine (4/8/2022) LIVE Trading Room
Register in advance for this webinar HERE.
Save the registration confirmation email with login instructions in case Zoom doesn't notify you in time.

Free DP Trading Room (4/4) RECORDING LINK:
Topic: DecisionPoint Trading Room
Start Time: Apr 4, 2022 08:59 AM
Meeting Recording Link.
Access Passcode: April#4th
For best results, copy and paste the access code to avoid typos.
Welcome to DecisionPoint Daily Diamonds, wherein I highlight ten "Diamonds in the Rough" per week. These are selected from the results of my DecisionPoint Scans, which search for stocks that could benefit from the trend and condition of the market. Remember, these are not recommendations to buy or sell, but are the most interesting of the stocks that surfaced in my scans. My objective is to save you the work of the initial, tedious culling process, but you need to apply your own analysis to see if these stocks pique your interest as well. There are no guaranteed winners here!
"Predefined Scans Triggered" are taken from StockCharts.com using the "Symbol Summary" option instead of a "SharpChart" on the workbench.
Comstock Resources, Inc. (CRK)
EARNINGS: 5/3/2022 (AMC)
Comstock Resources, Inc. engages in the acquisition, development, and exploration of oil and natural gas. The firm operations concentrated in the Haynesville shale, a premier natural gas basin located in East Texas. The company was founded in 1919 and is headquartered in Frisco, TX.
Predefined Scans Triggered: P&F Double Top Breakout.
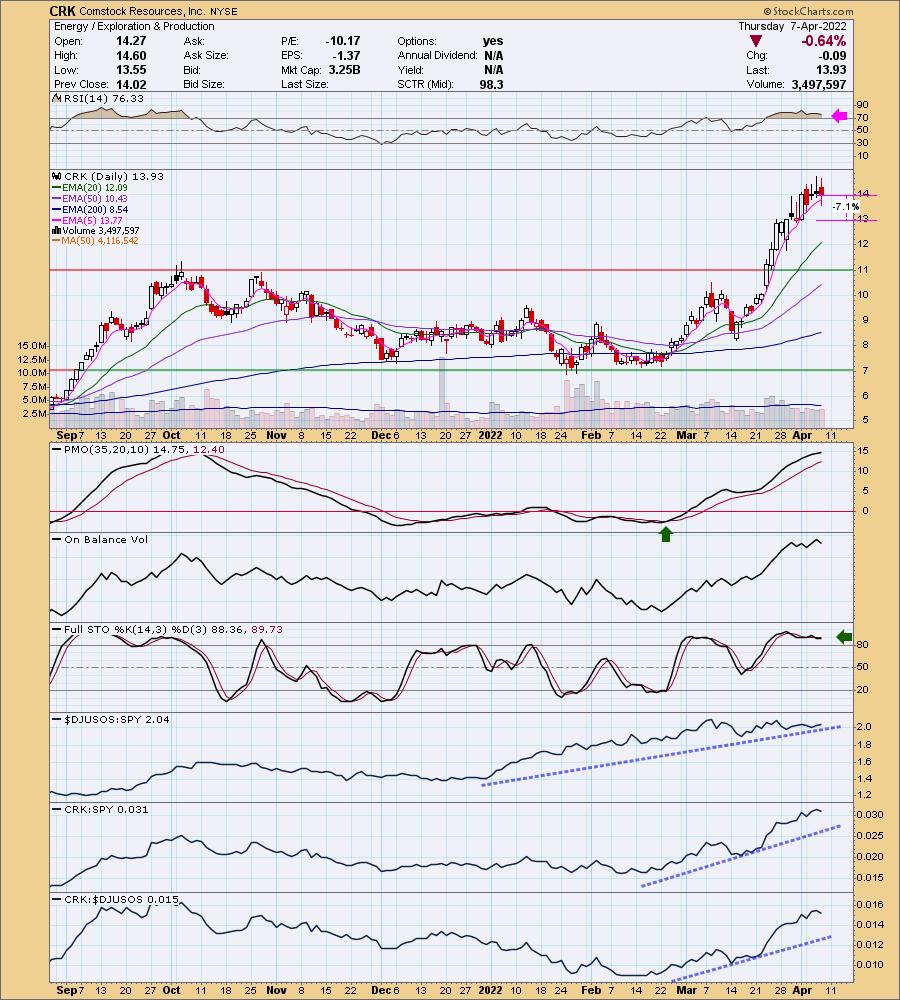
Look out below! CRK is down -2.15% in after hours trading. That doesn't always mean you will see follow-through on an after hours move, but it does give us some insight. I covered this March 10th 2022. The position is up +39.0% currently. This reader was most curious about whether to set a stop or reset the stop daily. I would suggest a trailing stop on a fast mover like this one. However, it looks really toppy right now. The RSI is overbought and now falling. The PMO is still rising but it looks toppy too. Stochastics are looking positive as the oscillate above 80 and certainly relative strength is bullish. I've listed a stop just below $13.
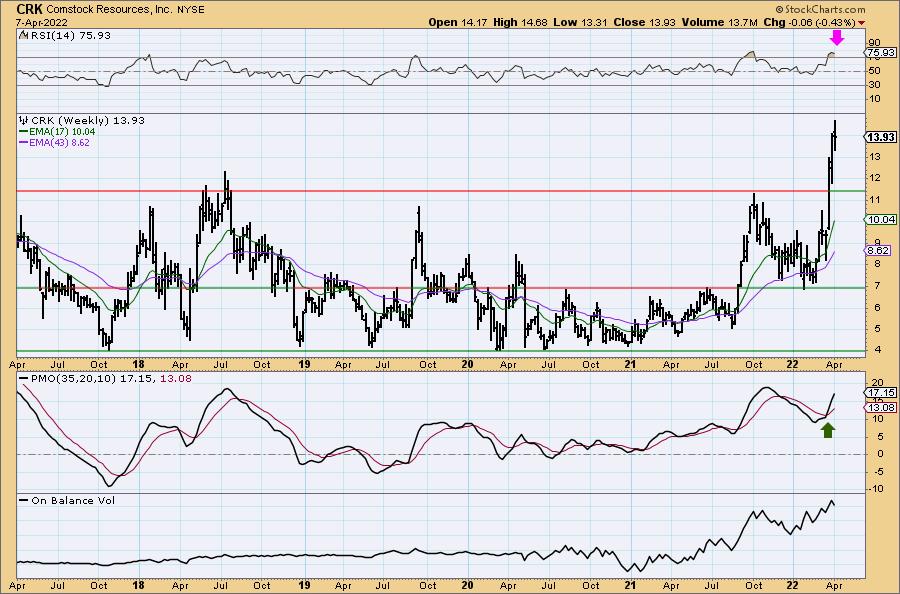
This has been a very productive rally that has taken price easily to all-time highs. The problem is that it also took the weekly RSI into overbought territory. The weekly PMO looks very good, but it is now starting get overbought. This stock is on a parabolic run. Be very very careful, I wouldn't enter it now given its parabolic run may be ending.
F5 Networks, Inc. (FFIV)
EARNINGS: 4/26/2022 (AMC)
F5, Inc. engages development and provision of software defined application services. It offers the development, marketing and sale of application delivery networking products that optimize the security, performance, and availability of network applications, servers, and storage systems. The company was founded on February 26, 1996, and is headquartered in Seattle, WA.
Predefined Scans Triggered: Improving Chaikin Money Flow, P&F Spread Triple Top Breakout and P&F Double Top Breakout.
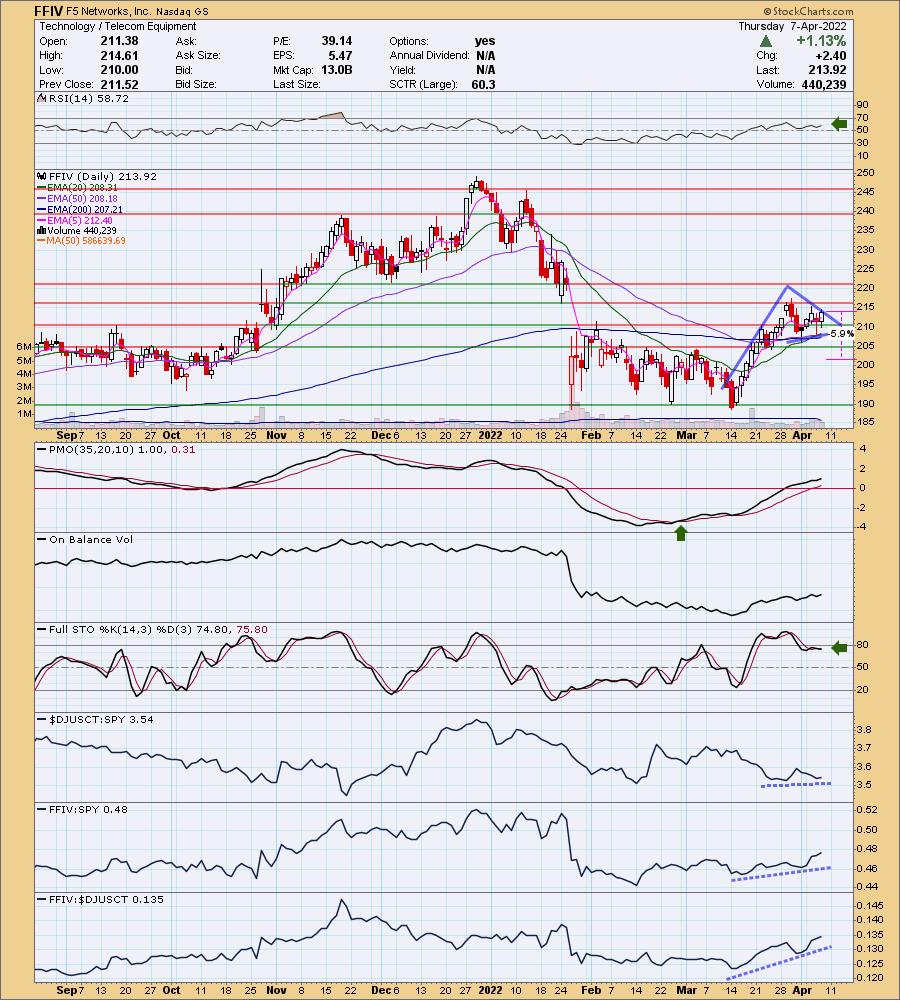
FFIV is unchanged in after hours trading. I covered this one February 27th 2020, the position has since been stopped out. I like the chart but I don't like Technology in general right now. The sector is struggling right now. That aside, we do see a bullish pennant on a flagpole. The expectation is an upside breakout. The RSI is positive and the PMO is rising nicely on an oversold crossover BUY signal. Stochastics aren't falling, but they are mediocre given they aren't above 80. Relative strength isn't great for the Telecom group, but FFIV is holding its own against the group and SPY. The stop is below the February tops, but you could set it even tighter.
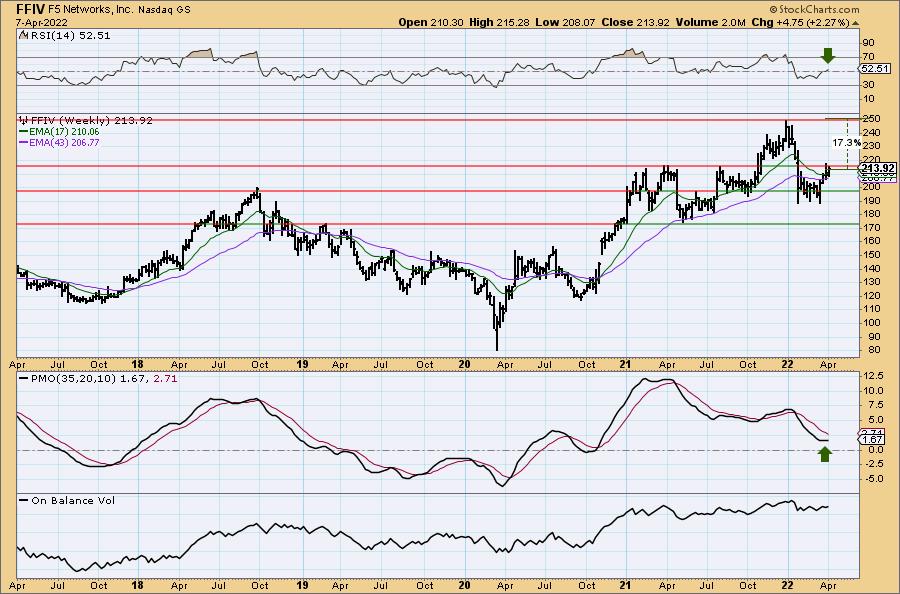
FFIV is up against resistance at the 2021 tops. Given the condition of the market and the Tech sector this could be a big problem. The weekly RSI is now in positive territory which is good. The weekly PMO is neutral as it moves sideways. If it does break out here, we can set an upside target of 17.3%.
Direxion Daily S&P Biotech Bull 3x Shares (LABU)
EARNINGS: N/A
LABU provides daily 3 times exposure to the S&P Biotechnology Select Industry Index.
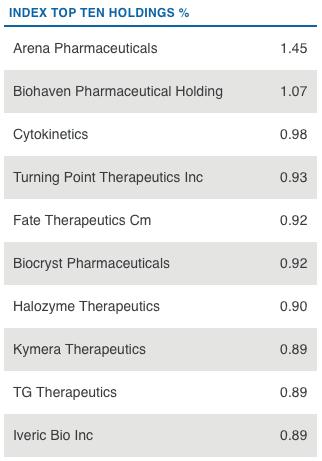
Predefined Scans Triggered: Moved Below Ichimoku Cloud, Parabolic SAR Sell Signals and P&F High Pole.
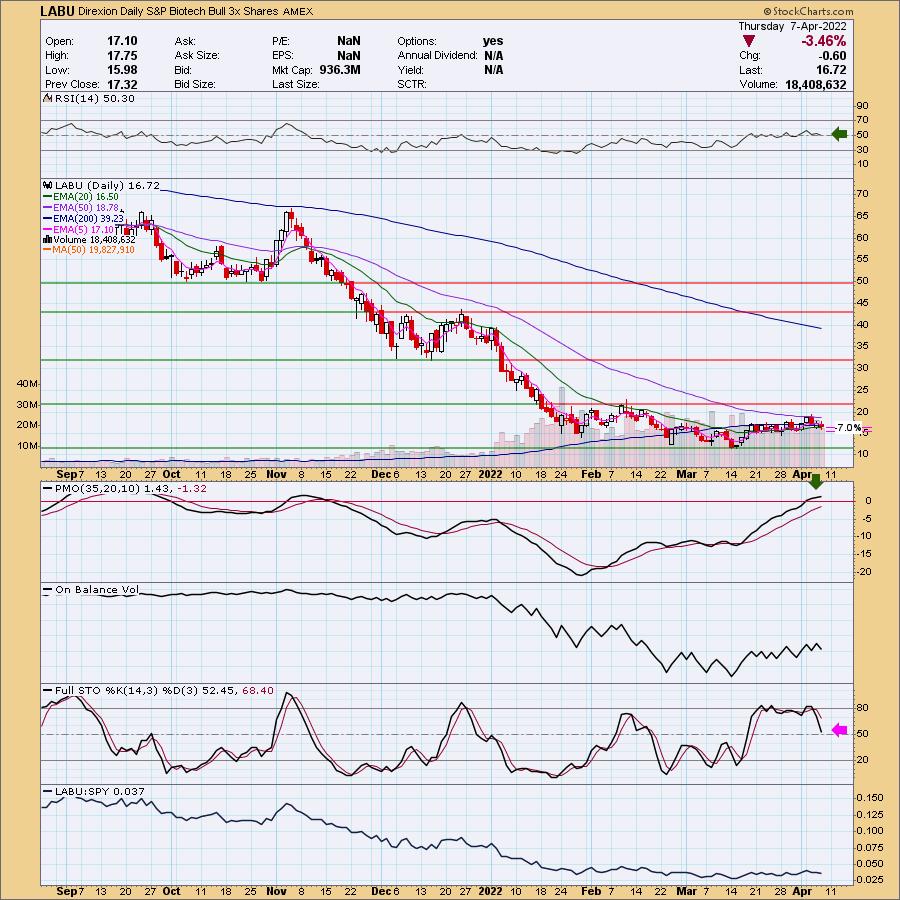
LABU is down -0.06% in after hours trading. I covered LABU on November 4th 2021. The position was stopped out. The chart is mixed. It is holding above its 20-day EMA but is stunted at the 50-day EMA. The PMO is now in positive territory. The RSI is above 50, but moving sideways and not showing improvement. Stochastics look terrible. Relative performance is in line with the SPY, but given the weakness in the SPY that isn't a good thing. I set the stop below the 20-day EMA.
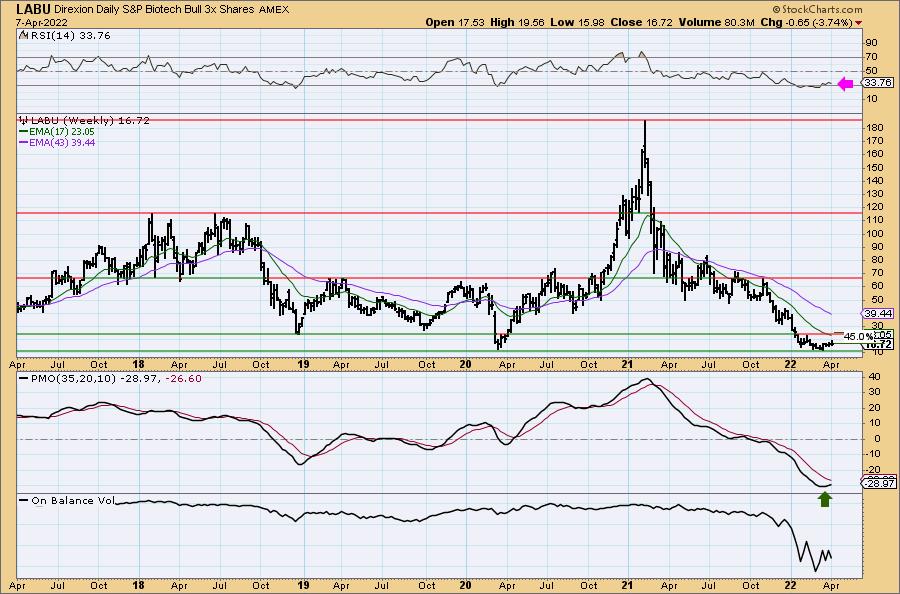
The weekly chart is intriguing given the now rising PMO and price's bounce off very long-term support. However, I don't like how the weekly RSI is acting. If it can reach the 2018 low that would be a 45% gain.
MGP Ingredients, Inc. (MGPI)
EARNINGS: 5/4/2022 (BMO)
MGP Ingredients, Inc. engages in the manufacture and trade of food, beverage, specialty wheat protein and starch food ingredients. It operates through the following segments: Distillery Products, Branded Spirits and Ingredient Solutions. The Distillery Products segment consists of food grade alcohol and distillery co-products, such as distillers feed and fuel grade alcohol. It also includes warehouse services, including barrel put away, barrel storage and barrel retrieval services. The Branded Spirits segment focuses on producing, importing, bottling and rectifying of distilled spirits through distilleries and bottling facilities. The Ingredient Solutions segment consists of specialty starches and proteins and commodity starches and proteins. The company was founded by Cloud L. Cray in 1941 and is headquartered in Atchison, KS.
Predefined Scans Triggered: Moved Above Upper Keltner Channel, New 52-week Highs, Moved Above Upper Bollinger Band, Moved Above Upper Price Channel, P&F Ascending Triple Top Breakout and P&F Double Top Breakout.
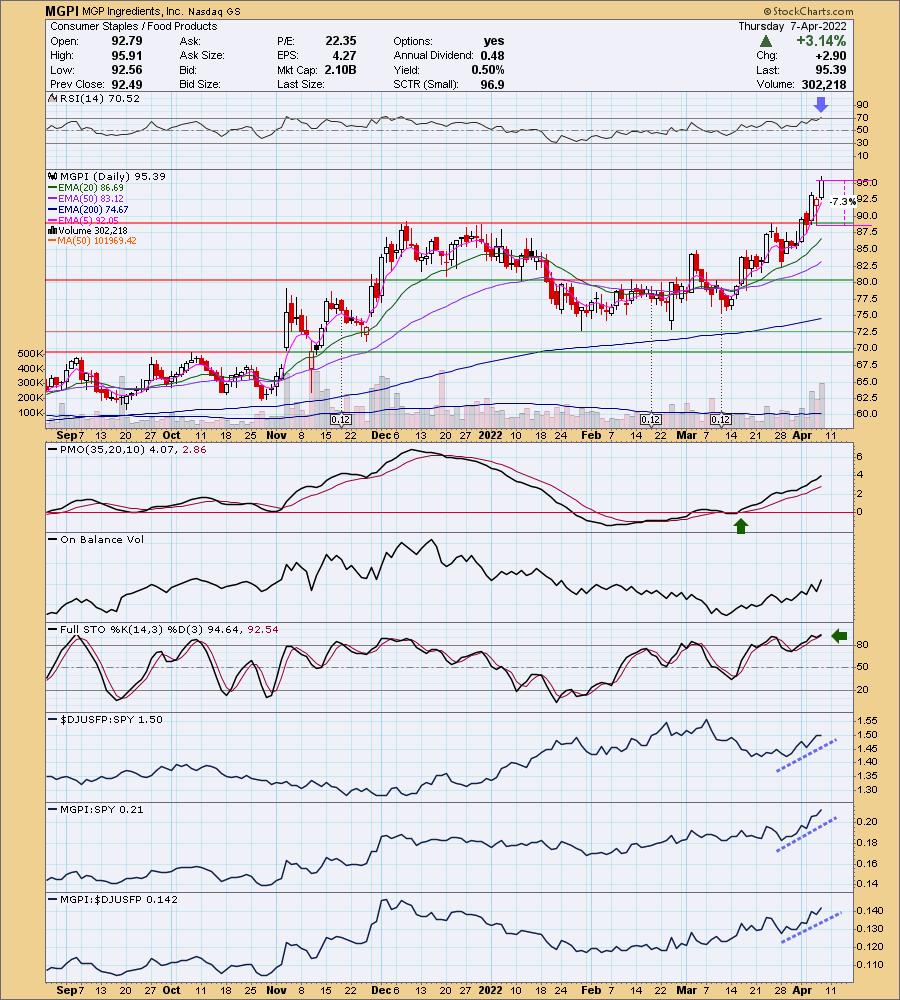
MGPI is up +0.64% in after hours trading. This one continues to make new highs on its breakout above the December highs. The RSI is a bit overbought, but the PMO looks great as it rises and isn't overbought. Stochastics are very favorable as they rise above 80. Relative strength is also looking good as the group and the stock outperform the market. The stop is set below the December highs.
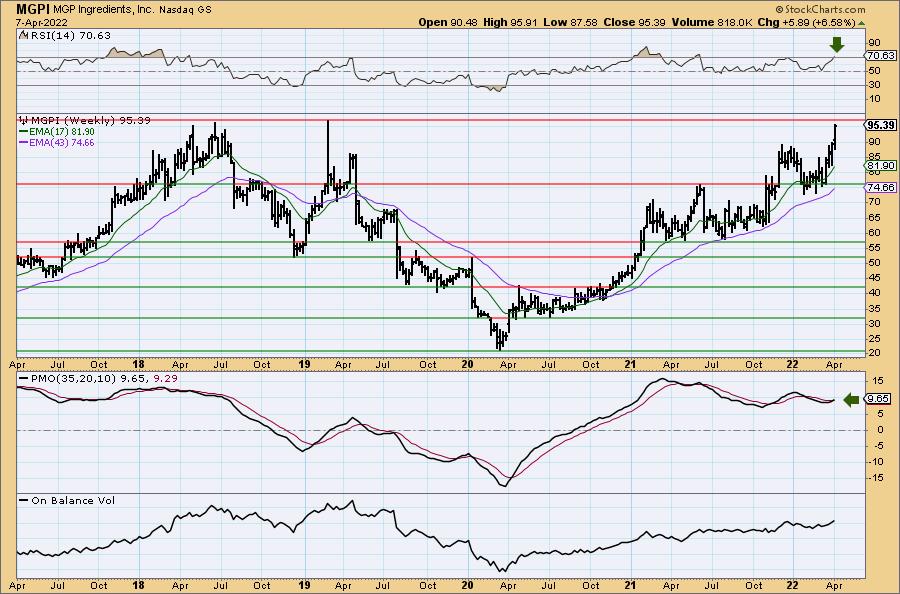
The weekly chart looks bullish. The only detractor is that price is about to hit overhead resistance at all-time highs. The weekly RSI is also slightly overbought. The weekly PMO just had a crossover BUY signal and the OBV has been rising steadily since the 2020 bottom. Given it is at all time highs consider a 14% target around $108.74.
Don't forget, on Thursdays I look at reader-requested symbols, click HERE to shoot me an email. I read every email I receive and try to answer them all!
Current Market Outlook:
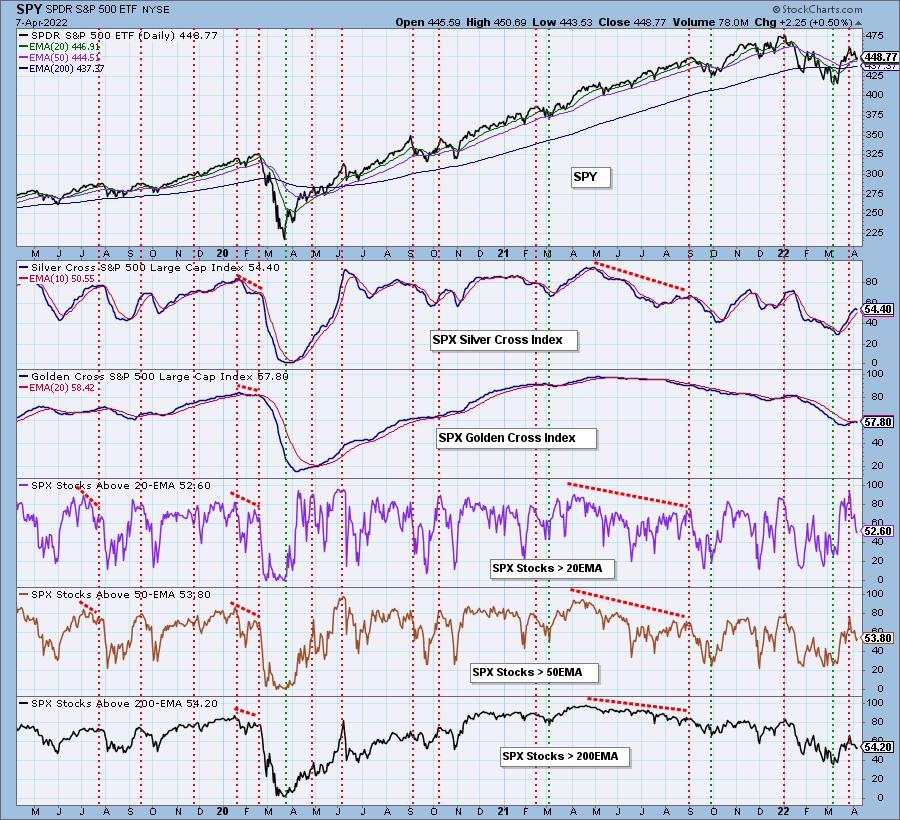
Market Environment: It is important to consider the odds for success by assessing the market tides. The following chart uses different methodologies for objectively showing the depth and trend of participation for intermediate- and long-term time frames.
- The Silver Cross Index (SCI) shows the percentage of SPX stocks on IT Trend Model BUY signals (20-EMA > 50-EMA)
- The Golden Cross Index (GCI) shows the percentage of SPX stocks on LT Trend Model BUY signals (50-EMA > 200-EMA)
Don't forget that as a "Diamonds" member, you have access to our GCI/SCI curated ChartList on DecisionPoint.com. You'll find it under "Members Only" links on the left side on the Blogs and Links Page.
Here is the current chart:
Full Disclosure: I'm 15% invested and 85% is in 'cash', meaning in money markets and readily available to trade with.
I'm required to disclose if I currently own a stock and/or may buy it within the next 72 hours.
Good Luck and Good Trading!
- Erin
"Technical Analysis is a windsock, not a crystal ball." - Carl Swenlin
(c) Copyright 2022 DecisionPoint.com
Watch the latest episode of DecisionPoint with Carl & Erin Swenlin on Mondays 7:00p EST or on the DecisionPoint playlist on the StockCharts TV YouTube channel here!
NOTE: The stocks reported herein are from mechanical trading model scans that are based upon moving average relationships, momentum and volume. DecisionPoint analysis is then applied to get five selections from the scans. The selections given should prompt readers to do a chart review using their own analysis process. This letter is not a call for a specific action to buy, sell or short any of the stocks provided. There are NO sure things or guaranteed returns on the daily selection of "Diamonds in the Rough."
Helpful DecisionPoint Links:
DecisionPoint Shared ChartList and DecisionPoint Chart Gallery
Price Momentum Oscillator (PMO)
Swenlin Trading Oscillators (STO-B and STO-V)
For more links, go to DecisionPoint.com