
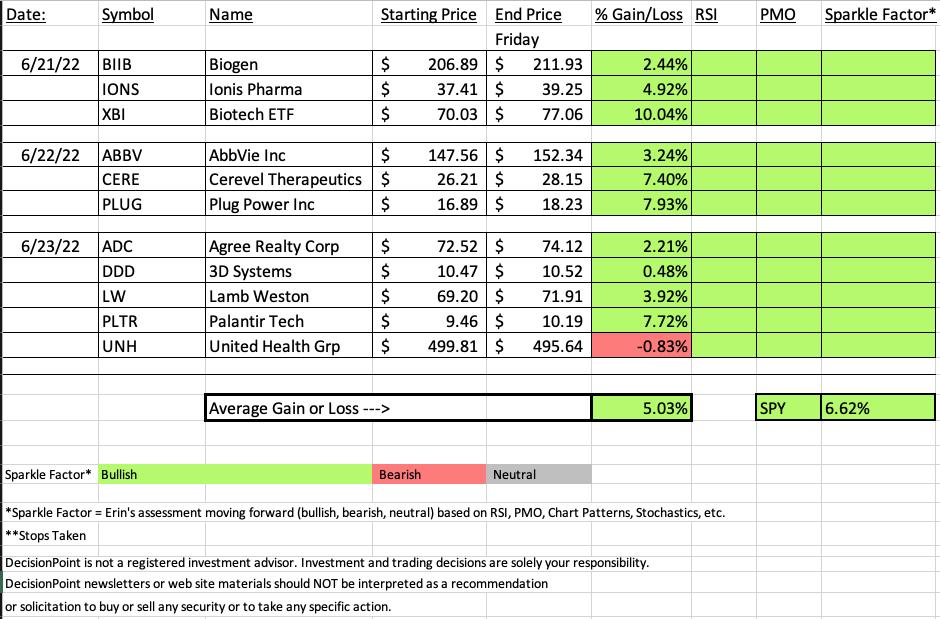
The SPY finished the week up +6.62% helping "Diamonds in the Rough" to finish up higher. All of this week's "Diamonds in the Rough" have plenty of upside available, but we do need to be careful should the SPY reverse course.
After reviewing the sectors this morning, it was clear that defensive sectors are finding favor again (XLP, XLU, XLRE and XLV). I've picked a "Sector to Watch", but all four of these sectors hold promise moving forward. A few industry groups that looked good this morning were Diversified REITs, Personal Products, Non-Durable Goods, Drug Retailers and Aerospace as well as the Water industry group (remember AWK?).
I'll keep this short. I will be traveling over 4th of July weekend, but it will not affect publishing of either of our reports. Don't forget to follow me on Twitter: @_DecisionPoint. Our Bear Market Special is running for new subscribers, but if you'd like to add the DP Alert, I will offer it to you at $9 for your first month. Simply send me an email and I'll fix you up!
Next Diamonds report will be on Tuesday, June 28th and the DP Free Trading Room will be this Monday (6/27) at Noon ET.
Good Luck & Good Trading,
Erin

RECORDING LINK (6/24/2022):
Topic: DecisionPoint Diamond Mine (6/24/2022) LIVE Trading Room
Start Time: Jun 24, 2022 09:02 AM
Meeting Recording Link
Access Passcode: June#24th
REGISTRATION FOR Friday 7/1 Diamond Mine:
When: Jul 1, 2022 09:00 AM Pacific Time (US and Canada)
Topic: DecisionPoint Diamond Mine (7/1/2022) LIVE Trading Room
Register in advance for this webinar HERE.
Save the registration confirmation email with login instructions in case Zoom doesn't notify you in time.

Free DP Trading Room (6/13/2022) RECORDING LINK:
Topic: DecisionPoint Trading Room
Start Time: Jun 21, 2022 08:59 AM
Meeting Recording Link
Access Passcode: June@21st
For best results, copy and paste the access code to avoid typos.
A few items about the spreadsheet: I've put on the spreadsheet whether the RSI is positive (green) or negative (red). The PMO column tells you if it is rising (green) or falling (red). Finally I've added my own "Sparkle Factor" that gives you my assessment going forward, bullish (green), bearish (red) or neutral (gray). The Sparkle Factor is basically my thoughts on whether I expect it to rise or fall. A neutral means it could really go either way so it could be added to a watch list. If you're in a stock I consider "neutral" going forward, the ball is in your court.
Darling:
SPDR S&P Biotech ETF (XBI)
EARNINGS: N/A
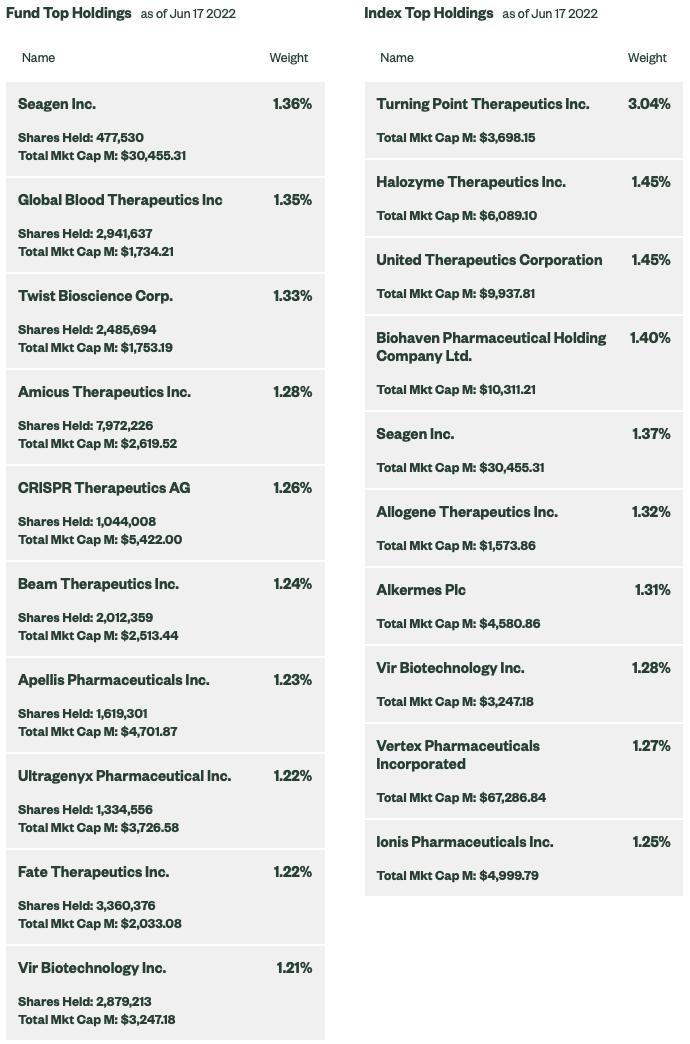
XBI tracks an equal-weighted index of US biotechnology stocks.
Predefined Scans Triggered: P&F High Pole.
Below are the commentary and chart from Tuesday (6/21):
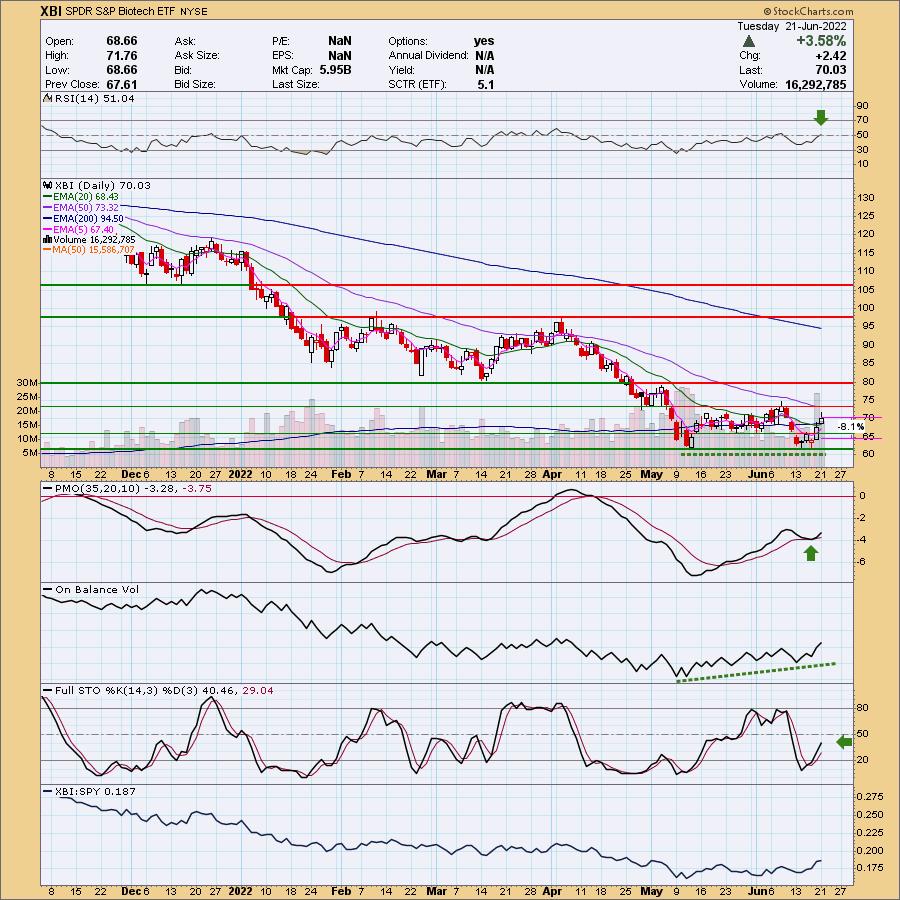
"XBI is down -0.04% in after hours trading. Like BIIB, XBI is in a trading range and is coming up against resistance. I am looking for a breakout. The RSI just moved into positive territory. The PMO has bottomed above the signal line. There is a positive OBV divergence leading into the current rally. Stochastics reversed sharply and are rising quickly. XBI is beginning to show some outperformance against the SPY. I set the stop beneath the end of May lows."
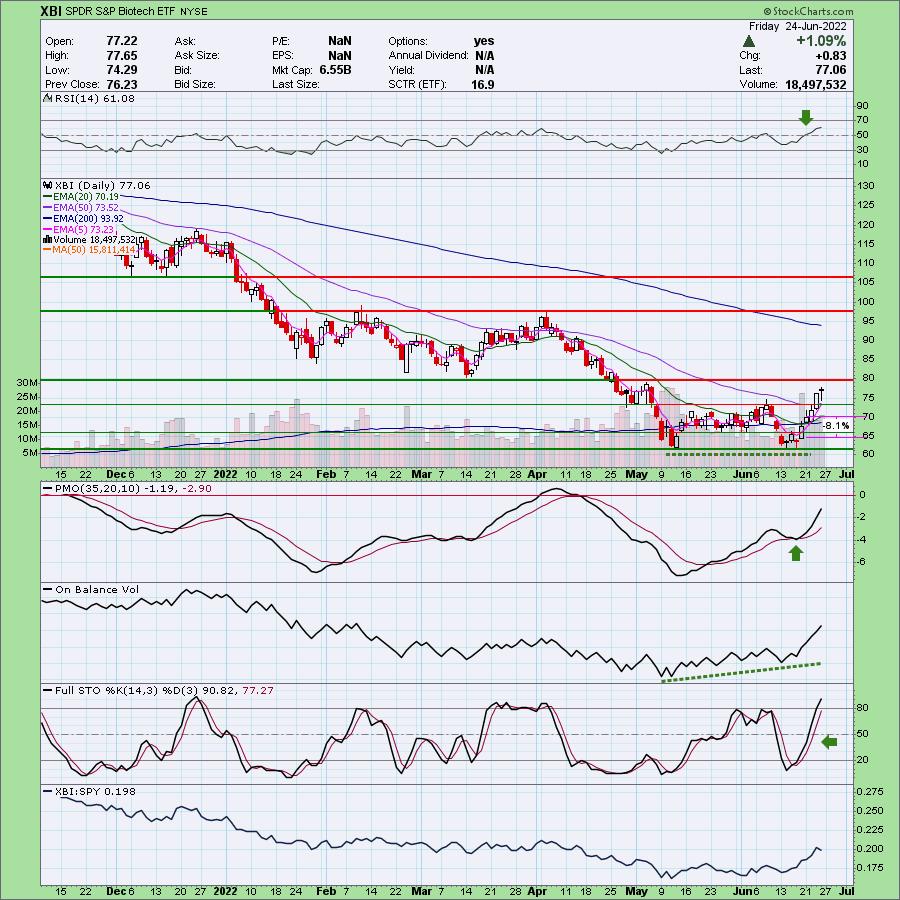
Here is today's chart:
All of the symbols this week are showing no sign of real deterioration. XBI did form a filled black candlestick which is a bearish one-day pattern, but the rising trend looks great. Price has overcome the 50-day EMA. The challenge ahead will be overhead resistance at $80. However, given the strength of the indicators, I would expect to see a breakout.
Full Disclosure: I own XBI.
Don't forget, on Thursdays I look at reader-requested symbols, so shoot me an email at erin@decisionpoint.com. I read every email I receive and try to answer them all!
Dud:
Unitedhealth Group, Inc. (UNH)
EARNINGS: 7/15/2022 (BMO)
UnitedHealth Group, Inc. engages in the provision of health care coverage, software, and data consultancy services. It operates through the following segments: UnitedHealthcare, OptumHealth, OptumInsight, and OptumRx. The UnitedHealthcare segment utilizes Optum's capabilities to help coordinate patient care, improve affordability of medical care, analyze cost trends, manage pharmacy benefits, work with care providers more effectively, and create a simpler consumer experience. The OptumHealth segment provides health and wellness care, serving the broad health care marketplace including payers, care providers, employers, government, life sciences companies, and consumers. The OptumInsight segment focuses on data and analytics, technology, and information to help major participants in the healthcare industry. The OptumRx segment offers pharmacy care services. The company was founded by Richard T. Burke in January 1977 and is headquartered in Minnetonka, MN.
Predefined Scans Triggered: Entered Ichimoku Cloud and P&F Double Top Breakout.
Below are the chart and commentary from yesterday (6/23):
"UNH is down -0.32% in after hours trading. I covered this on August 19th 2021 (the position is closed). We have a large double-bottom pattern that will be confirmed with a breakout above the late May top. The conservative upside target of the pattern would put price around $560, meaning a breakout above the April top. The RSI is positive and rising. The PMO just triggered a crossover BUY signal. There is a slight positive OBV divergence that led into this strong rally. Stochastics moved above 80 today. The group is having a great month against the SPY and this one generally outperforms the group. The stop is set at the 200-day EMA."
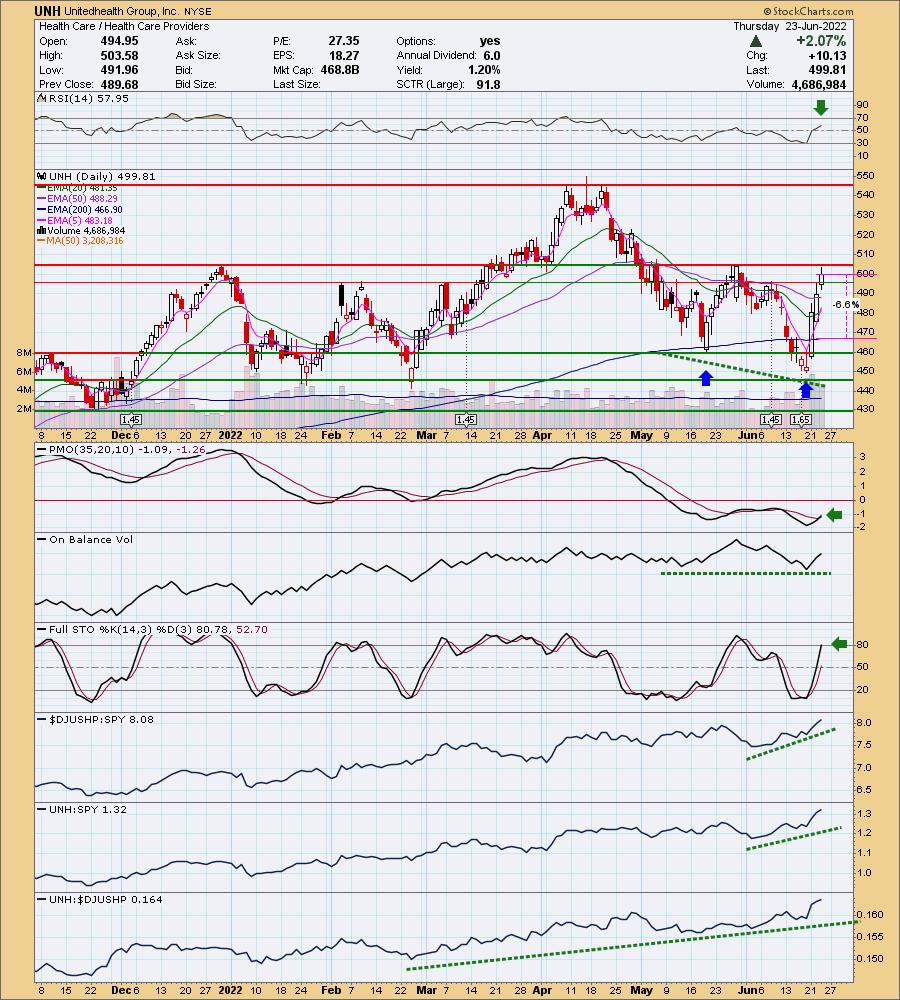
Here is today's chart:
Price has pulled back after reaching resistance. The indicators aren't really breaking down which is why I left this with a green Sparkle Factor. Hindsight being 20/20, you might want to wait for an actual breakout before hopping on this one.
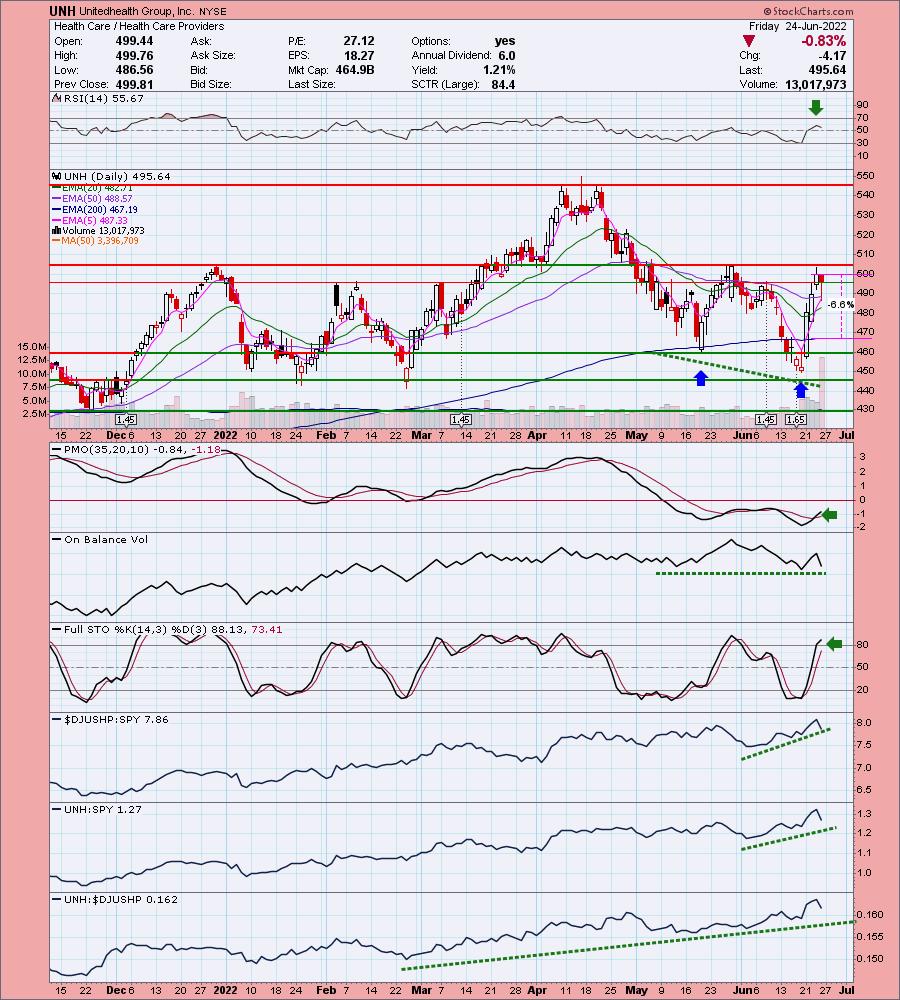
THIS WEEK's Sector Performance:
DecisionPoint Sector Scoreboard (Mechanical Trend Model Signals):

Click Here to view Carl's annotated Sector ChartList!
RRG® Daily Chart ($ONE Benchmark):
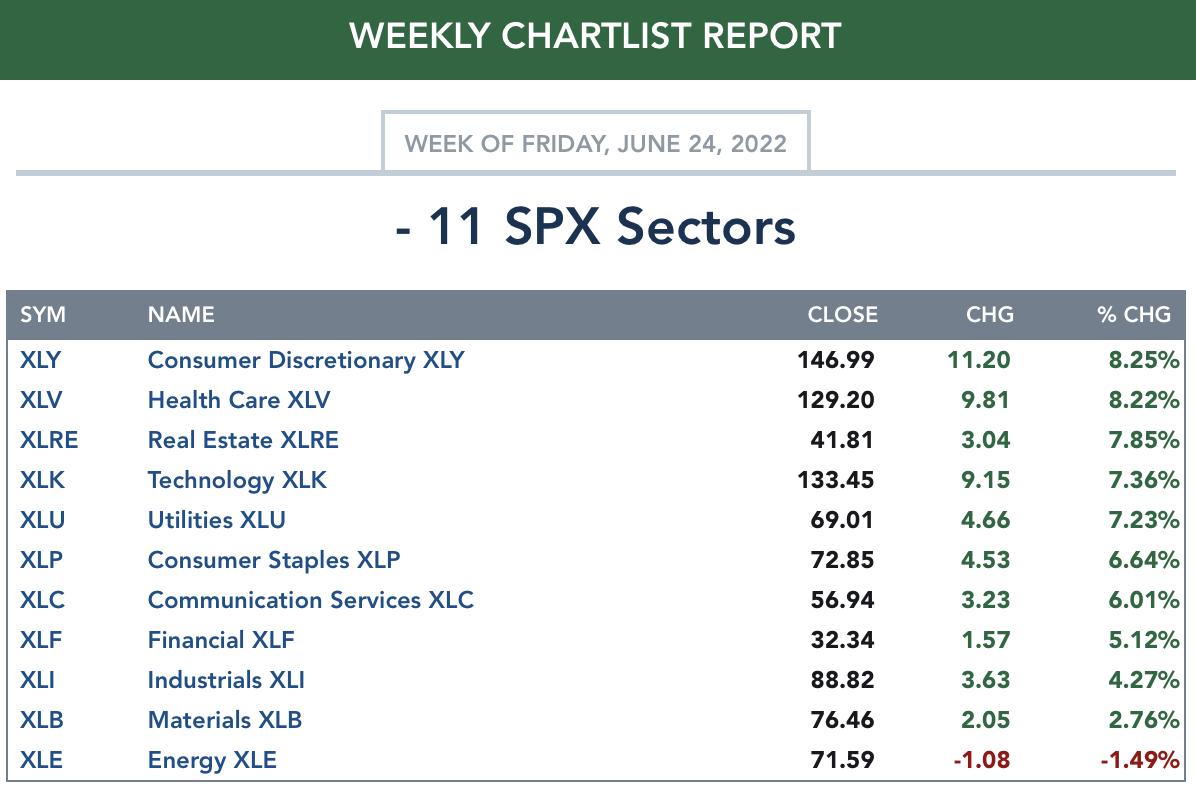
Given the overall bear market environment, it isn't surprising to see all of the sectors in the Lagging quadrant. What is very interesting is that all but XLE are starting to curl up toward the Improving quadrant (not shown, but above Lagging quadrant). In particular, three defensive sectors are closer than the others to the Improving quadrant: XLP, XLV and XLRE. This RRG clearly shows that short-term strength is upon us.
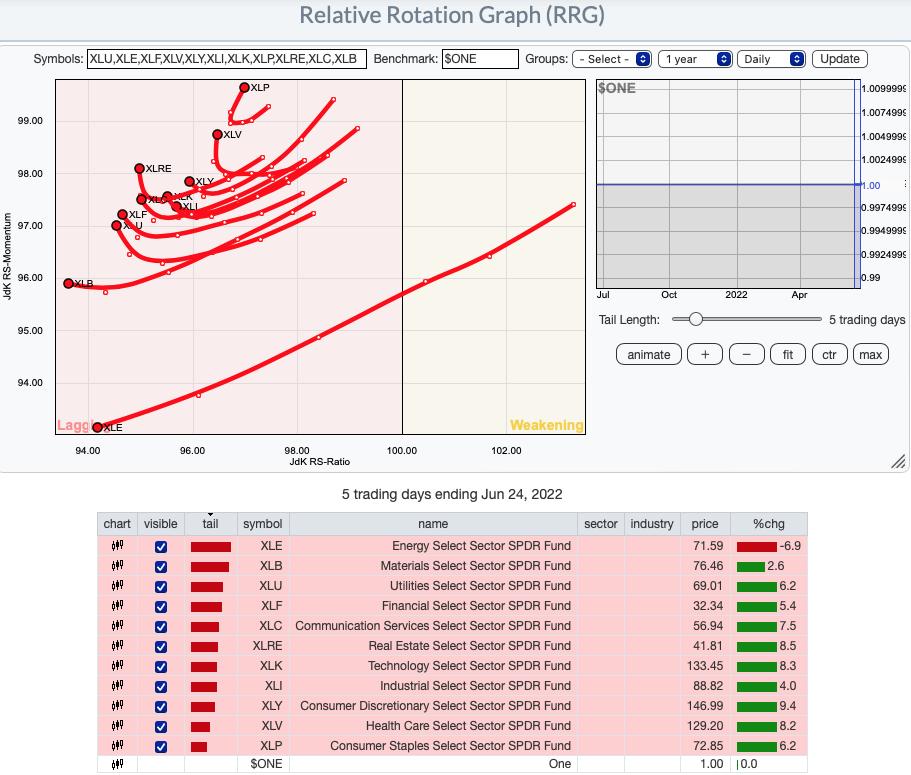
RRG® Weekly Chart ($ONE Benchmark):
In the long term, all sectors are showing the effects of a bear market. All have bearish southwest headings with the exception of Technology (XLK). This surprises us given the daily RRG is still showing a negative southwest heading for XLK. Just remember that XLK is still Lagging, but a bear market rally should see the sector continue toward the Improving quadrant given it is the primary driver of the overall market.
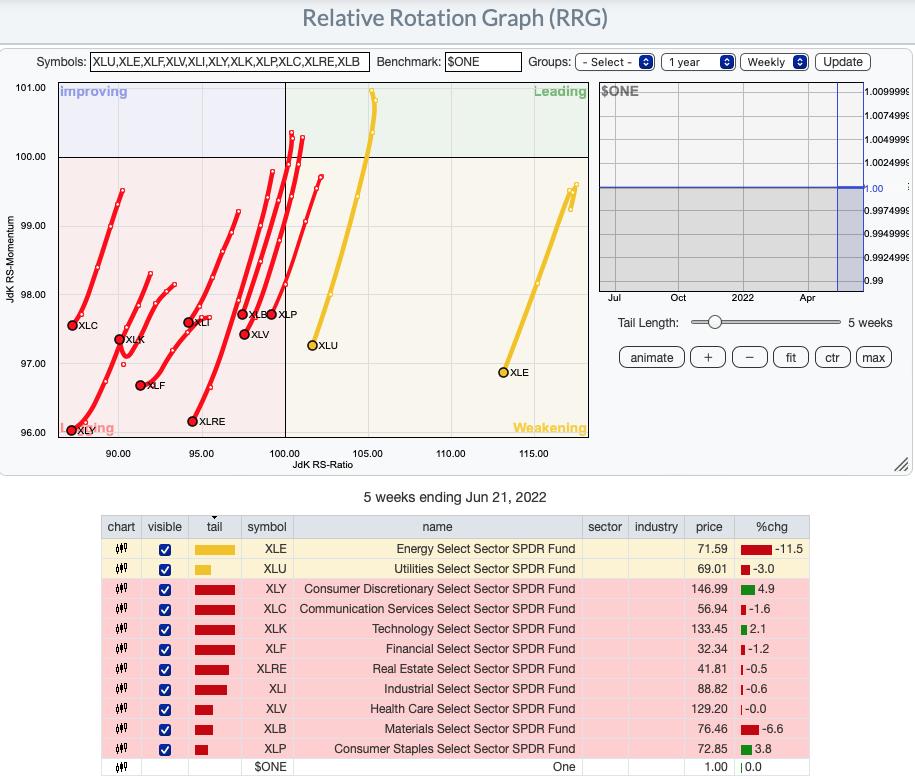
RRG® charts show you the relative strength and momentum for a group of stocks. Stocks with strong relative strength and momentum appear in the green Leading quadrant. As relative momentum fades, they typically move into the yellow Weakening quadrant. If relative strength then fades, they move into the red Lagging quadrant. Finally, when momentum starts to pick up again, they shift into the blue Improving quadrant.
CLICK HERE for an animated version of the RRG charts.
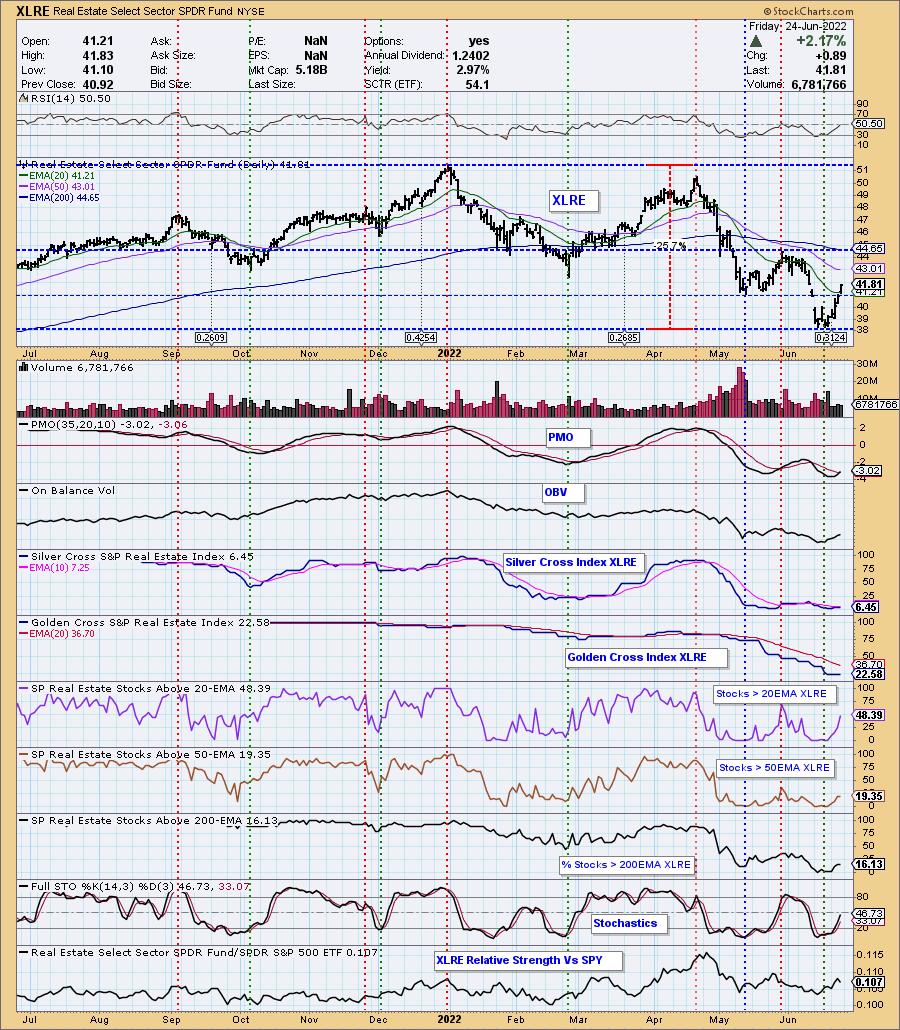
Sector to Watch: Real Estate (XLRE)
Honestly this was actually an easy choice given the price pattern and the fact that it isn't at overhead resistance or already has run up too quickly. I do have to say that XLC and XLY looked very interesting, but given the rotation toward more defensive areas of the market, this sector looks the best.
We discussed "bull stacks" during the Diamond Mine trading room today. A bull stack is when we have %Stocks above their 20-day EMA which is greater than the %Stocks above their 50-day EMA which is above the %Stocks above their 200-day EMA. This shows the sector is improving, particularly if the EMAs of sector members are configured as XLRE's with the slowest EMA on top and fastest on the bottom.
I like today's strong breakout above the 20-day EMA and overhead resistance. Both of the gaps from last week have just about been covered and that implies follow-through on this rally. The RSI just moved into positive territory. The PMO triggered a crossover BUY signal today. Stochastics are rising nicely. Relative strength is better than the SPY even as the SPY finished the week up over 6%. I really don't see any reason why this sector won't reach overhead resistance at the late May top.
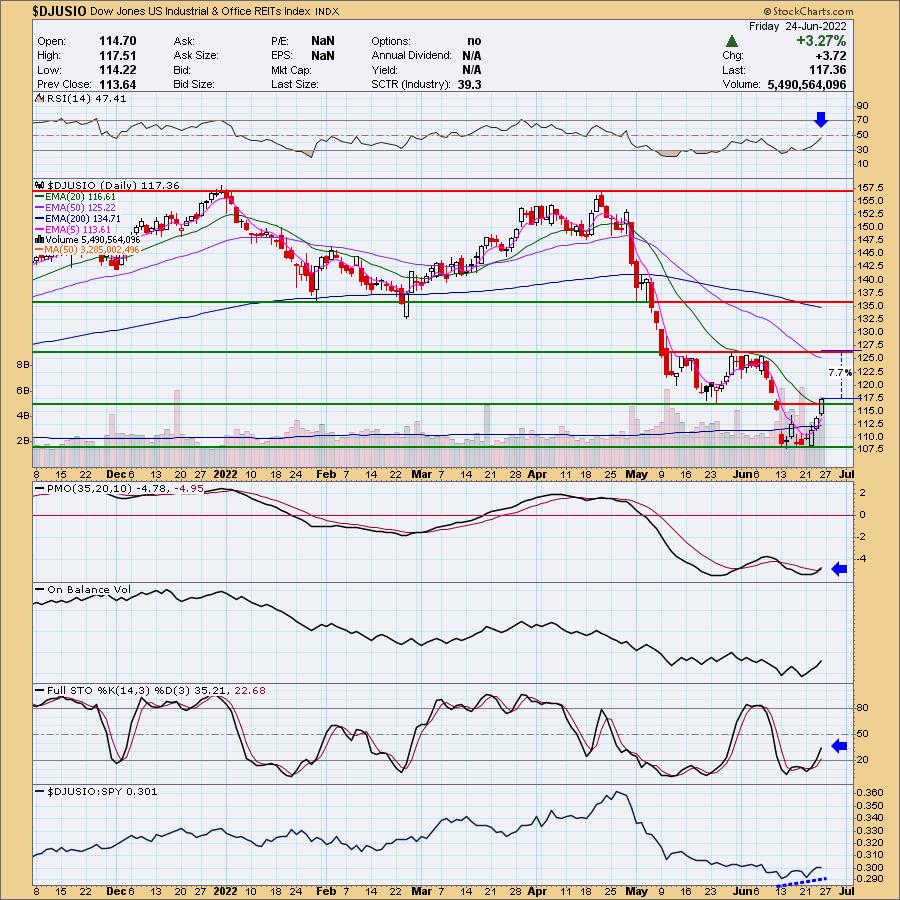
Industry Group to Watch: Industrial & Office REITs ($DJUSDT)
I had laugh and pat myself on the back. In today's Diamond Mine I really liked Diversified REITs. Guess what? It was the industry group to watch last week! I still like it, but as the market closed, I decided to go with Industrial & Office REITs. It has more potential upside and the rally is in its infancy. The RSI is negative, but should hit positive territory soon. The PMO triggered a crossover BUY signal on this beautiful breakout above both the 20-day EMA and resistance at the May low. Stochastics are in negative territory but are rising strongly. A few symbols that I liked in this group are: COLD, DLR, DRE and PLD.
Go to our Sector ChartList on DecisionPoint.com to get an in-depth view of all the sectors.
Have a great weekend! Good Luck & Good Trading!
- Erin
erin@decisionpoint.com
Full Disclosure: I'm 15% exposed.
Watch the latest episode of DecisionPoint with Carl & Erin Swenlin on Mondays 7:00p EST or on the DecisionPoint playlist on the StockCharts TV YouTube channel here!
Technical Analysis is a windsock, not a crystal ball. --Carl Swenlin
NOTE: The stocks reported herein are from mechanical trading model scans that are based upon moving average relationships, momentum and volume. DecisionPoint analysis is then applied to get five selections from the scans. The selections given should prompt readers to do a chart review using their own analysis process. This letter is not a call for a specific action to buy, sell or short any of the stocks provided. There are NO sure things or guaranteed returns on the daily selection of "diamonds in the rough."
Helpful DecisionPoint Links:
DecisionPoint Shared ChartList and DecisionPoint Chart Gallery
Price Momentum Oscillator (PMO)
Swenlin Trading Oscillators (STO-B and STO-V)
(c) Copyright 2022 DecisionPoint.com