
I did not see any emerging themes in the scan results today. However, I did find quite a few interesting picks and watchlist material. The market is extremely overbought. I haven't added to my portfolio so I remain at 60% exposed. It seems to me that we will be seeing a pullback soon, but we've all been thinking this and the market keeps moving higher.
Renewable Energy stocks and ETF (TAN) are beginning to consolidate. I don't think it is too late. Keep CHPT in your watch lists, I am stalking that one. It was presented last Thursday. While it isn't a solar stock, it has its finger in the pie of green energy. They make charging stations for EVs and given the government's emphasis on EVs, this infrastructure will be critical.
Hope you like today's "Diamonds in the Rough". Be sure to keep the "Runners-up" a glance--more watch list material.
Good Luck & Good Trading!
Erin
Today's "Diamonds in the Rough": AMCR, LWLG and OLLI.
"Runners-up": SWK, RGP, PLUS, VVV, ECVT, ALGT and DORM.

RECORDING LINK (8/12/2022):
Topic: DecisionPoint Diamond Mine (8/12/2022) LIVE Trading Room
Start Time: Aug 12, 2022 08:59 AM
Meeting Recording Link
Access Passcode: August#12
REGISTRATION FOR Friday 8/19 Diamond Mine:
When: Aug 19, 2022 09:00 AM Pacific Time (US and Canada)
Topic: DecisionPoint Diamond Mine (8/19/2022) LIVE Trading Room
Register in advance for this webinar HERE
Save the registration confirmation email with login instructions in case Zoom doesn't notify you in time.

Unfortunately there is no recording for yesterday's DecisionPoint Trading Room so here is a copy of the one we did 2 weeks ago:
Welcome to DecisionPoint Daily Diamonds, wherein I highlight ten "Diamonds in the Rough" per week. These are selected from the results of my DecisionPoint Scans, which search for stocks that could benefit from the trend and condition of the market. Remember, these are not recommendations to buy or sell, but are the most interesting of the stocks that surfaced in my scans. My objective is to save you the work of the initial, tedious culling process, but you need to apply your own analysis to see if these stocks pique your interest as well. There are no guaranteed winners here!
"Predefined Scans Triggered" are taken from StockCharts.com using the "Symbol Summary" option instead of a "SharpChart" on the workbench.
Amcor plc (AMCR)
EARNINGS: 8/17/2022 (AMC) ** Reports TOMORROW **
Amcor Plc operates as a holding company, which engages in the consumer packaging business. It operates through the Flexibles and Rigid Packaging segments. The Flexibles segment develops and supplies flexible packaging globally. The Rigid Plastics segment manufactures rigid plastic containers and related products. The company was founded 1926 and is headquartered in Warmley, the United Kingdom.
Predefined Scans Triggered: Moved Above Upper Bollinger Band, Stocks in a New Uptrend (Aroon) and Moved Above Upper Price Channel.
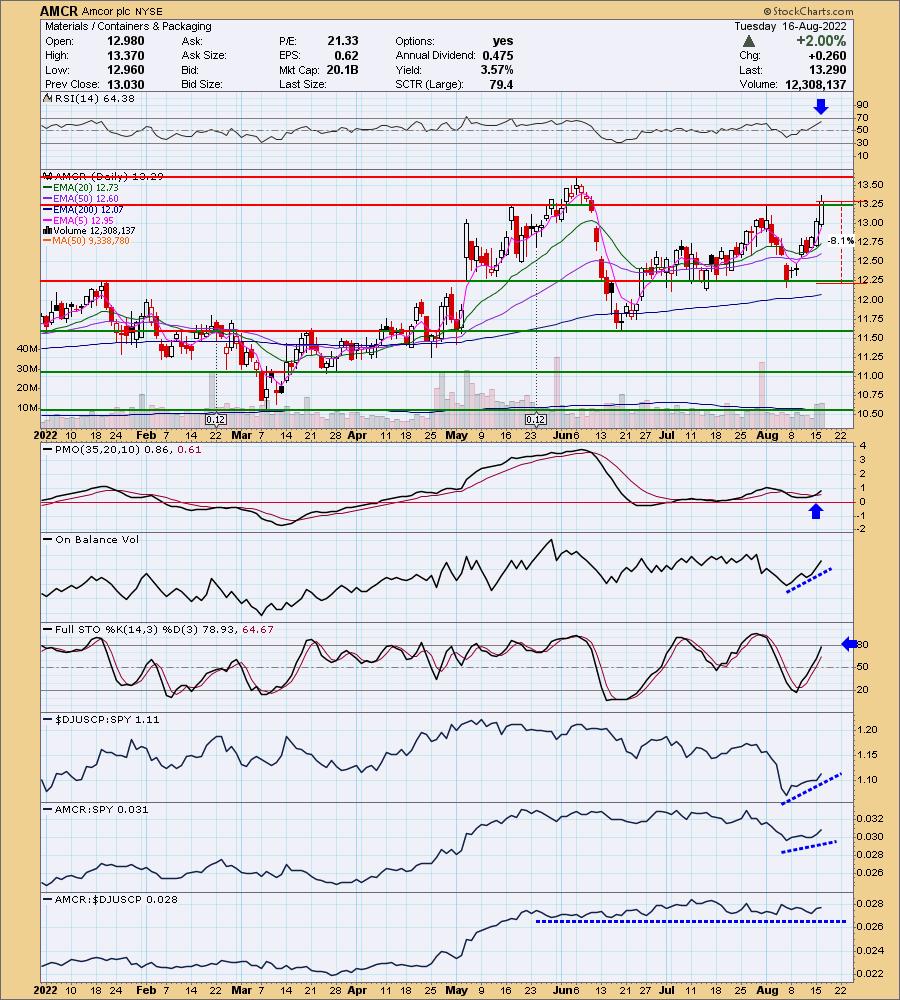
AMCR is up +0.15% in after hours trading. They report earnings TOMORROW after the bell. I covered AMCR on June 29th 2022 (position is open and up 5.90%). I like today breakout accompanied by strong indicators. The RSI is positive and not overbought. The PMO is coming off an oversold crossover BUY signal just above the zero line. The OBV is currently confirming the move. Stochastics are rising and are near 80. Relative strength for the group is increasing quite a bit and while AMCR isn't one of the stellar outperformers within the group, it does mimic what the group does. A strong group means AMCR should continue to outperform. The stop is set below support by 8.1% or around $12.21.
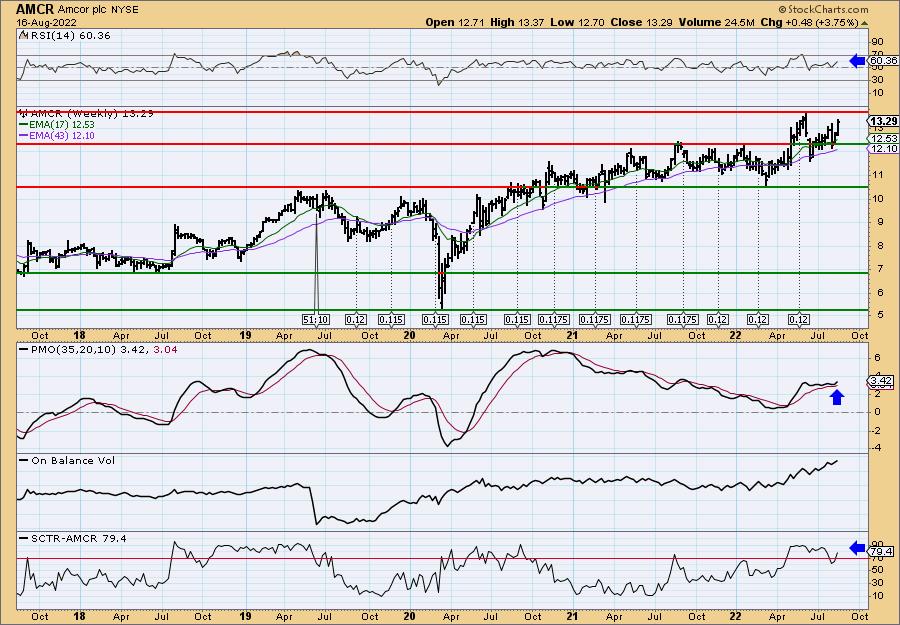
AMCR overcame a very long-term trading channel. It did end up back in it but bounced off the 43-week EMA constructively. The weekly PMO turned up above its signal line for the third time this year. The weekly RSI is positive. It is now headed to all-time highs consider an upside target of about 17% or $$15.55.
Lightwave Logic, Inc. (LWLG)
EARNINGS: 11/9/2022 (AMC)
Lightwave Logic, Inc. is a development stage company which engages in the commercialization of electro-optic photonic devices. The firm offers the P2ICTM technology platform which uses in-house proprietary organic polymers. Its products include electro-optical modulation devices and proprietary polymer photonic integrated circuits. The company was founded on June 24, 1997 and is headquartered in Englewood, CO.
Predefined Scans Triggered: None.
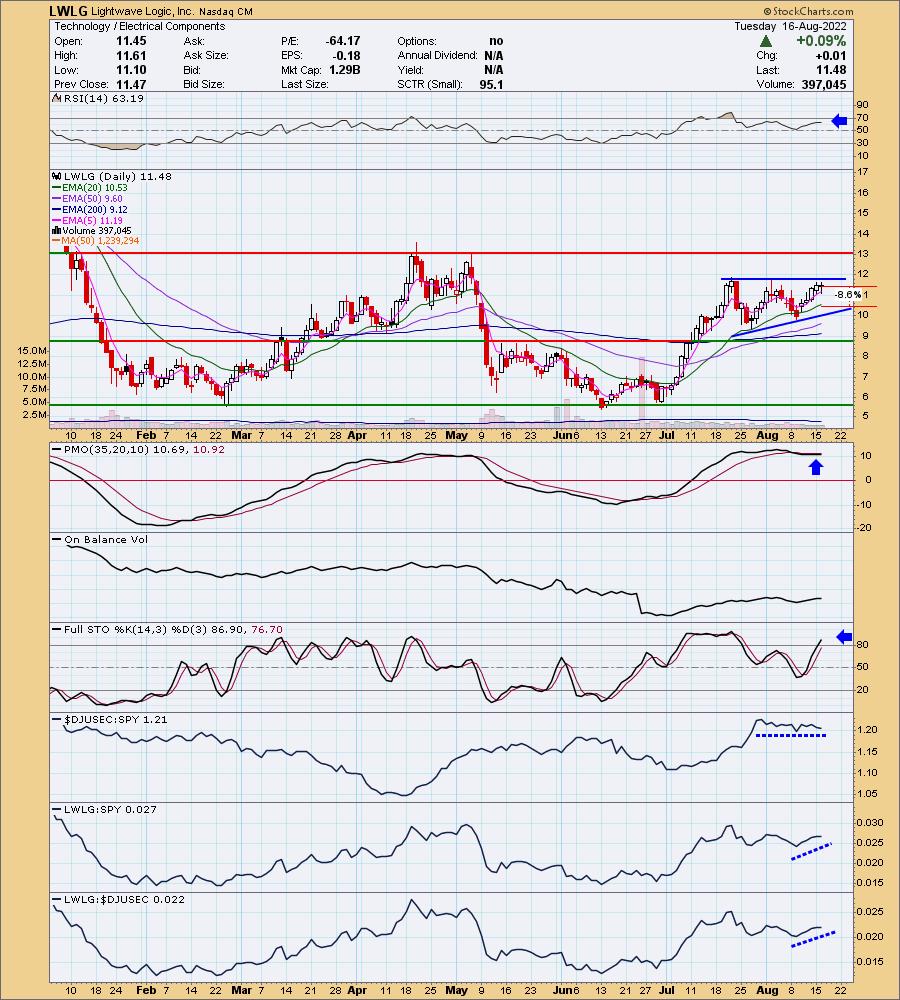
LWLG is down -1.57% in after hours trading. What excited me about the chart was the clean ascending triangle pattern (flat top, rising bottoms). Today's filled black candlestick and after hours trading suggest this one may decide to go back down and test the bottom of the pattern so you might want to hold off on a purchase. This one has been added to my personal watch list. The RSI is positive and not overbought. The PMO is rising again and is going in on a crossover BUY signal. Stochastics are rising above 80. The group is performing inline with the SPY, but LWLG is outperforming both the group and SPY. Consider stop of 8.6%, below the 20-day EMA around $10.50.
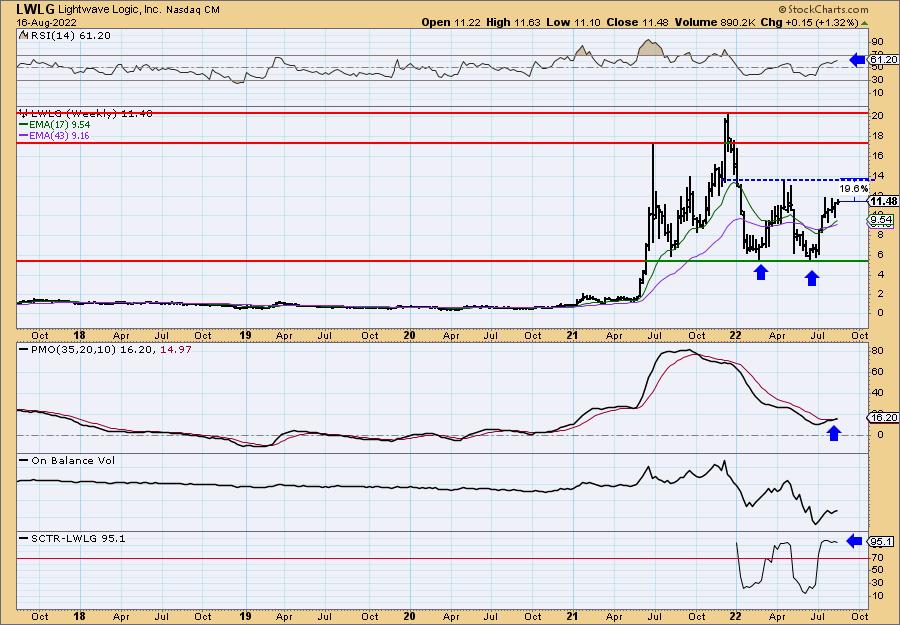
I love this weekly chart. The weekly RSI is positive and not overbought. But best are the new weekly PMO BUY signal and 95.1% SCTR! There is a large bullish double-bottom pattern. If it gets to the confirmation line, that would be an over 19.5% gain. If it fulfills the upside target of the double-bottom pattern we could see far higher gains with price moving to new all-time highs.
Ollie's Bargain Outlet Holdings Inc. (OLLI)
EARNINGS: 8/25/2022 (BMO)
Ollie's Bargain Outlet Holdings, Inc. is a holding company, which engages in the retail of closeouts, excess inventory, and salvage merchandise. It offers overstocks, package changes, manufacturer refurbished goods, and irregulars. The company's products include housewares, food, books and stationery, bed and bath, floor coverings, electronics and toys. Ollie's Bargain Outlet Holdings was founded by Mark Butler, Mort Bernstein, Oliver Rosenberg and Harry Coverman on July 29, 1982, and is headquartered in Harrisburg, PA.
Predefined Scans Triggered: New CCI Buy Signals, P&F Double Top Breakout and P&F Triple Top Breakout.
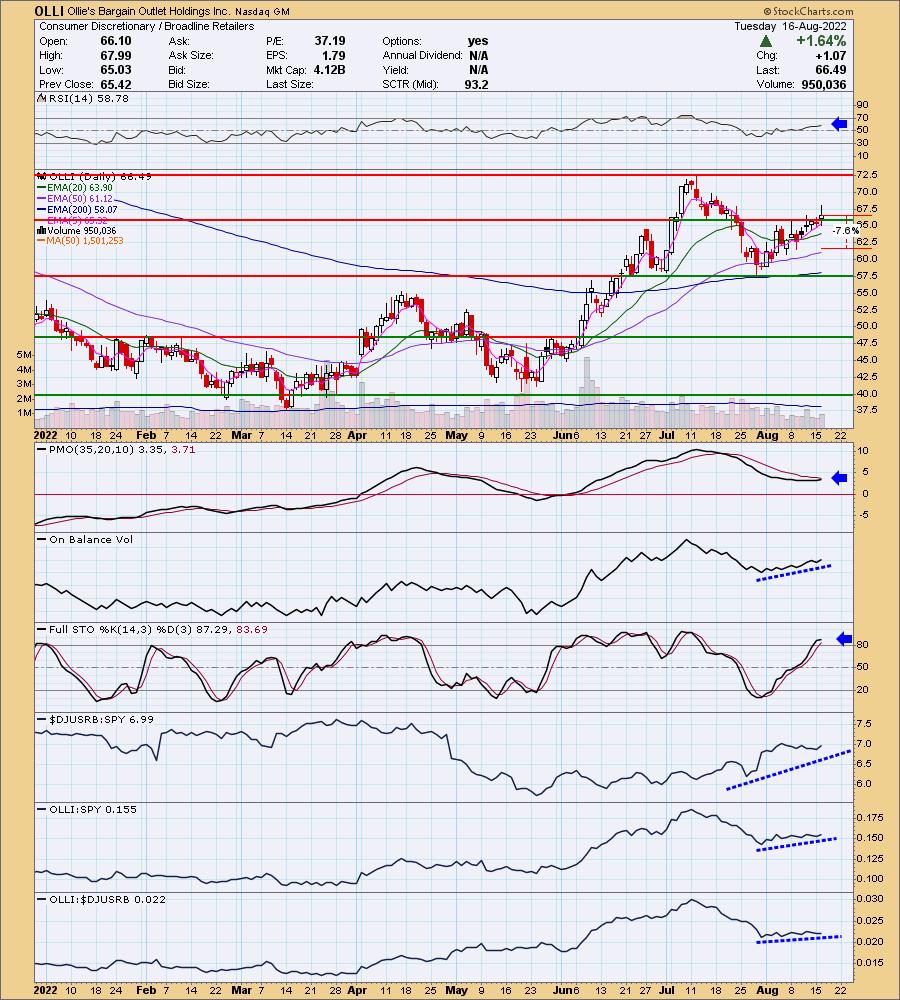
OLLI is up +0.17% in after hours trading. I covered OLLI on July 29th 2020 (position stopped out). Big retailers like Walmart, Home Depot and Lowes are reporting good earnings and I believe OLLI will benefit. However, I'm all about the technicals and they are very good. Today it broke out above short-term resistance. The RSI is positive and the PMO is going in for a crossover BUY signal. The OBV is confirming the rally and Stochastics are above 80. The group is outperforming and OLLI is outperforming the market slightly. Consider a stop around the 50-day EMA at 7.6% or $10.61.
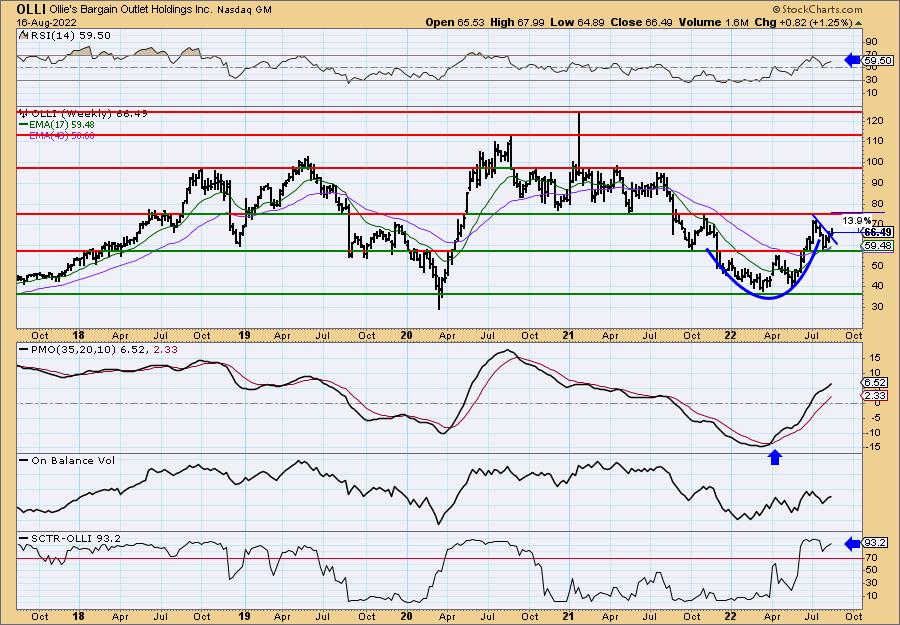
Gotta love the weekly chart. I see a loose cup with handle chart pattern and this week would mean a breakout from the pattern. The weekly RSI is positive and not overbought. The weekly PMO is rising strongly and isn't overbought. The SCTR is top notch at 93.2%. I have an upside target at resistance, but I am looking for a move to $100.
Don't forget, on Thursdays I look at reader-requested symbols, click HERE to send me an email. I read every email I receive and try to answer them all!
Current Market Outlook:
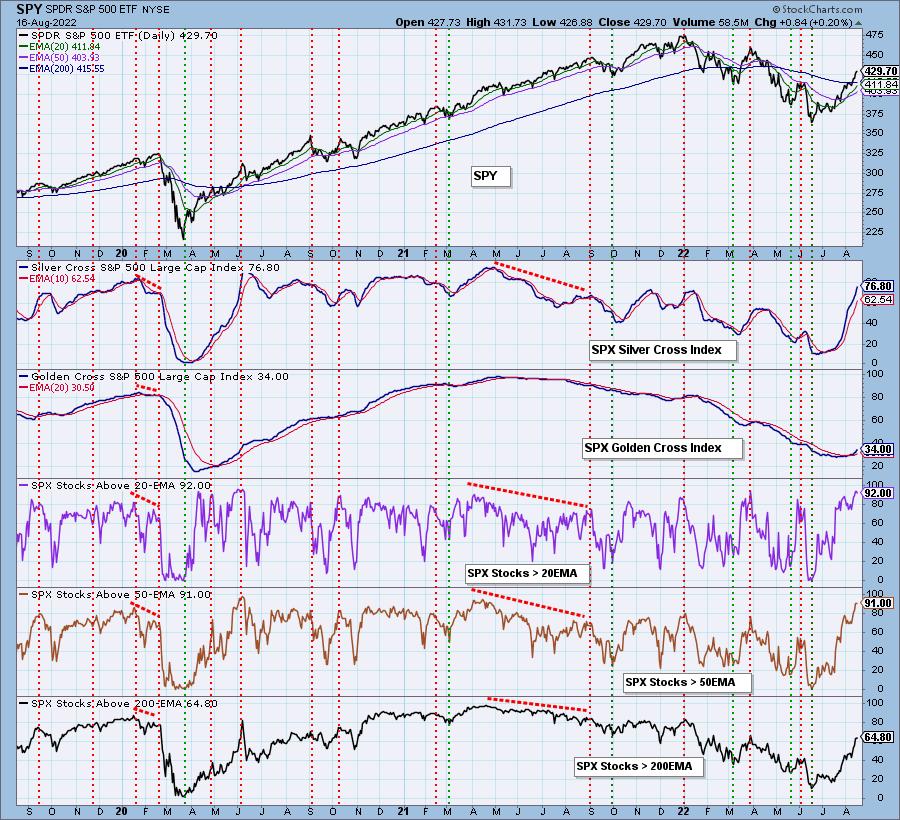
Market Environment: It is important to consider the odds for success by assessing the market tides. The following chart uses different methodologies for objectively showing the depth and trend of participation for intermediate- and long-term time frames.
- The Silver Cross Index (SCI) shows the percentage of SPX stocks on IT Trend Model BUY signals (20-EMA > 50-EMA)
- The Golden Cross Index (GCI) shows the percentage of SPX stocks on LT Trend Model BUY signals (50-EMA > 200-EMA)
Don't forget that as a "Diamonds" member, you have access to our GCI/SCI curated ChartList on DecisionPoint.com. You'll find it under "Members Only" links on the left side on the Blogs and Links Page.
Here is the current chart:
Full Disclosure: I am 60% exposed.
I'm required to disclose if I currently own a stock I mention and/or may buy/short it within the next 72 hours.
"Technical Analysis is a windsock, not a crystal ball." - Carl Swenlin
(c) Copyright 2022 DecisionPoint.com
Watch the latest episode of DecisionPoint with Carl & Erin Swenlin on Mondays 7:00p EST or on the DecisionPoint playlist on the StockCharts TV YouTube channel here!
NOTE: The stocks reported herein are from mechanical trading model scans that are based upon moving average relationships, momentum and volume. DecisionPoint analysis is then applied to get five selections from the scans. The selections given should prompt readers to do a chart review using their own analysis process. This letter is not a call for a specific action to buy, sell or short any of the stocks provided. There are NO sure things or guaranteed returns on the daily selection of "Diamonds in the Rough."
Regarding BUY/SELL Signals: The signal status reported herein is based upon mechanical trading model signals and crossovers. They define the implied bias of the price index/stock based upon moving average relationships and momentum, but they do not necessarily call for a specific action. They are information flags that should prompt chart review. Further, they do not call for continuous buying or selling during the life of the signal. For example, a BUY signal will probably (but not necessarily) return the best results if action is taken soon after the signal is generated. Additional opportunities for buying may be found as price zigzags higher, but the trader must look for optimum entry points. Conversely, exit points to preserve gains (or minimize losses) may be evident before the model mechanically closes the signal.
Helpful DecisionPoint Links:
DecisionPoint Shared ChartList and DecisionPoint Chart Gallery
Price Momentum Oscillator (PMO)
Swenlin Trading Oscillators (STO-B and STO-V)
For more links, go to DecisionPoint.com