
The market is being a bit coy as it digests prior weeks' rallies. The pockets of strength became apparent quickly as I reviewed scan results and did some outside research. I have two industry groups that have been racing higher. On Friday I discussed Autos. They seem to be consolidating with the market. However, TSLA is having a nice run to the upside. I still like that group.
I was prepared to see numerous Tech stocks in my scans. I saw mostly Software stocks, but I didn't care for their setups. I mentioned Renewable Energy last Friday in my opening. That group is on fire. I had to bring two to the table for you. The main problem is they were up so high today, they will likely see some pullback to breakout points. Their weekly charts look outstanding.
The final group I found to be especially bullish was Gambling stocks. There were quite a few choices. I opted to go with PENN, but you might want to look at RRR and INSE.
Good Luck & Good Trading!
Erin
Today's "Diamonds in the Rough": EVRI, PENN and TPIC.
Runners-Up: MED, PRO, FTNT, RRR and INSE.

RECORDING LINK (7/29/2022):
Topic: DecisionPoint Diamond Mine (7/29/2022) LIVE Trading Room
Start Time: Jul 29, 2022 08:59 AM
Meeting Recording Link
Access Passcode: July#29th
REGISTRATION FOR Friday 8/5 Diamond Mine:
When: Aug 5, 2022 09:00 AM Pacific Time (US and Canada)
Topic: DecisionPoint Diamond Mine (8/5/2022) LIVE Trading Room
Register in advance for this webinar HERE
Save the registration confirmation email with login instructions in case Zoom doesn't notify you in time.

StockChartsTV is now producing the recording for the free DP Trading Room! It airs at 3p ET, much sooner than I was able to get out the recording links. Carl has joined so you can "ask the master" all those questions you've always wanted his opinion on! If you haven't registered to attend live at Noon ET, you can do so HERE.
Welcome to DecisionPoint Daily Diamonds, wherein I highlight ten "Diamonds in the Rough" per week. These are selected from the results of my DecisionPoint Scans, which search for stocks that could benefit from the trend and condition of the market. Remember, these are not recommendations to buy or sell, but are the most interesting of the stocks that surfaced in my scans. My objective is to save you the work of the initial, tedious culling process, but you need to apply your own analysis to see if these stocks pique your interest as well. There are no guaranteed winners here!
"Predefined Scans Triggered" are taken from StockCharts.com using the "Symbol Summary" option instead of a "SharpChart" on the workbench.
Everi Holdings Inc. (EVRI)
EARNINGS: 8/3/2022 (BMO) *** REPORTS TOMORROW ***
Everi Holdings, Inc. engages in the provision of technology solutions to the casino, interactive and gaming industry. It operates through the following segments: Games and FinTech. The Games segment focuses on leased gaming equipment, sales of gaming equipment, gaming systems, interactive solutions and ancillary products and services. The FinTech segment provides access to cash at gaming facilities via ATM cash withdrawals, credit card cash access transactions and point of sale debit card cash access transactions, check-related services, fully integrated kiosks and maintenance services, compliance, audit and data software, casino credit data and reporting services and other ancillary offerings. The company was founded on February 4, 2004 and is headquartered in Las Vegas, NV.
Predefined Scans Triggered: Moved Above Upper Keltner Channel, Moved Above Upper Bollinger Band and P&F Double Top Breakout.
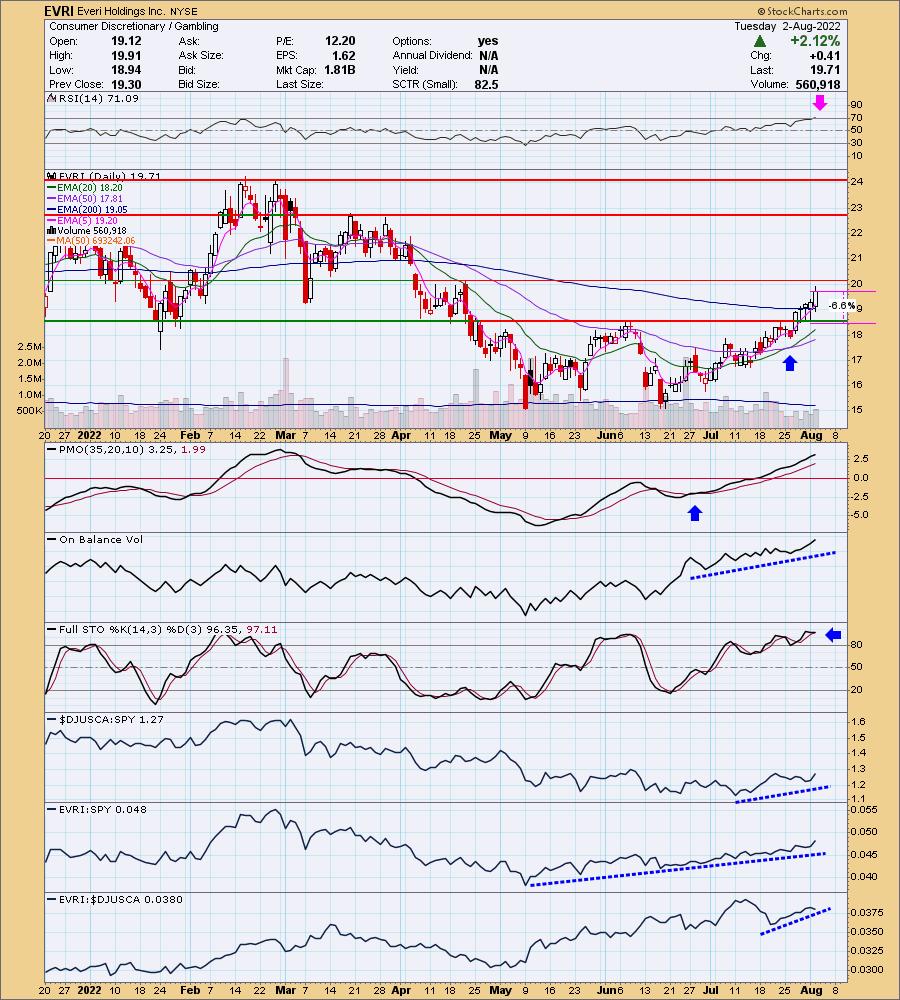
EVRI is up +1.22% in after hours trading. I lament that I didn't see this coming for Gambling stocks. However, I don't believe it is too late. EVRI reports earnings tomorrow so it could get interesting with either a pop up or pop down. I'm voting for a rally. Price spent its third day above the 200-day EMA. This "decisively" confirms the large double-bottom pattern. A decisive breakout or breakdown is 3%. The only problem on the chart is the overbought RSI. It doesn't usually go there and when it does, it doesn't generally end pretty. In any case, the OBV is confirming and Stochastics continue to oscillate above 80 implying internal strength. Relative strength is only now beginning to come back to the group as a whole. EVRI is a strong performer in the group and despite the group not doing well last month, EVRI held its own against the SPY. The stop is set below support around $18.41.
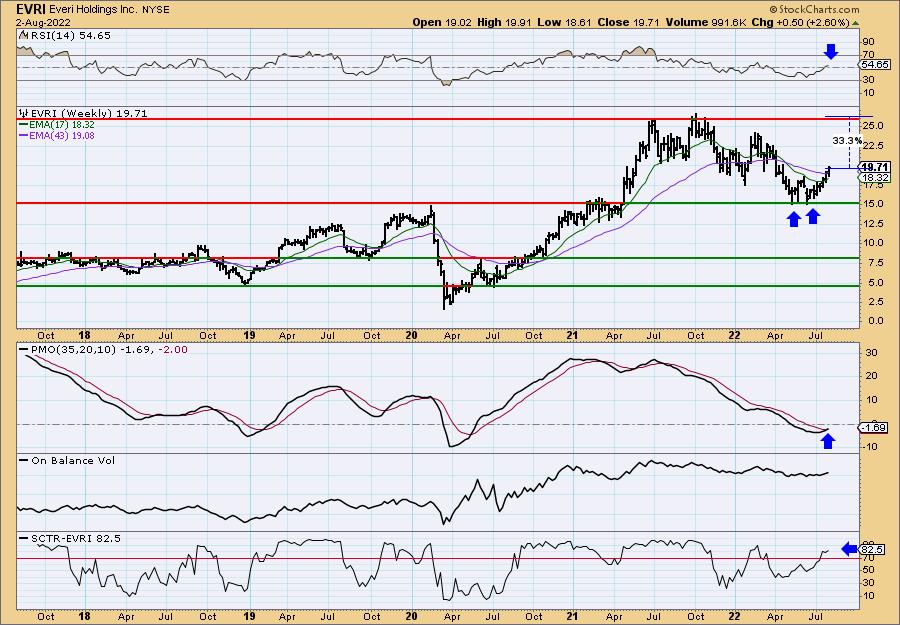
The weekly PMO is in the process of triggering a crossover BUY signal (the signal will not be "official" until close of business Friday). The weekly RSI is now in positive territory. The large double-bottom is visible on the weekly chart. The SCTR is very strong. If it can reach all-time highs, it would be around a 33% gain.
Penn National Gaming, Inc. (PENN)
EARNINGS: 8/4/2022 (BMO)
Penn National Gaming, Inc. owns and manages gaming and racing facilities and video gaming terminal operations with a focus on slot machine entertainment. It operates through the following business segments: Northeast, South, West, Midwest, and Other. The Northeast segment consists of properties including Ameristar East Chicago, Greektown Casino-Hotel, and Hollywood Casino Bangor. The South segment operates properties including 1st Jackpot Casino, Ameristar Vicksburg, and Boomtown Biloxi. The West segment includes Ameristar Black Hawk, Cactus Pete's and Horseshu, and M Resort. The Midwest segment consists of properties including Ameristar Council Bluffs, Argosy Casino Alton, and Argosy Casino Riverside. The Other segment manages properties including Freehold Raceway, Retama Park Racetrack, and Sanford-Orlando Kennel Club. The company was founded by Peter M. Carlino in 1982 and is headquartered in Wyomissing, PA.
Predefined Scans Triggered: Elder Bar Turned Green, New CCI Buy Signals, Moved Above Upper Price Channel and P&F Double Top Breakout.
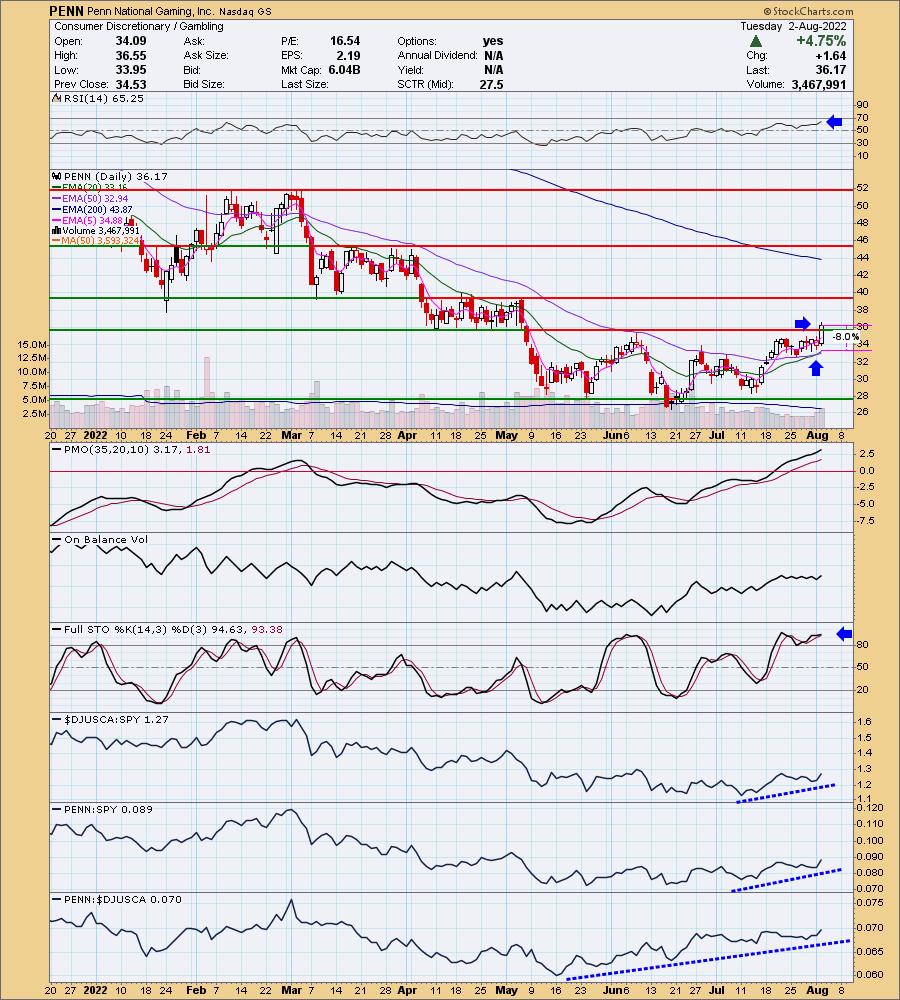
PENN is down -0.47% in after hours trading. I've covered it twice before in 2020: March 26th and April 30th. The stops were eventually hit so the positions are closed. Today's breakout occurred alongside a new IT Trend Model "Silver Cross" BUY signal (20-day EMA crossed above the 50-day EMA). The PMO is accelerating higher and the RSI is in positive territory/not overbought. Stochastics are oscillating above 80 indicating internal strength. Relative strength is also bullish. The stop is set at $33.28.
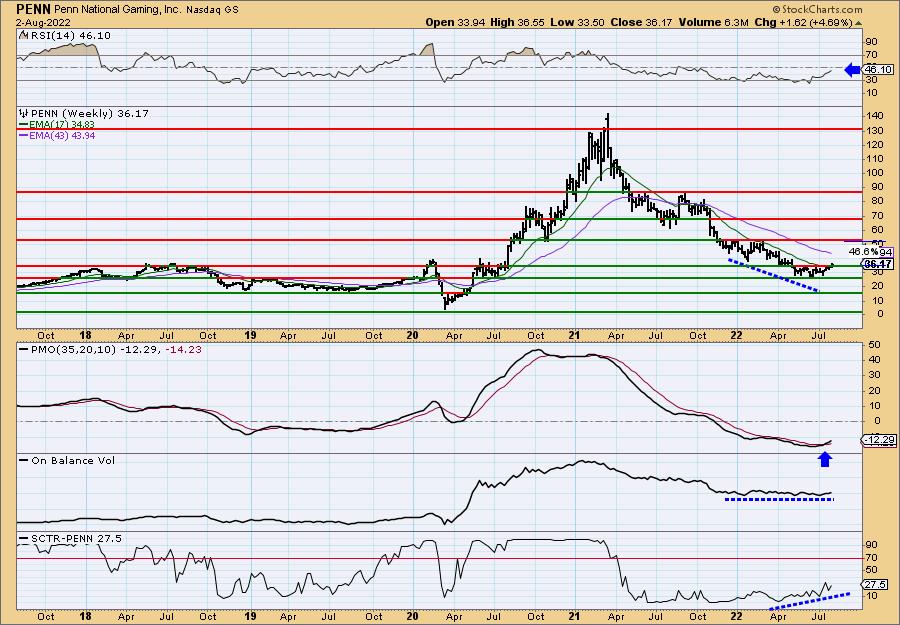
This is an important long-term breakout as well. The weekly RSI is negative but rising nicely. The weekly PMO printed a crossover BUY signal last week. The SCTR is very weak, but improving. I would say there is an OBV positive divergence since OBV bottoms are flat, while price bottoms were declining. There is a possible 40%+ gain.
TPI Composites, Inc. (TPIC)
EARNINGS: 8/3/2022 (AMC) *** REPORTS TOMORROW ***
TPI Composites, Inc. is a holding company, which engages in the manufacturing of composite wind blades for the wind energy market. It operates through the following segments: United States (US), Asia, Mexico, Europe, the Middle East & Africa (EMEA), and India. The US segment includes the production of wind blades in its Newton, Iowa plant, the manufacturing of precision molding and assembly systems used for the production of wind blades in its Warren, Rhode Island facility, and composite solutions for the transportation industry. The Asia segment produces wind blades in its Taicang Port, Dafeng, and Yangzhou, China facilities. The Mexico segment focuses on its operation of wind blades in Juárez and Matamoros, Mexico. The EMEA segment offers wind blades from two facilities in Izmir, Turkey, and performs wind blade inspection and repair services. The India segment relates to wind blade sales and other sales operation in India. The company was founded by Everett Pearson and Neil Tillotson in 1968 and is headquartered in Scottsdale, AZ.
Predefined Scans Triggered: Moved Above Upper Keltner Channel, Stocks in a New Uptrend (ADX), Moved Above Upper Price Channel and P&F Double Top Breakout.
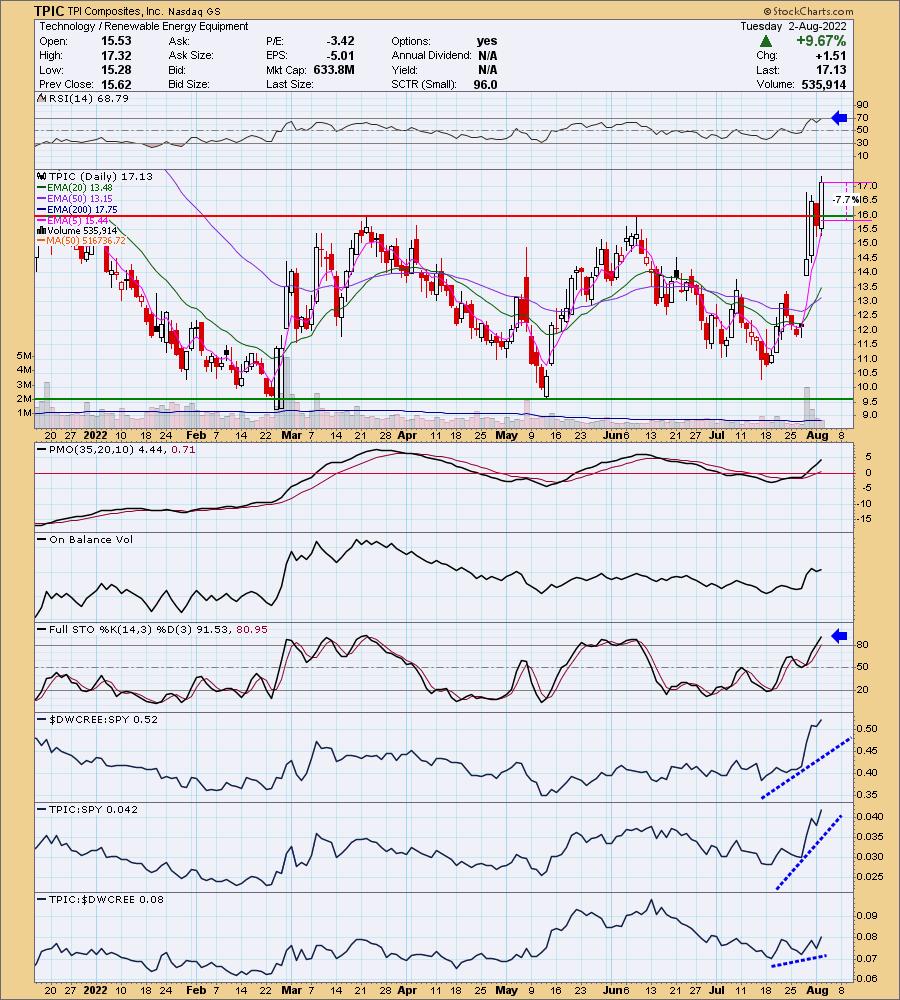
TPIC is down -1.87% in after hours trading. They report earnings tomorrow. I covered TPIC on December 16th 2020. The position is closed, but it was up over 70% at one point. We have a large bullish engulfing candlestick today. It was unfortunately up 9.67% today and is definitely due for a pullback, so time your entry and you could do very well. The RSI is positive and not yet overbought. The PMO is rising strongly and Stochastics are above 80. The group's strength is very clear and TPIC is one of the better performers. The stop is set at 7.7% or $30.32.
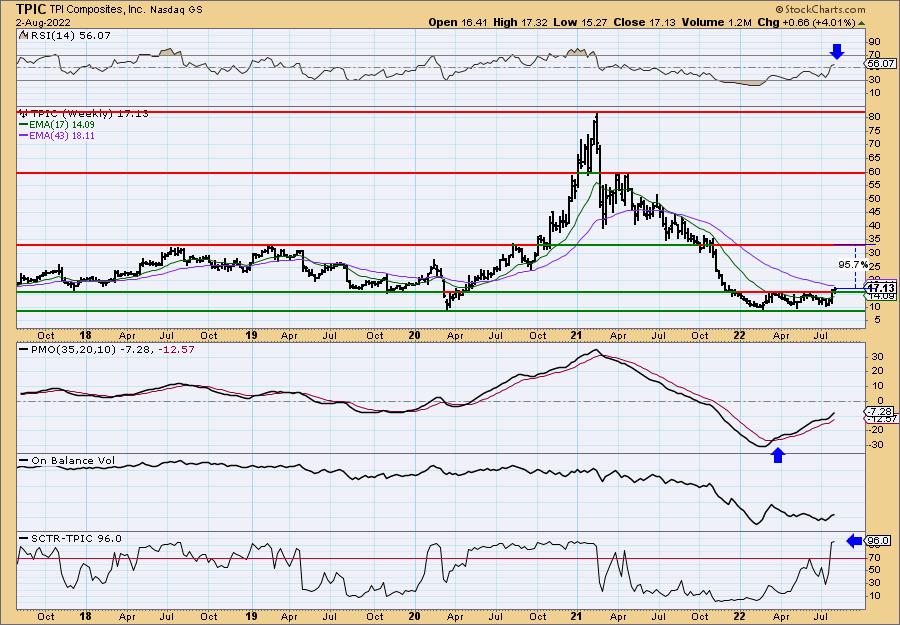
The breakout is even more impressive on the weekly chart. The PMO is rising out of oversold territory and the weekly RSI just reached positive territory. The SCTR is outstanding. Upside potential could be over 90%.
Don't forget, on Thursdays I look at reader-requested symbols, click HERE to send me an email. I read every email I receive and try to answer them all!
Current Market Outlook:
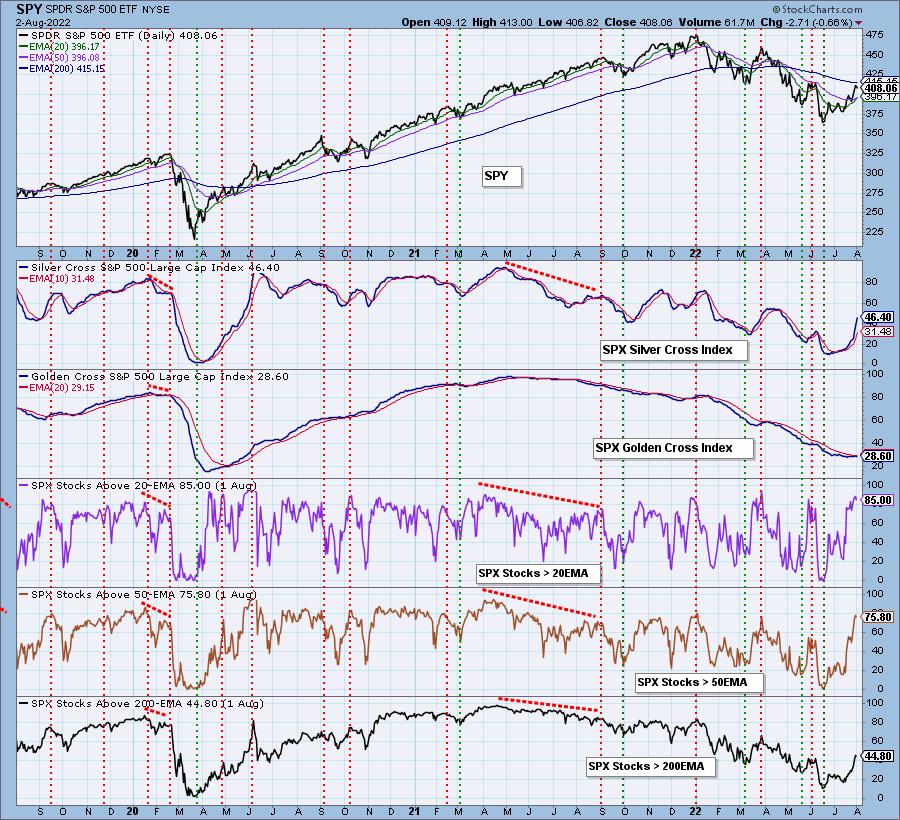
Market Environment: It is important to consider the odds for success by assessing the market tides. The following chart uses different methodologies for objectively showing the depth and trend of participation for intermediate- and long-term time frames.
- The Silver Cross Index (SCI) shows the percentage of SPX stocks on IT Trend Model BUY signals (20-EMA > 50-EMA)
- The Golden Cross Index (GCI) shows the percentage of SPX stocks on LT Trend Model BUY signals (50-EMA > 200-EMA)
Don't forget that as a "Diamonds" member, you have access to our GCI/SCI curated ChartList on DecisionPoint.com. You'll find it under "Members Only" links on the left side on the Blogs and Links Page.
Here is the current chart:
Full Disclosure: I'm 55% exposed.
I'm required to disclose if I currently own a stock I mention and/or may buy/short it within the next 72 hours.
"Technical Analysis is a windsock, not a crystal ball." - Carl Swenlin
(c) Copyright 2022 DecisionPoint.com
Watch the latest episode of DecisionPoint with Carl & Erin Swenlin on Mondays 7:00p EST or on the DecisionPoint playlist on the StockCharts TV YouTube channel here!
NOTE: The stocks reported herein are from mechanical trading model scans that are based upon moving average relationships, momentum and volume. DecisionPoint analysis is then applied to get five selections from the scans. The selections given should prompt readers to do a chart review using their own analysis process. This letter is not a call for a specific action to buy, sell or short any of the stocks provided. There are NO sure things or guaranteed returns on the daily selection of "Diamonds in the Rough."
Helpful DecisionPoint Links:
DecisionPoint Shared ChartList and DecisionPoint Chart Gallery
Price Momentum Oscillator (PMO)
Swenlin Trading Oscillators (STO-B and STO-V)
For more links, go to DecisionPoint.com