
I have been asked by many subscribers about including more ETFs as "Diamonds in the Rough". I have toyed with the idea of an "ETF Day". I think I'll try on Wednesdays to include at least one ETF if not more. The "runners-up" list will include stocks and ETFs if applicable. My scans don't usually return that many ETFs, but Carl and I have a ChartList called the "ETF Tracker".
There are 81 ETFs in that list ranging from sectors to industry groups to indexes. I did a visual look on them and found one I am including today that happens to match the "theme" from my scans: Software. The other is the Cybersecurity ETF (HACK) which fits into the Technology theme today.
The ETF that came from my scans also seems appropriate given the emphasis on clean energy right now: Global Carbon ETF (KRBN).
If you would like me to share my ETF Tracker ChartList with you, just send me an email request here. ** You must be a StockCharts Extra member or above to receive the ChartList and you need to send me the email address you use for StockCharts.com. **
One final note in response to a subscriber. Remember, PMO BUY signals, IT Trend Model BUY signals, etc are MECHANICAL BUY signals based strictly on crossovers. They are "attention flags" not calls to action! No one should buy based on mechanical signals; the chart is required reading. I will be updating our disclaimer to reflect that soon.
Good Luck & Good Trading!
Erin
Today's "Diamonds in the Rough": HACK, IGV and KRBN.
Runners-Up: BL, DT, SSNC, GDS, IAC, RPD, WIX, CHWY, WCLD and IPO.

RECORDING LINK (7/29/2022):
Topic: DecisionPoint Diamond Mine (7/29/2022) LIVE Trading Room
Start Time: Jul 29, 2022 08:59 AM
Meeting Recording Link
Access Passcode: July#29th
REGISTRATION FOR Friday 8/5 Diamond Mine:
When: Aug 5, 2022 09:00 AM Pacific Time (US and Canada)
Topic: DecisionPoint Diamond Mine (8/5/2022) LIVE Trading Room
Register in advance for this webinar HERE
Save the registration confirmation email with login instructions in case Zoom doesn't notify you in time.

StockChartsTV is now producing the recording for the free DP Trading Room! It airs at 3p ET, much sooner than I was able to get out the recording links. Carl has joined so you can "ask the master" all those questions you've always wanted his opinion on! If you haven't registered to attend live at Noon ET, you can do so HERE.
Welcome to DecisionPoint Daily Diamonds, wherein I highlight ten "Diamonds in the Rough" per week. These are selected from the results of my DecisionPoint Scans, which search for stocks that could benefit from the trend and condition of the market. Remember, these are not recommendations to buy or sell, but are the most interesting of the stocks that surfaced in my scans. My objective is to save you the work of the initial, tedious culling process, but you need to apply your own analysis to see if these stocks pique your interest as well. There are no guaranteed winners here!
"Predefined Scans Triggered" are taken from StockCharts.com using the "Symbol Summary" option instead of a "SharpChart" on the workbench.
PureFunds ISE Cyber Security ETF (HACK)
EARNINGS: N/A
HACK tracks a tiered, equal-weighted index that targets companies actively involved in providing cybersecurity technology and services.
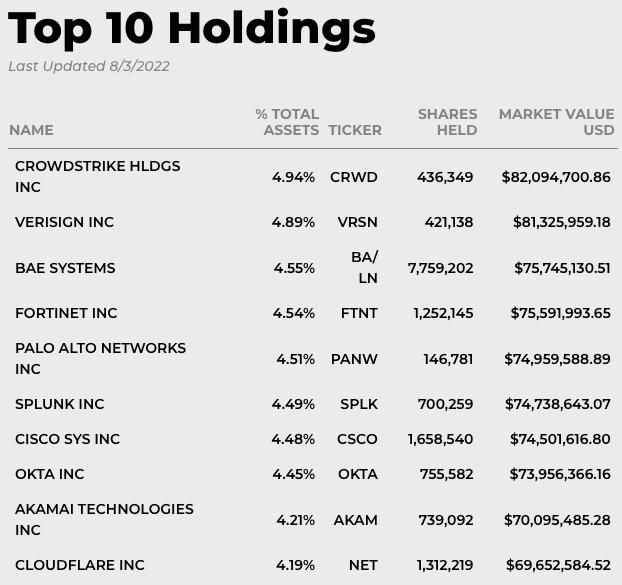
Predefined Scans Triggered: New CCI Buy Signals, Moved Above Upper Bollinger Band, Stocks in a New Uptrend (Aroon), Moved Above Upper Price Channel, P&F Double Top Breakout and P&F Triple Top Breakout.
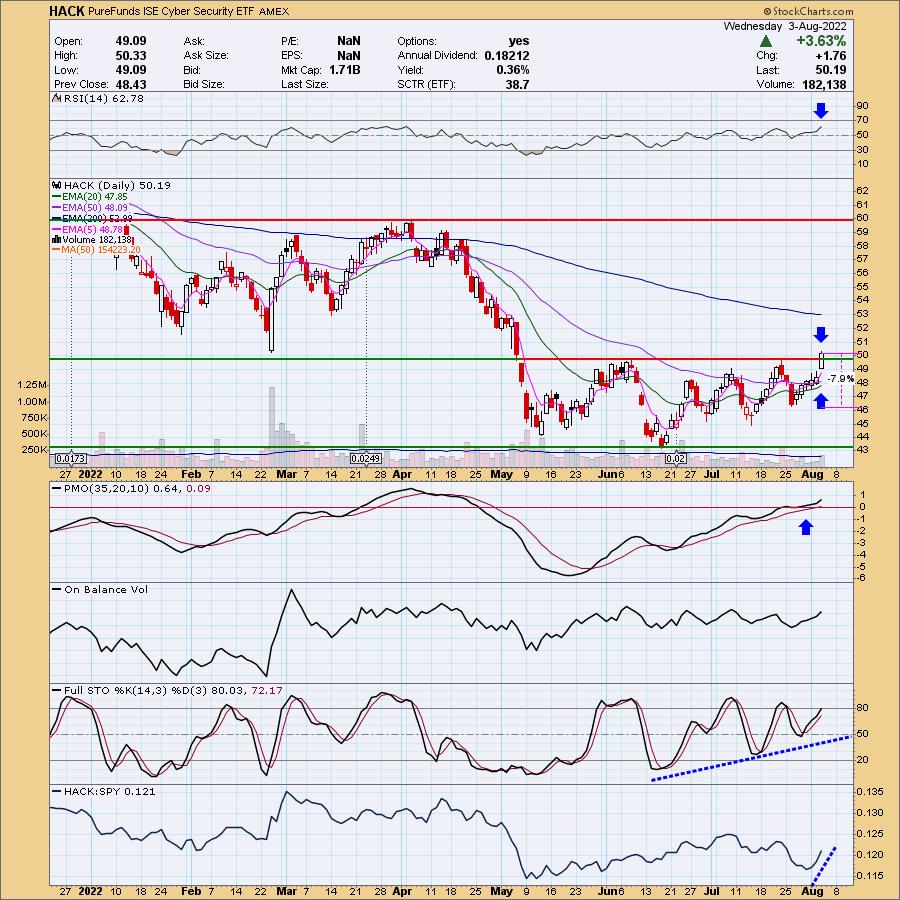
HACK is down -0.56% in after hours trading. I've covered it twice before; both positions are closed: March 1st 2022 and August 26th 2021. What caught my eye on this chart was the breakout. The RSI is positive, rising and not overbought. The 20-day EMA is working toward a 50-day EMA crossover that would give us an IT Trend Model "Silver Cross" BUY signal. The PMO bottomed above its signal line and is now in positive territory. Stochastics are rising and just moved above 80. Consider a stop at about 7.9% around $46.22.
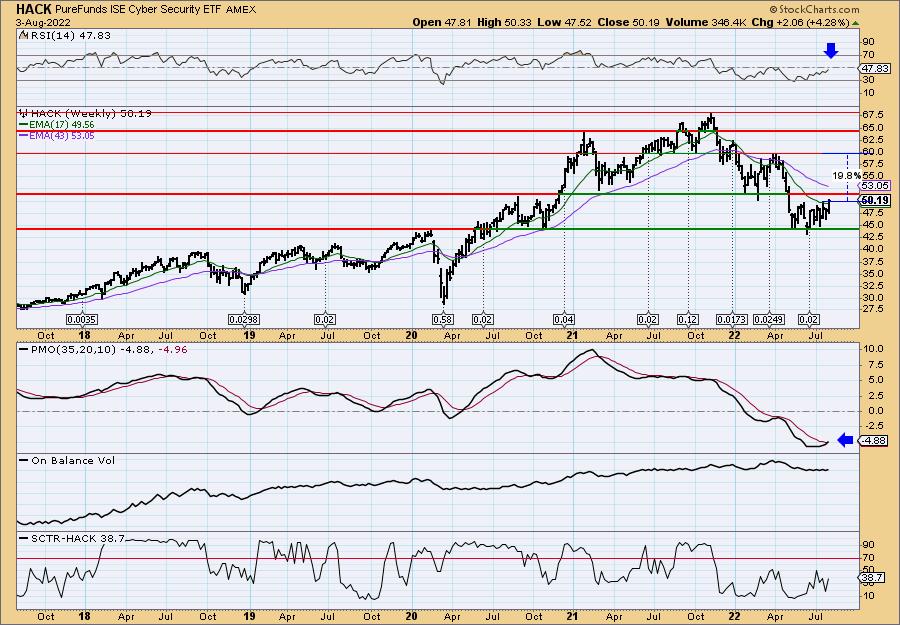
The weekly chart is very favorable particularly because the weekly PMO is crossing over its signal line. The price reversal came off strong long-term support. Dividends are very irregular, but it at least has some. The weekly RSI is nearing positive territory and the SCTR is improving for now.
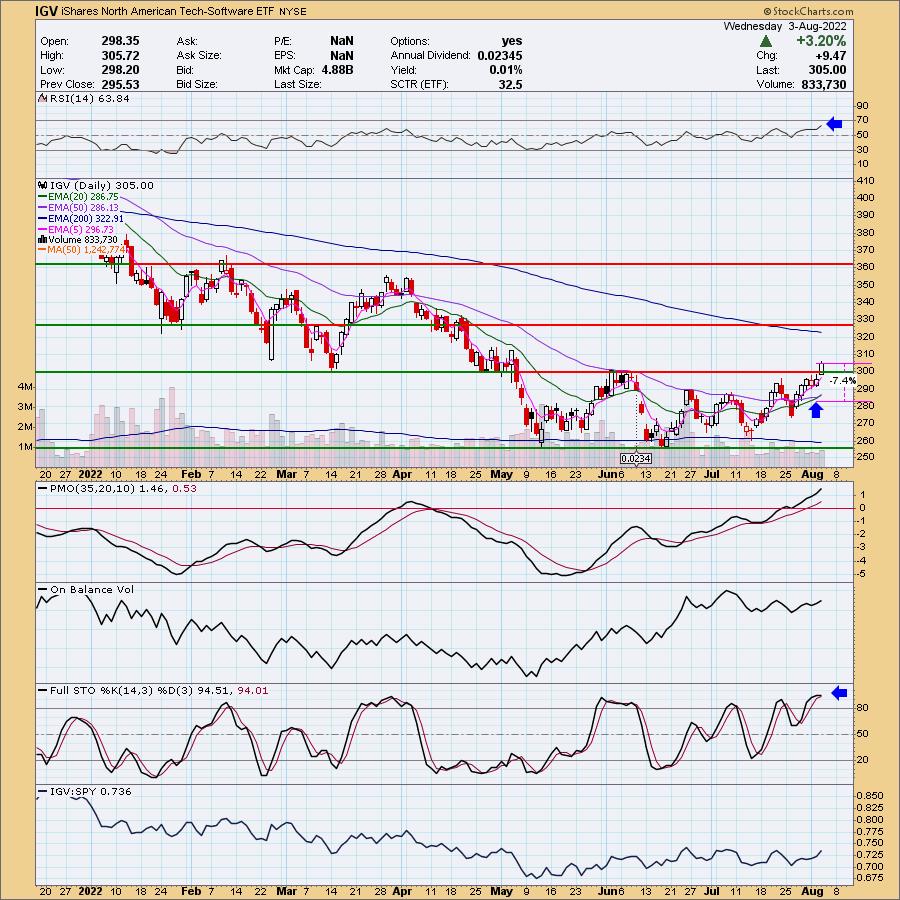
iShares North American Tech-Software ETF (IGV)
EARNINGS: N/A
IGV tracks a market-cap-weighted index of US and Canadian software companies.
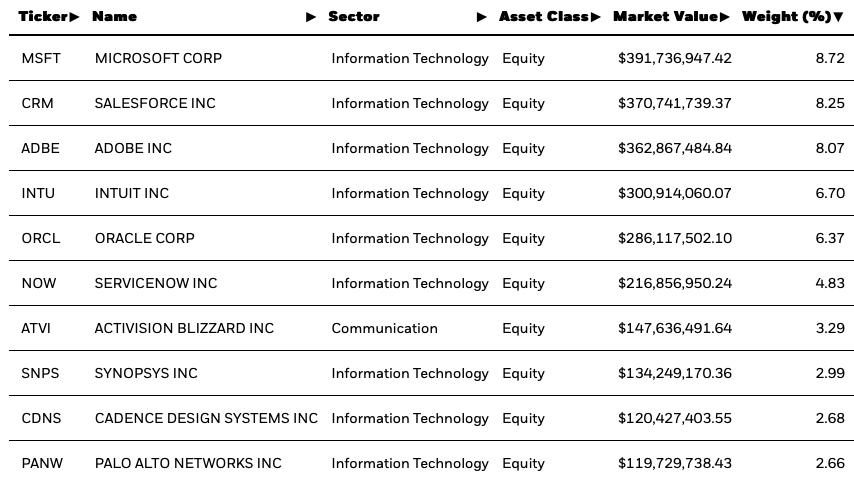
Predefined Scans Triggered: Elder Bar Turned Green, Moved Above Upper Keltner Channel, Moved Above Upper Bollinger Band, Moved Above Ichimoku Cloud, Moved Above Upper Price Channel and P&F Double top Breakout.
IGV is down -0.25% in after hours trading. This ETF also had a nice breakout today. Additionally we did get an IT Trend Model "Silver Cross" BUY signal. The RSI is positive, rising and not yet overbought. The PMO is accelerating higher in positive territory. Stochastics are above 80. Clearly, relative strength has improved over the last two weeks. Consider a stop level of 7.4% around $282.43.
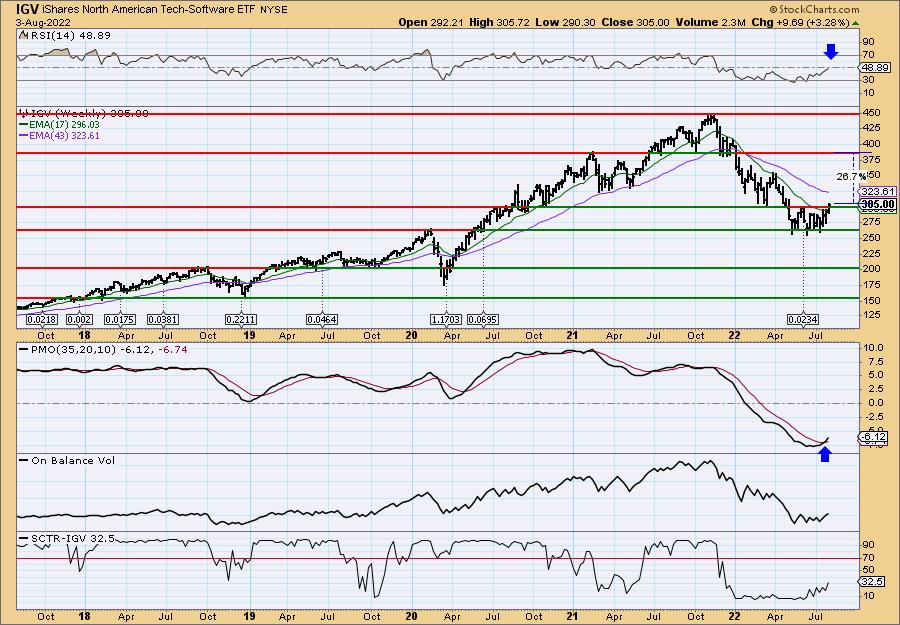
The breakout is important on the weekly chart as it aligns with the 2020 bear market top. This breakout takes price above resistance and the 17-week EMA. If it can maintain this rally, we could see an over 26% gain.
KFA Global Carbon ETF (KRBN)
EARNINGS: N/A
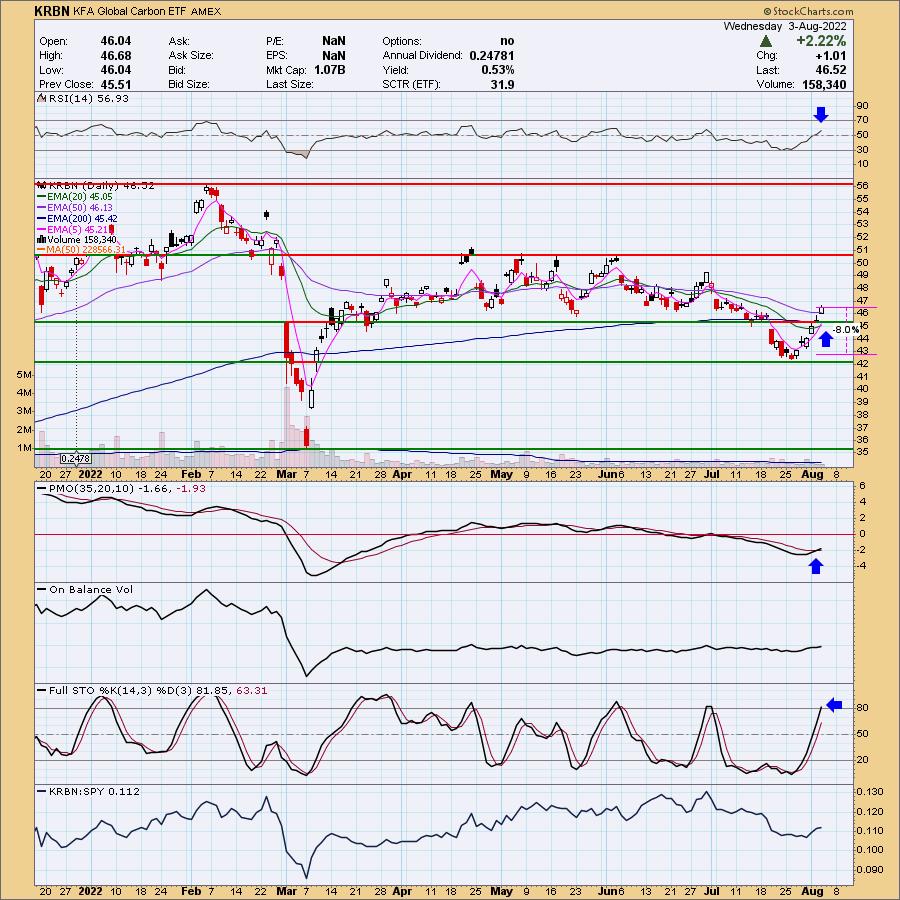
KRBN seeks to track a carbon credit futures index that weights holdings based on trade volume. The fund holds December futures from three major cap-and-trade programs. For more information, click here.
Predefined Scans Triggered: None
KRBN is down -0.43% in after hours trading. KRBN just barely hit my average daily volume threshold of 150,000. This one broke out above overhead resistance and the 50-day EMA. The 5-day EMA crossed above the 20-day EMA for a Short-Term Trend Model BUY signal. The RSI is rising, positive and not overbought. The PMO just trigger a crossover BUY signal. Stochastics are above 80. I'd like to set the stop below support around $42, but that is rather deep. Depending on your risk profile you can/should adjust to what makes sense. I have it at 8% around $42.80.
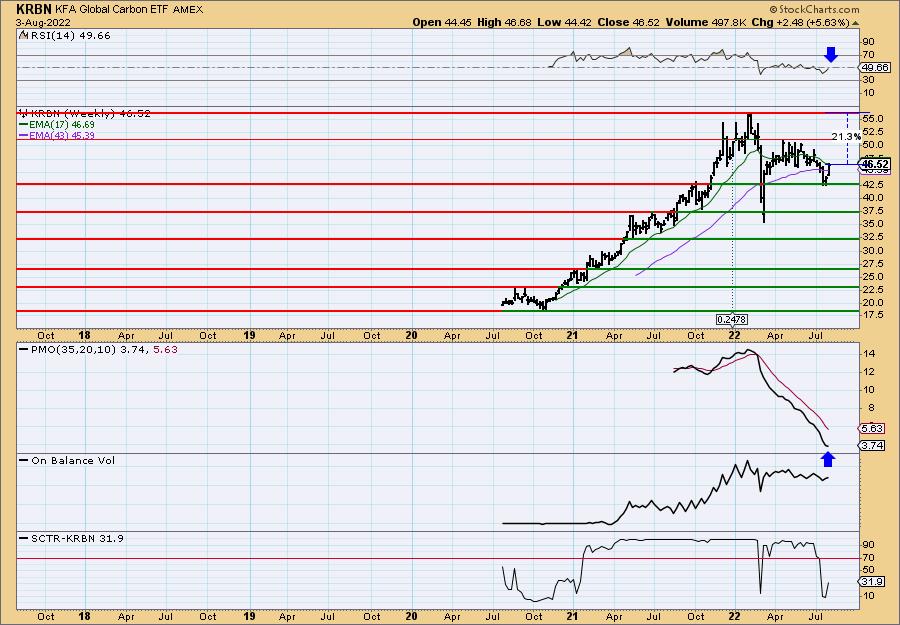
The weekly RSI is nearing positive territory and the weekly PMO is trying to turn back up. The rebound came off support at one of the 2021 tops. It could move up 21%+, but even a 16% gain (which takes it to near-term resistance) is good for me too.
Don't forget, on Thursdays I look at reader-requested symbols, click HERE to send me an email. I read every email I receive and try to answer them all!
Current Market Outlook:
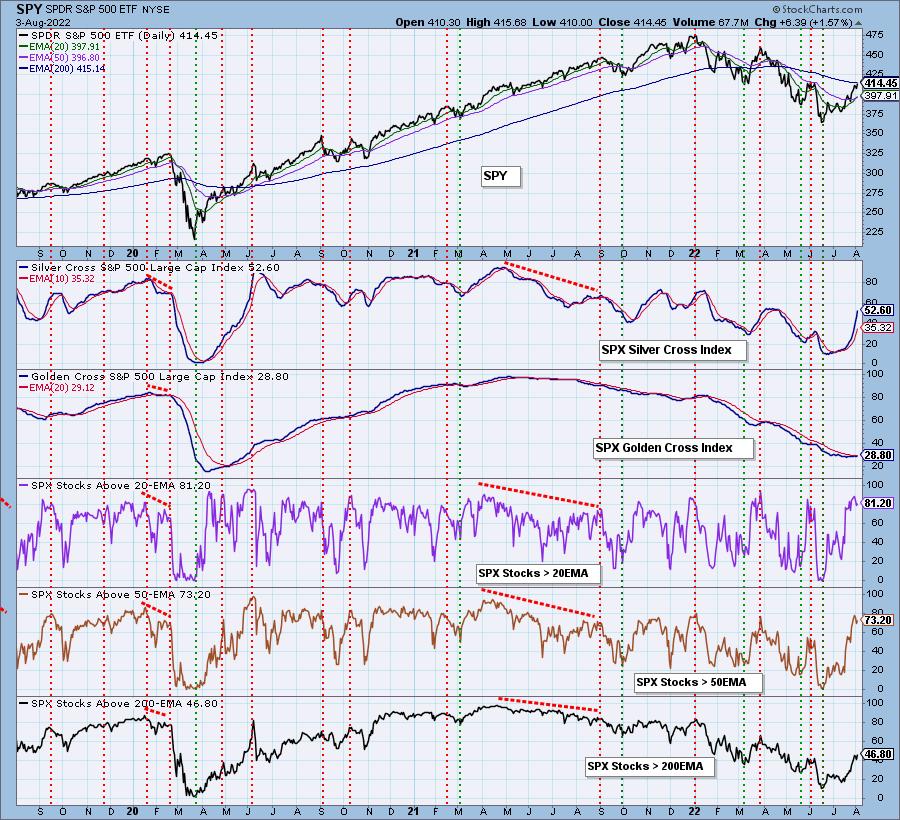
Market Environment: It is important to consider the odds for success by assessing the market tides. The following chart uses different methodologies for objectively showing the depth and trend of participation for intermediate- and long-term time frames.
- The Silver Cross Index (SCI) shows the percentage of SPX stocks on IT Trend Model BUY signals (20-EMA > 50-EMA)
- The Golden Cross Index (GCI) shows the percentage of SPX stocks on LT Trend Model BUY signals (50-EMA > 200-EMA)
Don't forget that as a "Diamonds" member, you have access to our GCI/SCI curated ChartList on DecisionPoint.com. You'll find it under "Members Only" links on the left side on the Blogs and Links Page.
Here is the current chart:
Full Disclosure: I'm 55% exposed. Contemplating adding HACK and IGV.
I'm required to disclose if I currently own a stock I mention and/or may buy/short it within the next 72 hours.
"Technical Analysis is a windsock, not a crystal ball." - Carl Swenlin
(c) Copyright 2022 DecisionPoint.com
Watch the latest episode of DecisionPoint with Carl & Erin Swenlin on Mondays 7:00p EST or on the DecisionPoint playlist on the StockCharts TV YouTube channel here!
NOTE: The stocks reported herein are from mechanical trading model scans that are based upon moving average relationships, momentum and volume. DecisionPoint analysis is then applied to get five selections from the scans. The selections given should prompt readers to do a chart review using their own analysis process. This letter is not a call for a specific action to buy, sell or short any of the stocks provided. There are NO sure things or guaranteed returns on the daily selection of "Diamonds in the Rough."
Helpful DecisionPoint Links:
DecisionPoint Shared ChartList and DecisionPoint Chart Gallery
Price Momentum Oscillator (PMO)
Swenlin Trading Oscillators (STO-B and STO-V)
For more links, go to DecisionPoint.com