
Well, not surprisingly there were no reader requests today. We're all stumped by this crazy market. The scans were interesting today. I had no shorts come up at all. This is likely due to the fact we've had this whipsaw and the scan requires a trend in momentum. Similarly it's opposite, the Diamond PMO Scan also came up empty for likely the same reason.
Since no shorts came up, I'm going to present three longs. Gold Miners are one of the few bright spots in the market right now so I've included one. I also found a Defense stock that we've used before, KTOS. The last pick is a Biotech that seems to be bucking the trend of the market.
As noted yesterday, I'm keeping my exposure at 10% which is basically my buy and hold positions, one of which is Gold.
Tomorrow is the Diamond Mine trading room! It should be an exciting day as all of them have been in this rocky market. Don't miss out, registration information is below.
Good Luck & Good Trading,
Erin
Today's "Diamonds in the Rough": KTOS, NEM and PRVA.
Runner-ups: NOC, DY, CERT and RGLD.

Diamond Mine Trading Room:
RECORDING & DOWNLOAD LINK (4/4/2025):
Topic: DecisionPoint Diamond Mine (4/4/2025) LIVE Trading Room
Recording & Download Link
Passcode: April#4th
REGISTRATION for 4/11/2025:
When: April 11, 2025 09:00 AM Pacific Time (US and Canada)
Topic: DecisionPoint Diamond Mine LIVE Trading Room
Register in advance for this webinar HERE
After registering, you will receive a confirmation email containing information about joining the webinar.

Below is the latest free DecisionPoint Trading Room recording from 4/7. You'll find these recordings posted on Mondays to our DP YouTube Channel. Be sure and subscribe HERE.
Welcome to DecisionPoint Diamonds, wherein I highlight ten "Diamonds in the Rough" per week. These are selected from the results of my DecisionPoint Scans which search for stocks that could benefit from the trend and condition of the market. Remember, these are not recommendations to buy or sell, but are the most interesting of the stocks that surfaced in my scans. My objective is to save you the work of the initial, tedious culling process, but you need to apply your own analysis to see if these stocks pique your interest as well. There are no guaranteed winners here!
"Predefined Scans Triggered" are taken from StockCharts.com using the "Symbol Summary" option instead of a "SharpChart" on the workbench.
Stop levels are all rounded down.
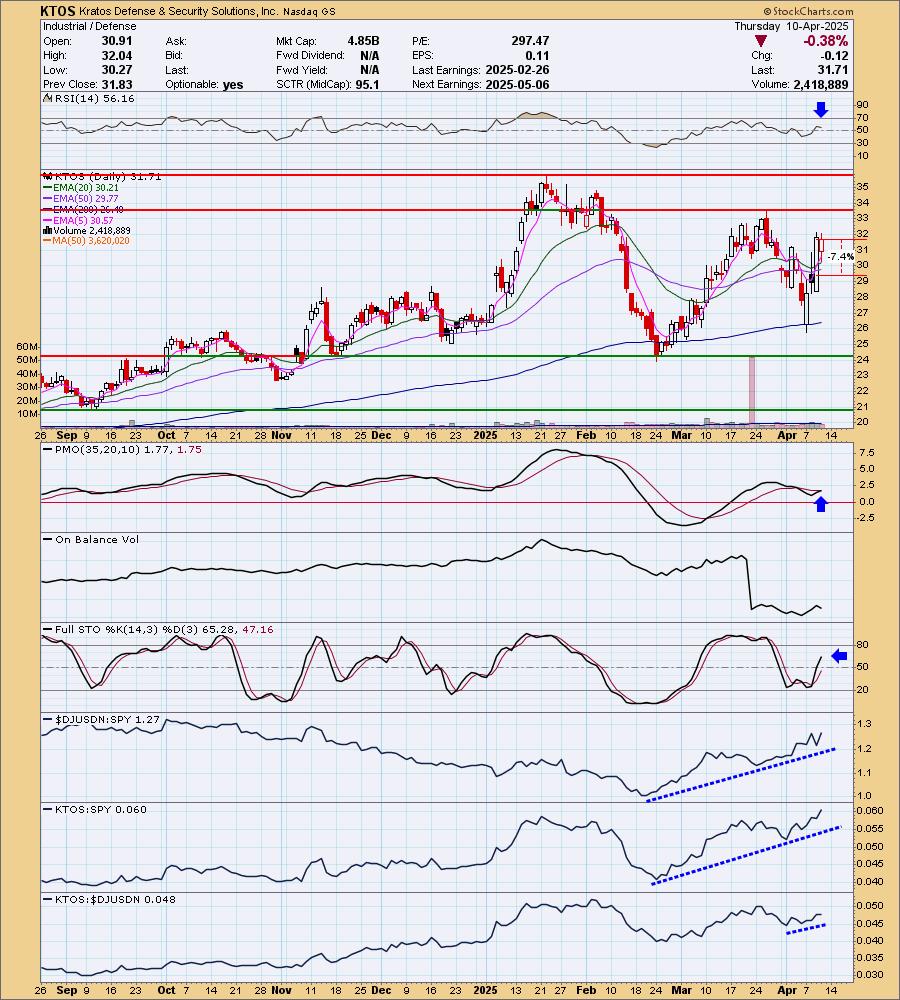
Kratos Defense & Security Solutions, Inc. (KTOS)
EARNINGS: 2025-05-06 (AMC)
Kratos Defense & Security Solutions, Inc. engages in the provision of mission critical products, services and solutions for United States national security priorities. It operates through the Kratos Government Solutions (KGS) and Unmanned Systems (US) segments. The KGS segment consists of an aggregation of KGS operating segments, including microwave electronic products, space, satellite and cyber, training solutions. The US segment refers to the unmanned aerial, unmanned ground, unmanned seaborne and related command, control and communications system businesses. The company was founded on December 19, 1994, and is headquartered in Round Rock, TX.
Predefined Scans Triggered: Hollow Red Candles.
KTOS is down -0.35% in after hours trading. This was one of the few charts with a positive PMO and I liked that it has seen a strong rally despite the crazy trading we've seen. It looks somewhat cup and handle-ish, the cup is a little pointed though. The RSI is positive and not overbought. The PMO just saw a new Crossover BUY Signal which occurred above the zero line. Stochastics are very positive rising vertically. Relative strength is going its way for the group and KTOS against the SPY and the group. I've set the stop beneath the 50-day EMA at 7.4% or $29.36.
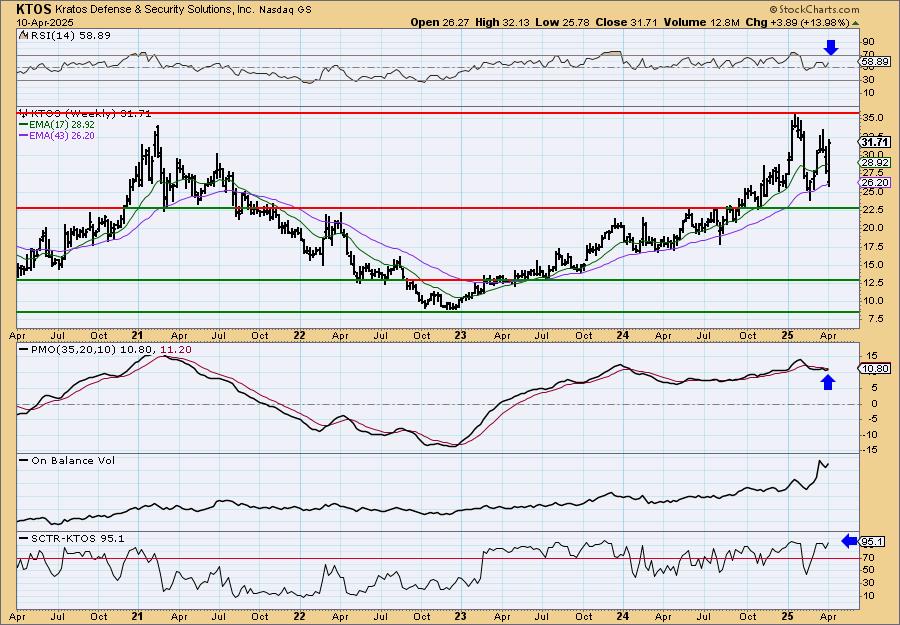
I like the weekly chart except for the double top look. The second top is not that even with the other top so it isn't really official and given the rest of the chart is positive, I still like it in the intermediate term. The weekly RSI is positive and not overbought. The weekly PMO is rising again well above the zero line. The StockCharts Technical Rank (SCTR) is at the top of the hot zone*. Consider a 17% upside target to about $37.10.
*If a stock is in the "hot zone" above 70, it implies that it is stronger than 70% of its universe (large-, mid-, small-caps and ETFs) primarily in the intermediate to long terms.
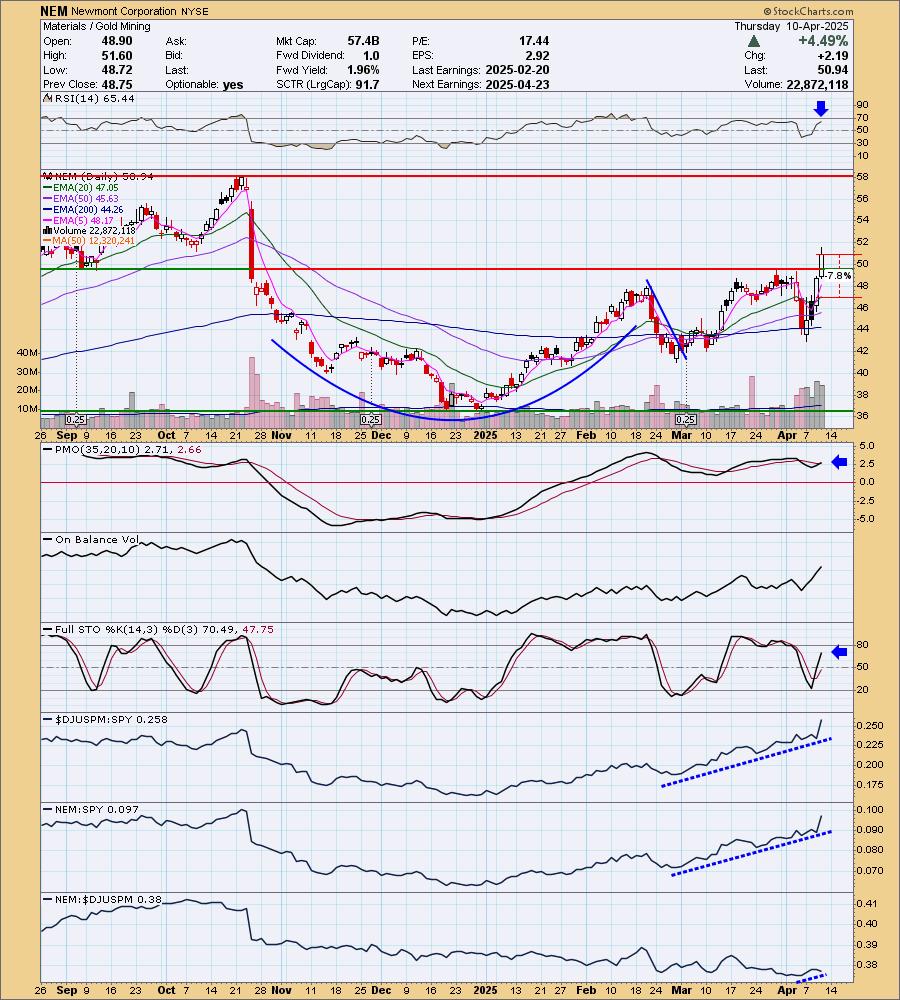
Newmont Corporation (NEM)
EARNINGS: 2025-04-23 (AMC)
Newmont Corp. engages in the exploration and acquisition of gold properties, containing copper, silver, lead, zinc or other metals. It operates through the following geographical segments: Canada, Mexico, Suriname, Argentina, Peru, Australia, Papua New Guinea, Ghana, and U.S. The company was founded by William Boyce Thompson on May 2, 1921 and is headquartered in Denver, CO.
Predefined Scans Triggered: Moved Above Upper Bollinger Band, Moved Above Upper Price Channel, P&F Ascending Triple Top Breakout, New CCI Buy Signals and P&F Double Top Breakout.
NEM is up +0.26% in after hours trading. Here we do have an official cup with handle pattern that did execute with a rally. Price has broken out above resistance too. The RSI is positive and not yet overbought which is good given this strong rally. The PMO has given us a Crossover BUY Signal above the zero line. Volume is definitely coming in. Stochastics are rising vertically toward 80. The group is clearly outperforming and NEM is taking advantage as it is also outperforming the SPY. It is traveling mostly in line with its group which I'll accept. The stop is set at the 20-day EMA at 7.8% or $46.96.
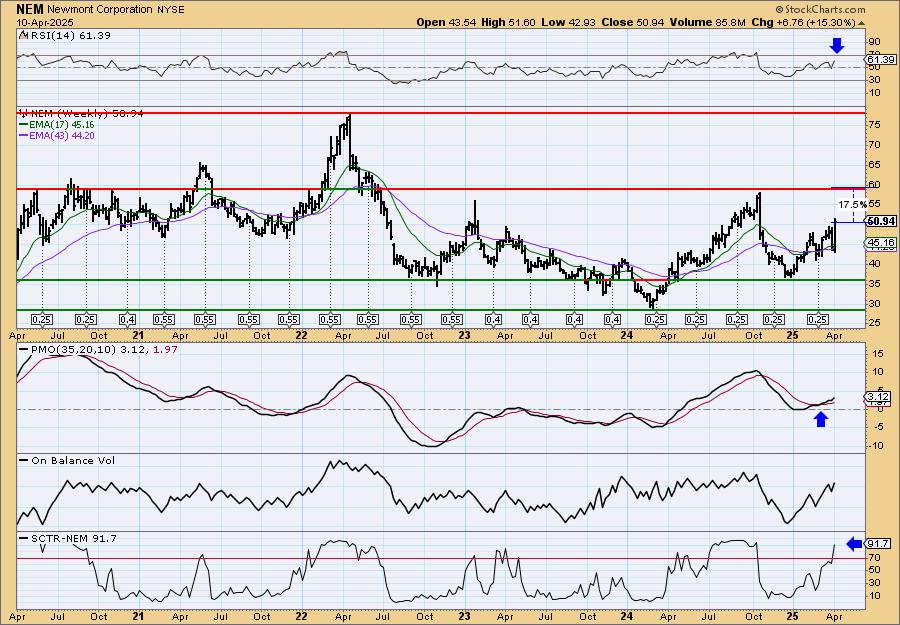
I like where it's headed right now, straight up to overhead resistance on a nice rising trend. The weekly RSI is positive and not overbought. The weekly PMO is rising on a Crossover BUY Signal above the zero line. The SCTR looks fantastic in the hot zone above 70. I think we'll see a breakout.
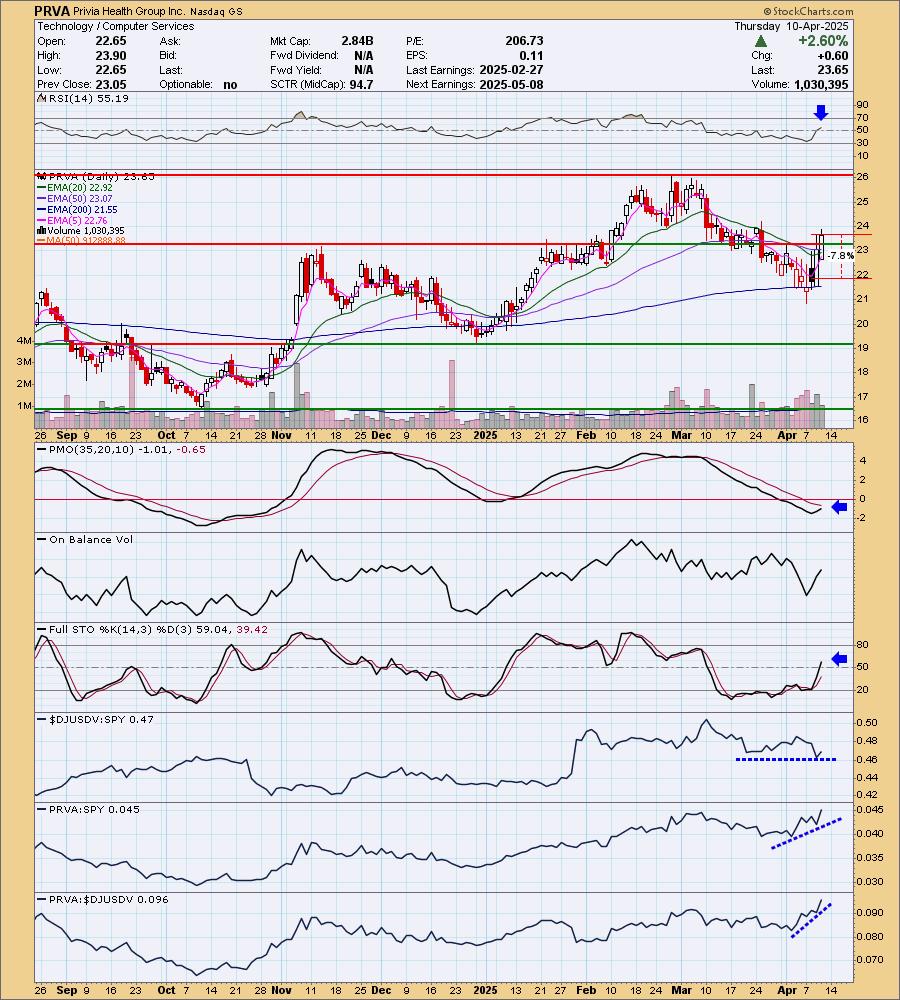
Privia Health Group Inc. (PRVA)
EARNINGS: 2025-05-08 (BMO)
Privia Health Group, Inc. engages in the provision of healthcare services. It collaborates with medical groups, health plans, and health systems to optimize physician practices, improve patient experience, and reward doctors for delivering care both in-person and via its Privia Platform, virtual care settings. The company was founded by Jeffrey Butler on November 7, 2007 and is headquartered in Arlington, VA.
Predefined Scans Triggered: Bullish MACD Crossovers and P&F High Pole.
PRVA is unchanged in after hours trading. I really liked the breakout from the intermediate-term declining trend. It also bounced off the 200-day EMA and is headed for a Silver Cross (20-day EMA > 50-day EMA). The RSI just moved into positive territory. The PMO is rising out of oversold territory and is nearing a Crossover BUY Signal. Stochastics are rising strongly. The Biotechs aren't performing that well right now, but PRVA is outperforming the group and the market so that's okay with me. The stop is set as close to the 200-day EMA as I could within my stop range of 6%-8%. I chose 7.8% or $21.80.
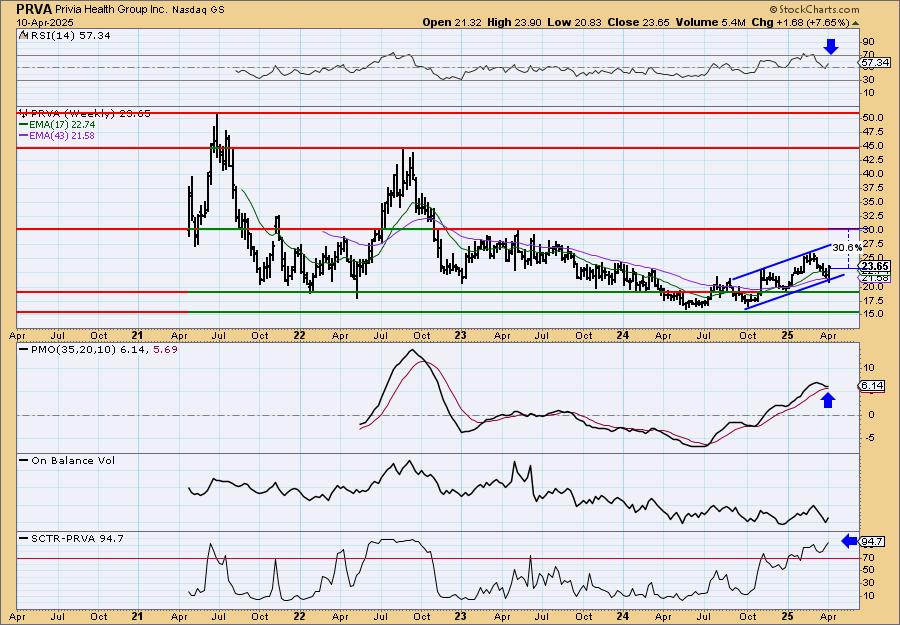
I like the rising trend channel on the weekly chart. It appears price is ready to test the top of the channel. The weekly RSI is positive and not at all overbought. The weekly PMO is beginning to decelerate for a possible bottom above the signal line. The SCTR is very strong at 94.7%.
Don't forget, on Thursdays I look at reader-requested symbols, click HERE to send me an email. I read every email I receive and try to answer them all!
Current Market Outlook:
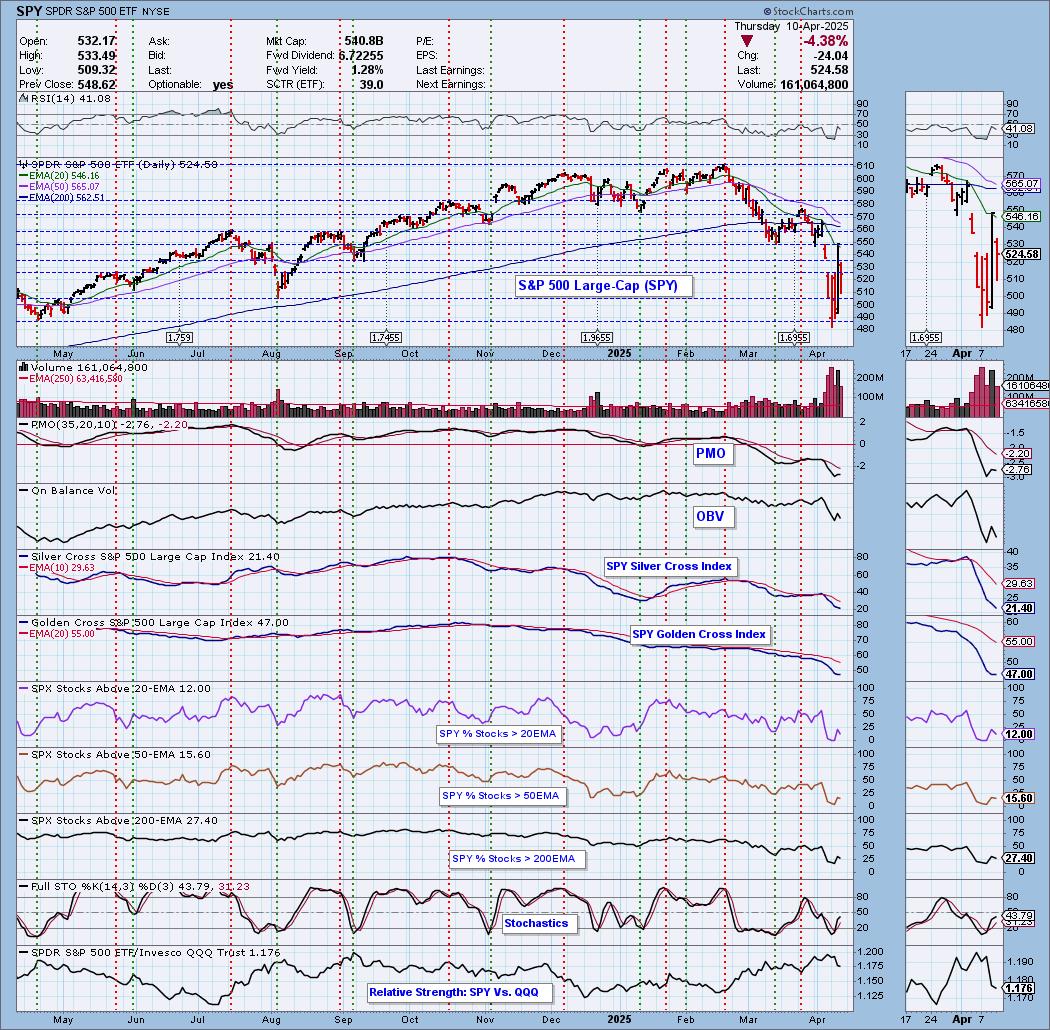
Market Environment: It is important to consider the odds for success by assessing the market tides. The following chart uses different methodologies for objectively showing the depth and trend of participation for intermediate- and long-term time frames.
- The Silver Cross Index (SCI) shows the percentage of SPX stocks on IT Trend Model BUY signals (20-EMA > 50-EMA)
- The Golden Cross Index (GCI) shows the percentage of SPX stocks on LT Trend Model BUY signals (50-EMA > 200-EMA)
Don't forget that as a "Diamonds" member, you have access to our "Under the Hood" curated ChartList on DecisionPoint.com. You'll find it under "Members Only" links on the left side on the Blogs and Links Page.
Here is the current chart:
Full Disclosure: I am 10% long, 0% short.
I'm required to disclose if I currently own a stock I mention and/or may buy/short it within the next 72 hours.
"Technical Analysis is a windsock, not a crystal ball." - Carl Swenlin
(c) Copyright 2025 DecisionPoint.com
Watch the latest episode of DecisionPoint Trading Room with Carl Swenlin & Erin Swenlin Mondays on the DecisionPoint YouTube channel here!
NOTE: The stocks reported herein are from mechanical trading model scans that are based upon moving average relationships, momentum and volume. DecisionPoint analysis is then applied to get five selections from the scans. The selections given should prompt readers to do a chart review using their own analysis process. This letter is not a call for a specific action to buy, sell or short any of the stocks provided. There are NO sure things or guaranteed returns on the daily selection of "Diamonds in the Rough."
Regarding BUY/SELL Signals: The signal status reported herein is based upon mechanical trading model signals and crossovers. They define the implied bias of the price index/stock based upon moving average relationships and momentum, but they do not necessarily call for a specific action. They are information flags that should prompt chart review. Further, they do not call for continuous buying or selling during the life of the signal. For example, a BUY signal will probably (but not necessarily) return the best results if action is taken soon after the signal is generated. Additional opportunities for buying may be found as price zigzags higher, but the trader must look for optimum entry points. Conversely, exit points to preserve gains (or minimize losses) may be evident before the model mechanically closes the signal.
Helpful DecisionPoint Links:
Price Momentum Oscillator (PMO)
Swenlin Trading Oscillators (STO-B and STO-V)
For more links, go to DecisionPoint.com